Table of Contents
QUICK SUMMARY:
A data visualization dashboard presents real-time marketing performance in a single, interactive view. It replaces manual reports with automated updates and visual insights. This article breaks down key differences between dashboards and reports and shares 11 examples that simplify campaign data analysis, speed up reporting, and support faster, more informed decisions across marketing channels.
It’s 8:57 AM on a Monday. You’ve got a client call in three minutes, five tabs open, and performance data scattered across platforms. You’re toggling between dashboards, copying numbers into a spreadsheet, and hoping no one asks a question you can’t answer without digging.
This is what reporting looks like for too many agencies. The issue isn’t a lack of raw data. It’s that it’s buried, fragmented, and way too manual. Business intelligence is supposed to make decision-making easier, but it often adds more complexity without the right tools. Clients want quick answers and visual proof that their investment is paying off. Agencies want to stop burning hours building reports that no one reads.
A strong data visualization dashboard flips that script.
It gives clients instant clarity and frees your team to focus on strategy, not spreadsheets. And you don’t have to be a data scientist! Today we’re sharing 11 dashboard examples that show how smart design turns raw numbers into client-ready insights that drive real conversations.
Let’s get started!
What is a Data Visualization Dashboard?
A data visualization dashboard is a centralized view of your marketing performance. It makes it easier to collect and explore data from a client’s marketing campaign.
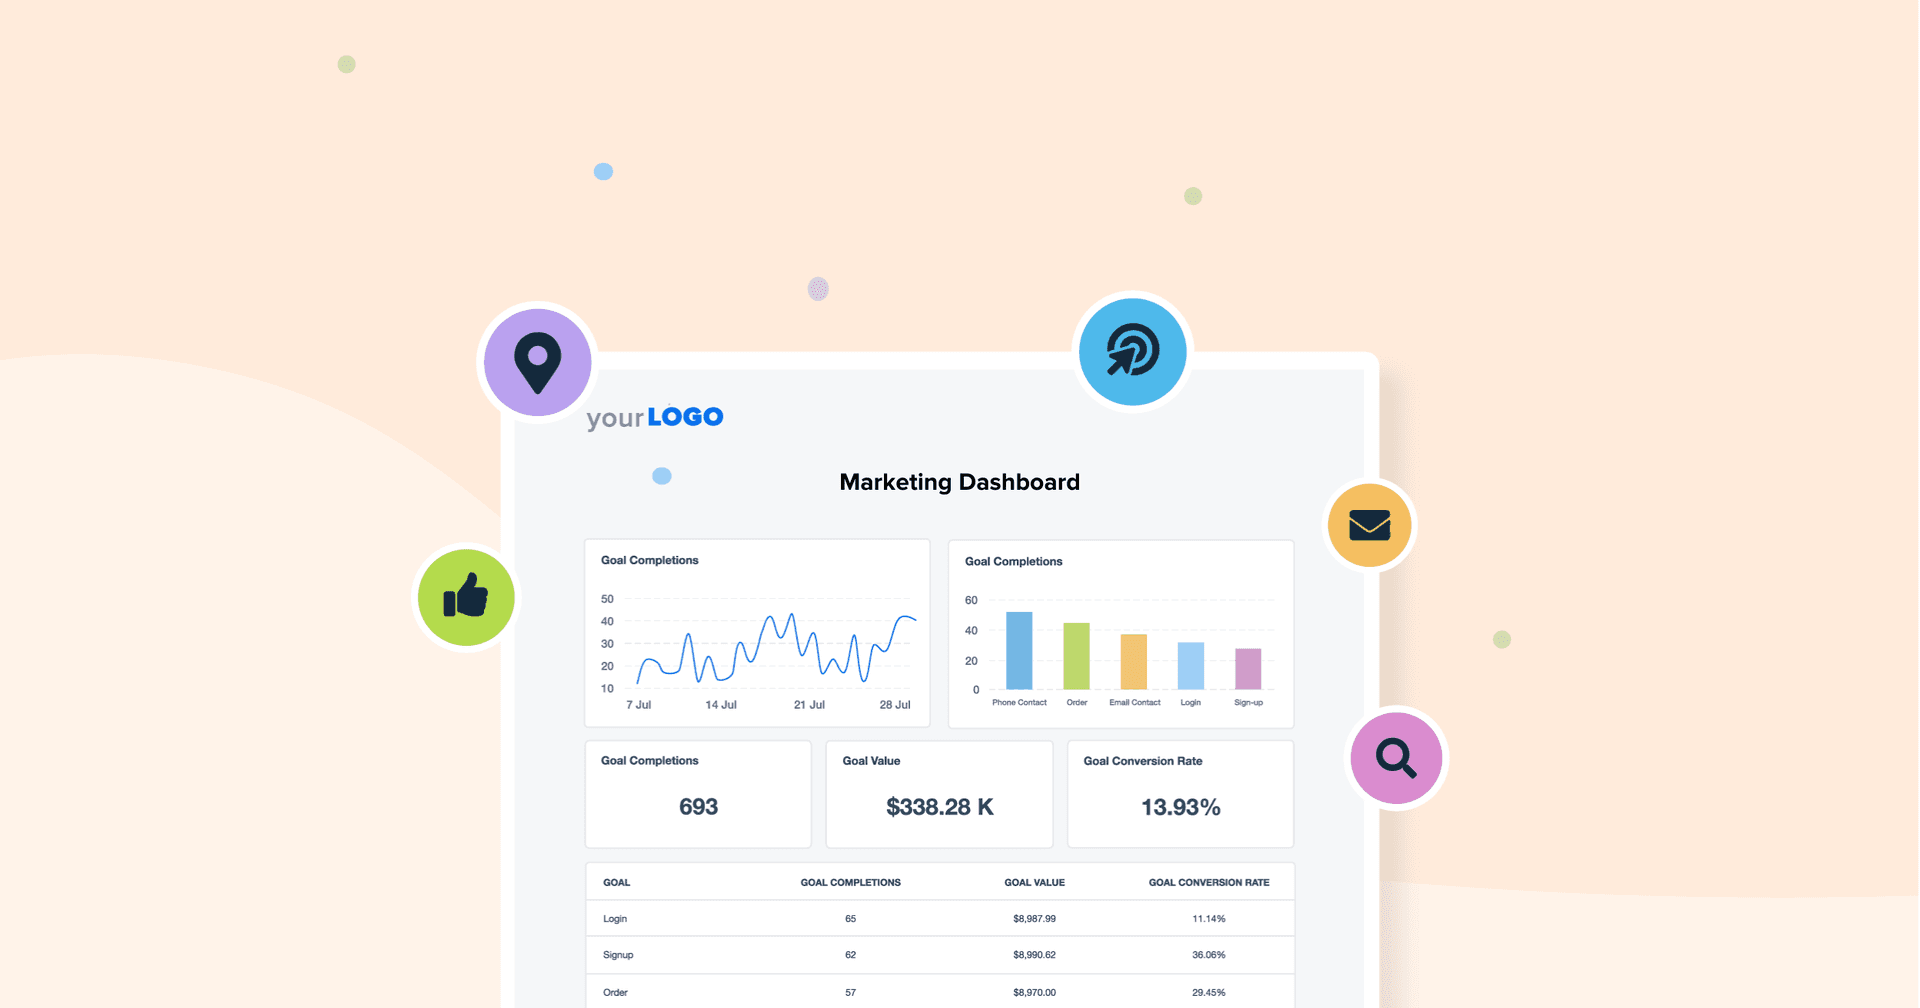
A digital marketing dashboard connects to marketing platforms, pulls in real-time metrics, and turns them into visual elements like bar and pie charts.
Unlike static reports, these dashboards update automatically and let you filter by campaign, time range, or channel. That means fewer manual tasks for your team and faster insights for your clients.
Data Dashboards vs. Reports
Let’s clarify something: a dashboard isn’t just a prettier version of a marketing report.
Dashboards are built for real-time visibility and ongoing performance monitoring, while reports are snapshots in time, usually shared on a schedule.
So, how does an agency know which to use—dashboards vs. reports? Both have their place. But for busy agencies juggling dozens of clients, a dashboard will reduce time spent on reporting while making it easier to spot trends, answer questions on the fly, and surface wins that matter.
Agency Tip: Turn on Anomaly Detection for any compatible widget within the AgencyAnalytics platform. This helps agencies instantly identify and analyze unexpected performance trends.
The Importance of Visualizing Data Clearly
Even the most sophisticated marketing strategy will fall flat if clients can’t see the impact. And let’s be honest. Most clients aren’t digging through spreadsheets. They’re skimming for answers.
That’s why visual clarity has now become a client retention strategy.
When agency dashboards are clean, intuitive, and built with context in mind, clients see the data—but more importantly, they understand it! They recognize what’s working, where there’s room to improve, and why their agency is worth the investment.
Clear visualization also benefits your team. It reduces back-and-forth questions, supports data-driven decision-making, and makes monthly calls feel like strategic conversations instead of status updates.
Agencies using visual dashboards consistently report stronger client engagement, better alignment on goals, and fewer reporting headaches. And when dashboards are easy to read, they’re easier to trust. This means fewer surprises, more collaboration, and longer client relationships.
Get your entire team aligned with dashboard reporting software that supports unlimited users.
Impress clients and save hours with custom, automated reporting.
Join 7,000+ agencies that create reports in under 30 minutes per client using AgencyAnalytics. Get started for free. No credit card required.
Already have an account?
Log in7 Data Visualization Dashboard Examples
Every agency approaches reporting differently, but the most effective dashboards focus on one thing: turning data into decisions.
The examples below show how agencies use visual data dashboards to streamline reporting and keep clients aligned on performance.
Each one is built using ready-to-go templates available in AgencyAnalytics. They’re designed specifically for marketing agencies, pulling in live data, supporting full customization, and helping teams focus on what moves the needle visually.
1. Social Media Dashboard Example
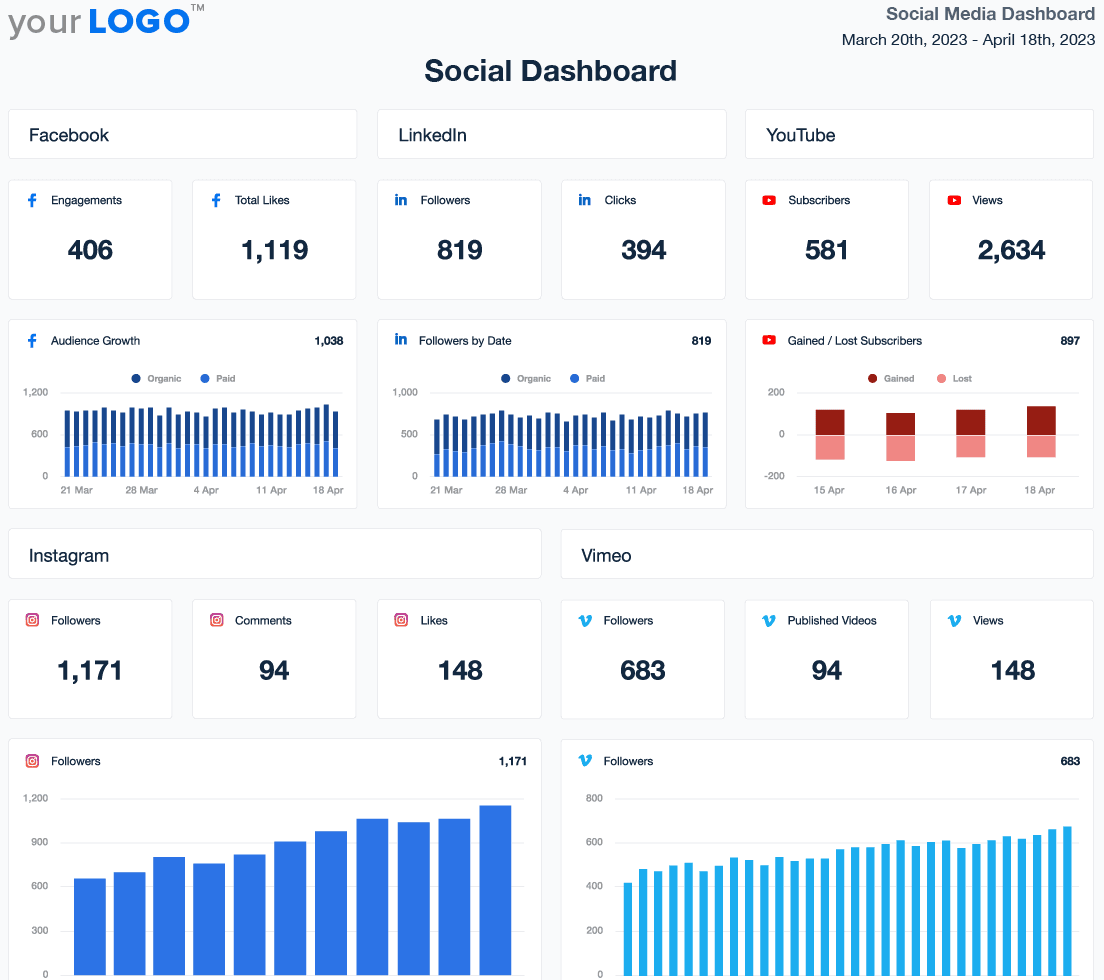
Social media moves fast, and clients expect clear answers about what’s working. This social media dashboard transforms data and key metrics from platforms like Facebook, Instagram, LinkedIn, and TikTok into one view.
Agencies track metrics like engagement rate, reach, follower growth, and conversion rates by channel and timeframe. With everything centralized, clients see trends across platforms without having to jump between logins or request extra context. It’s a clear, client-ready snapshot compiled into an executive dashboard to highlight social performance.
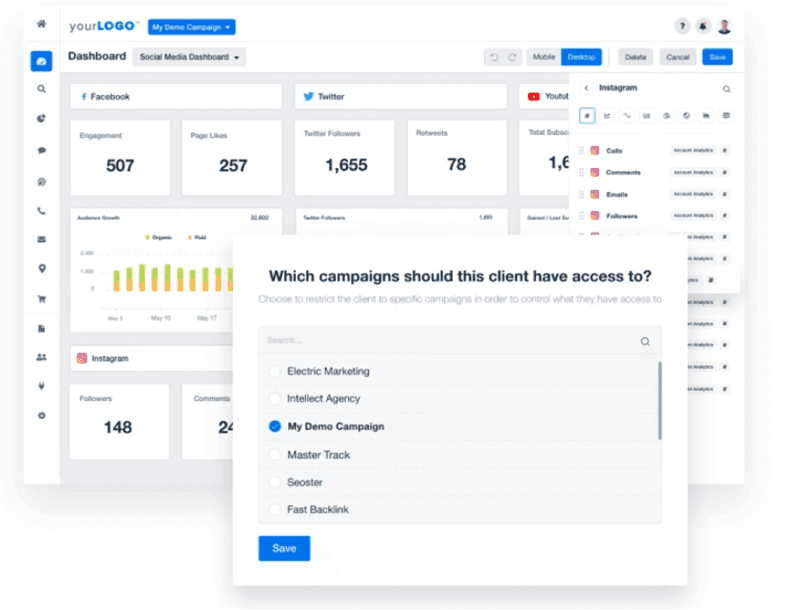
Give clients their own login to a live social media dashboard so they can check in anytime without asking for an update. Want to keep campaign work or internal notes private? You control exactly what they see. Start your free 14-day trial with AgencyAnalytics!
2. SEO Dashboard Example
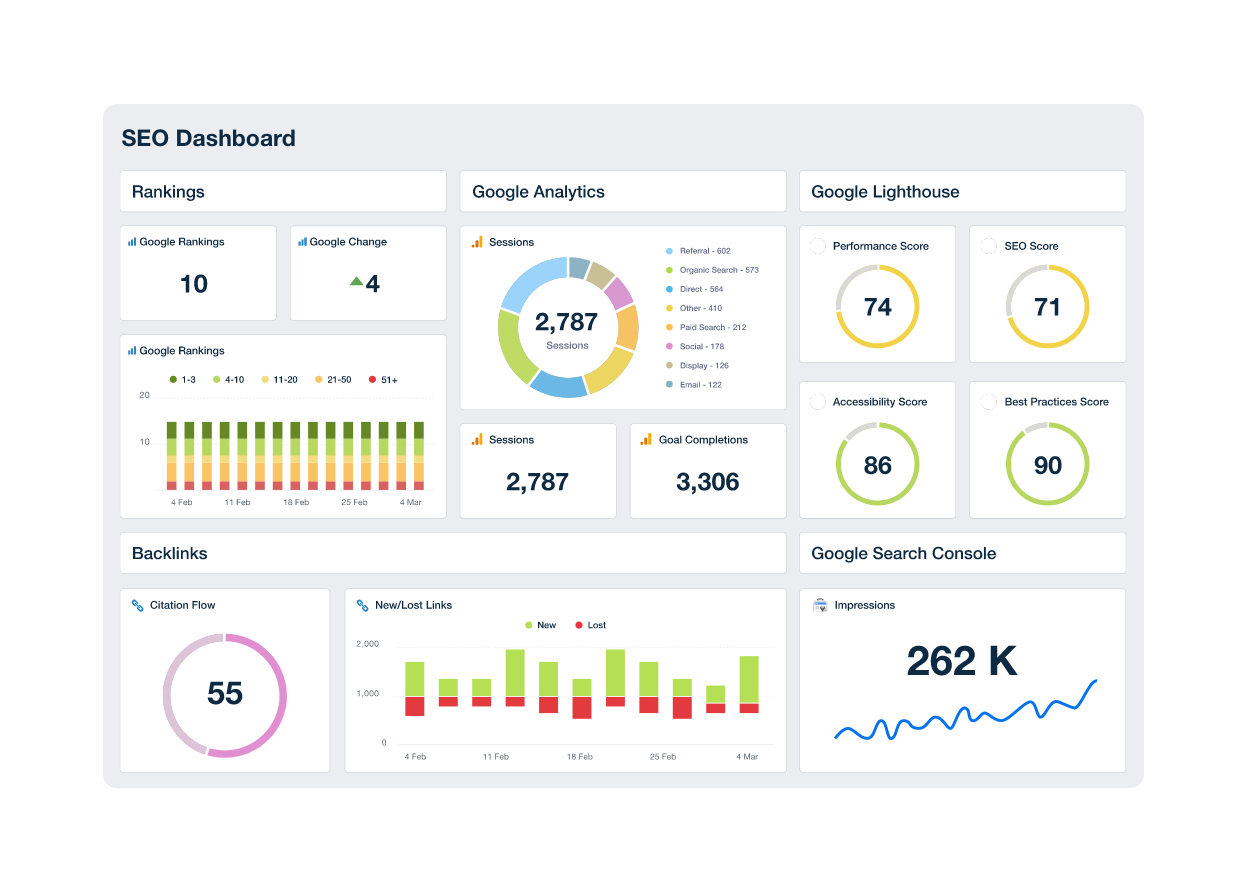
SEO reporting tends to get buried in spreadsheets and slide decks. This SEO dashboard makes it easier to track keyword rankings, organic traffic, backlinks, and site health in one view.
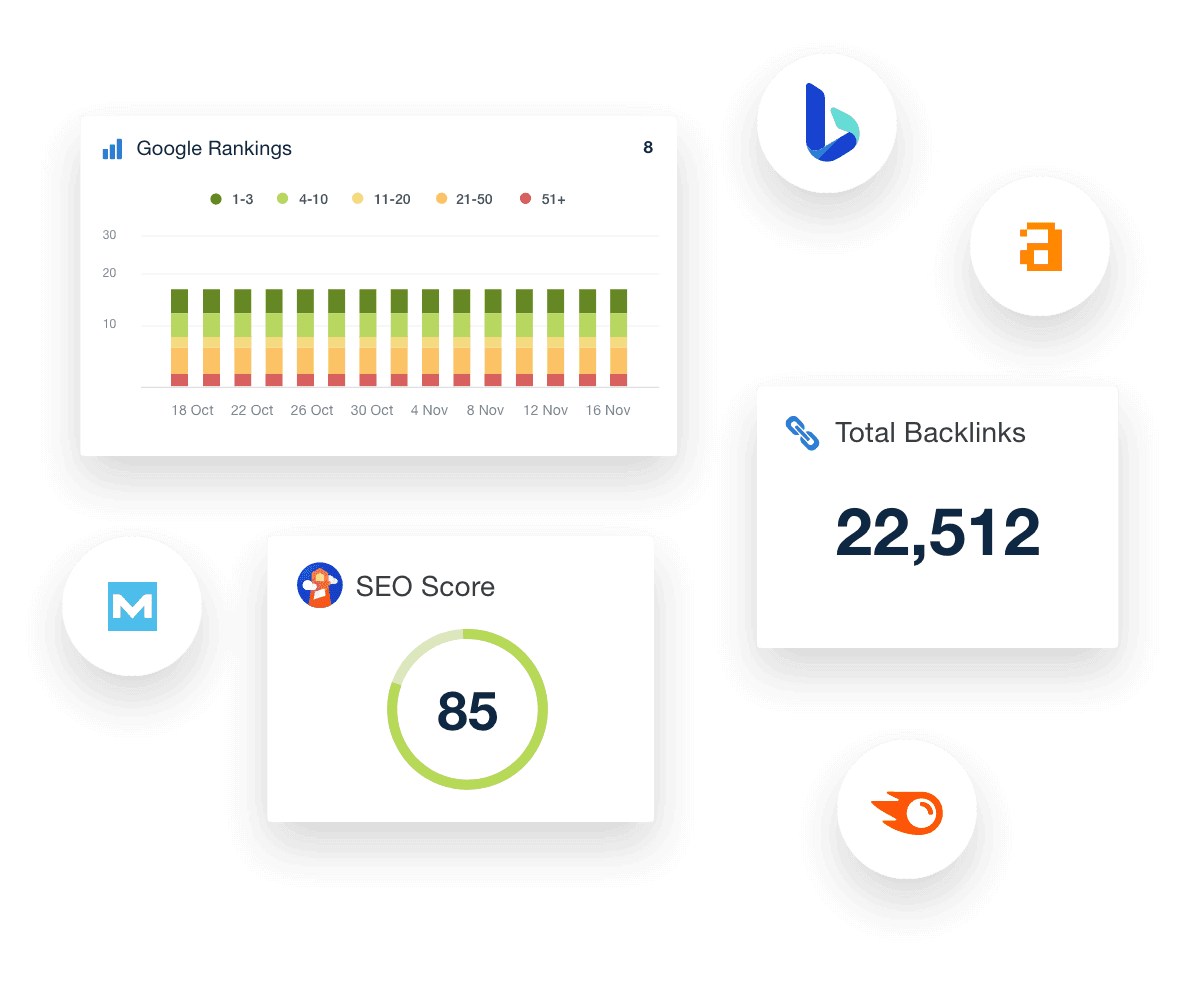
Agencies use it to show how rankings are shifting, which pages are driving the most traffic, and where a technical SEO site audit might be needed to improve performance. Marketers layer in Google Search Console and third-party tools like Semrush to give clients a full picture of SEO efforts.
With visuals that highlight changes over time, this dashboard helps agencies explain the long game of SEO in a way clients can understand and stick with.
Agency Tip: Need a local SEO dashboard template for one of your clients? Or maybe your team is presenting data in a dedicated link-building dashboard. We’ve got you covered for all of your SEO clients! Highlighting complex SEO metrics in a visual way doesn’t have to be confusing or take tons of time. Try both of these dashboard templates plus a variety of SEO tools free for 14 days!
3. Web Analytics Dashboard Example
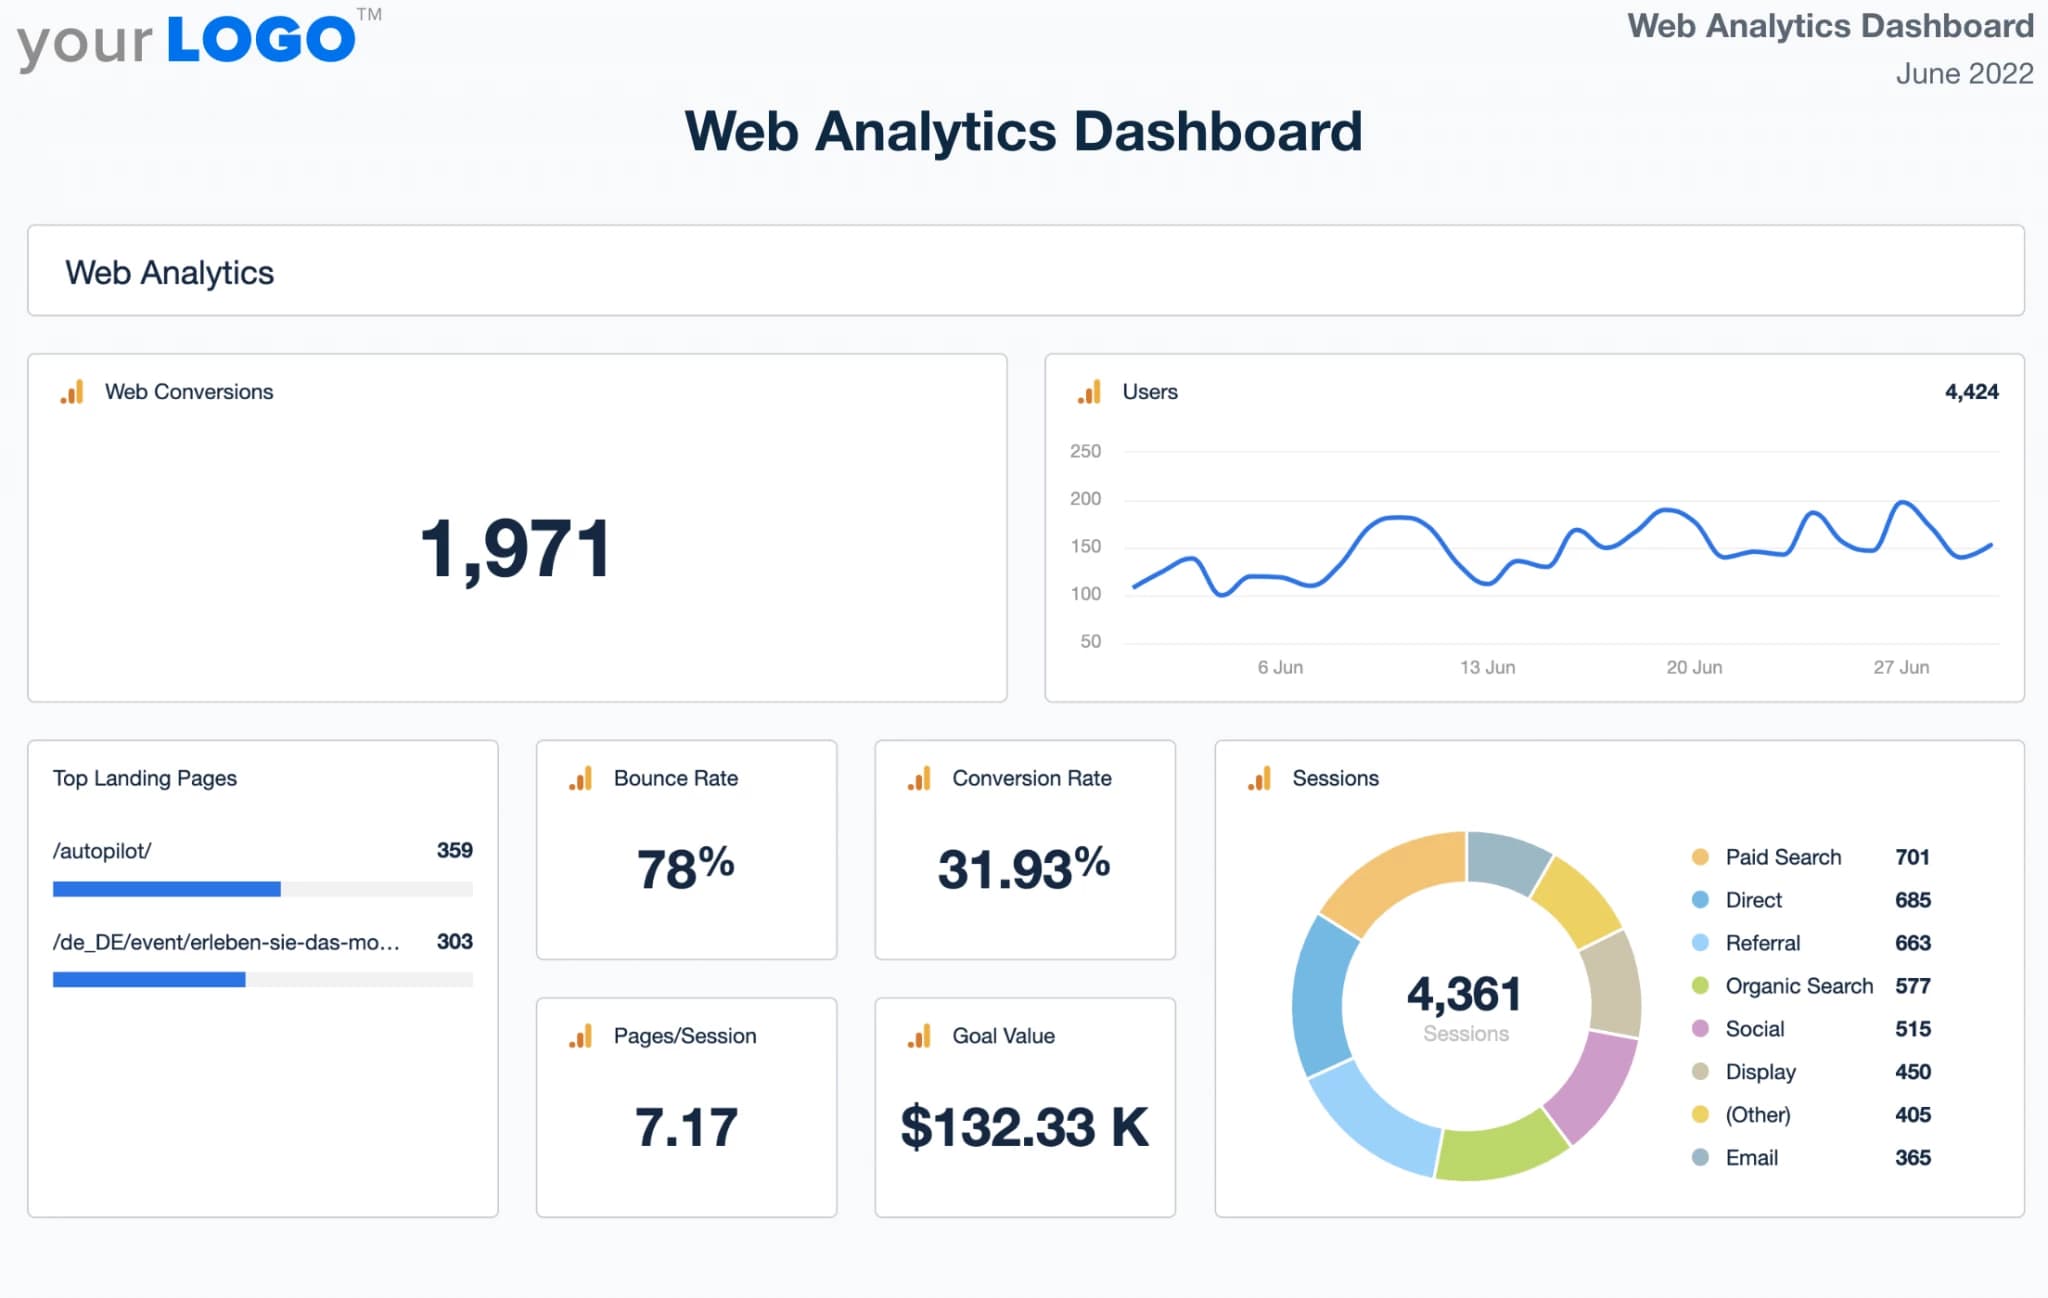
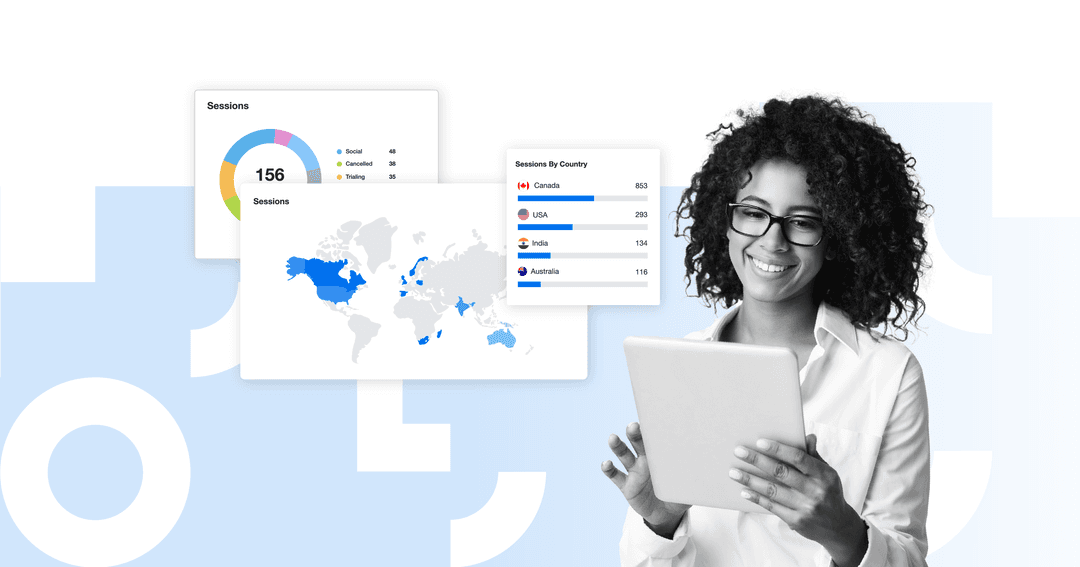
Clients want to know what visitors are doing on their site and, more importantly, what those actions mean. This web analytics dashboard pulls in data from Google Analytics to highlight sessions, bounce rates, average time on page, top-performing pages, and goal completions.
Agencies could also use a Google Analytics dashboard to show how users are navigating the client’s site, what content is keeping them engaged, and where drop-offs are happening.
Filtering by traffic source or device in a Google Analytics dashboard helps identify opportunities to improve UX or double down on what’s already working.
It turns abstract web traffic into a clear, data-backed story about user behavior and website performance that is easy to explain.
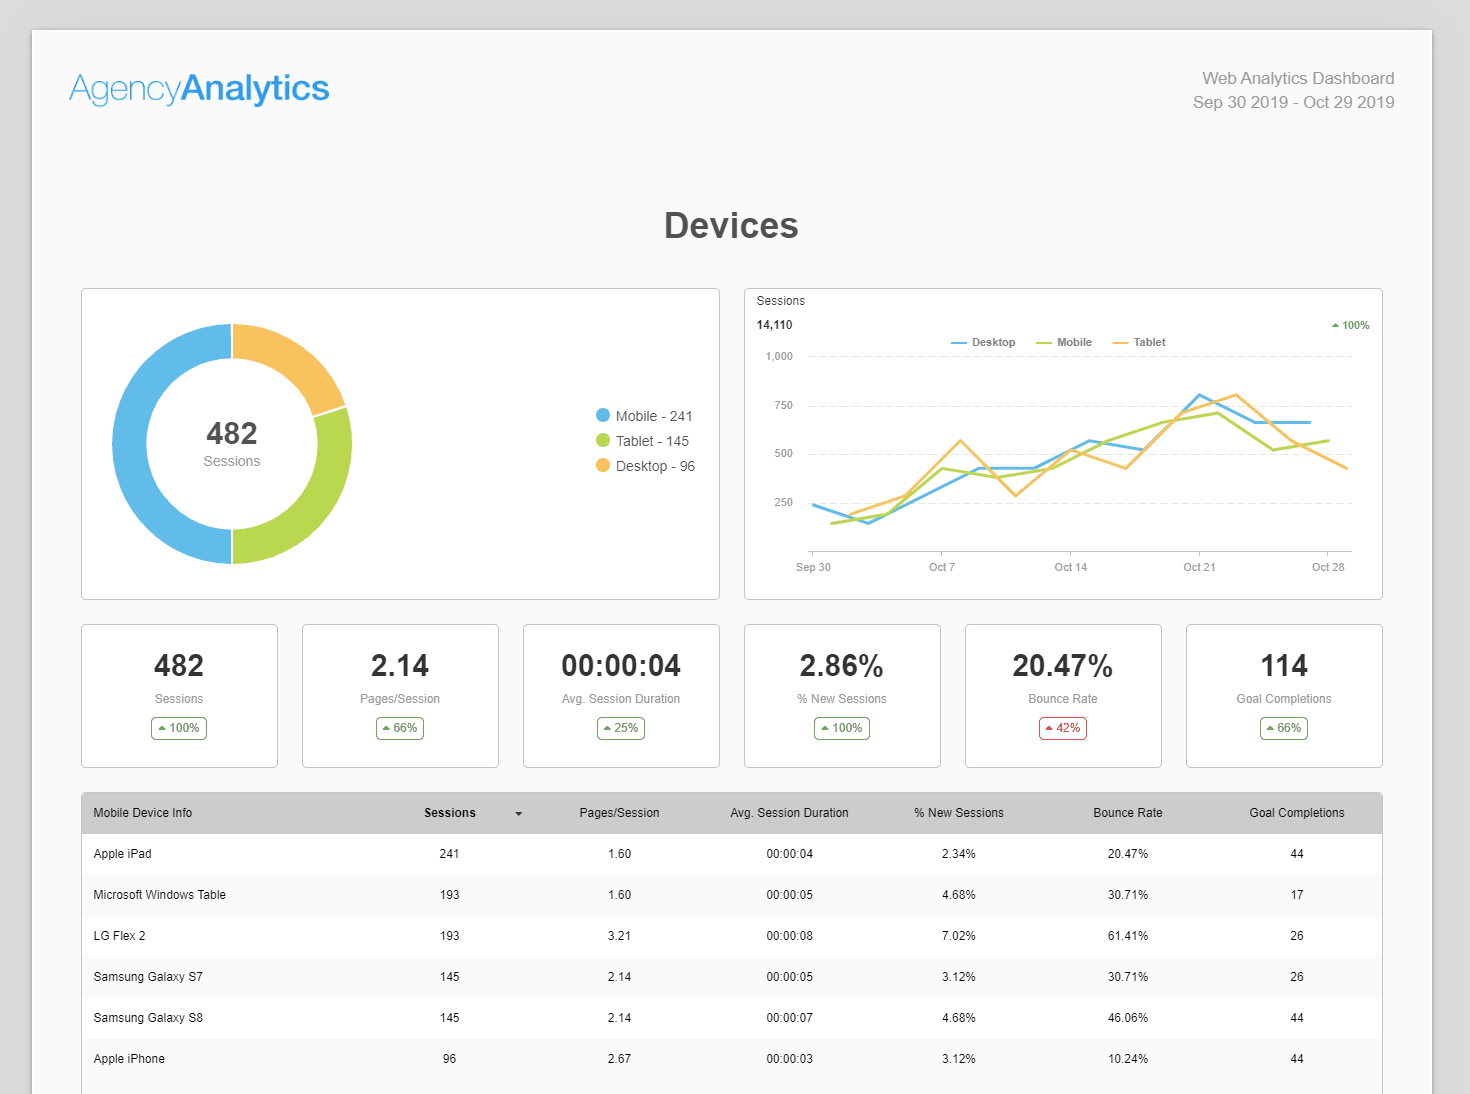
Show your clients exactly where their audience is engaged. AgencyAnalytics makes it easy to filter by device or traffic source with the click of a button to uncover new ways to optimize a client’s site. Get started with your 14-day free trial today!
4. Digital Marketing Dashboard Example
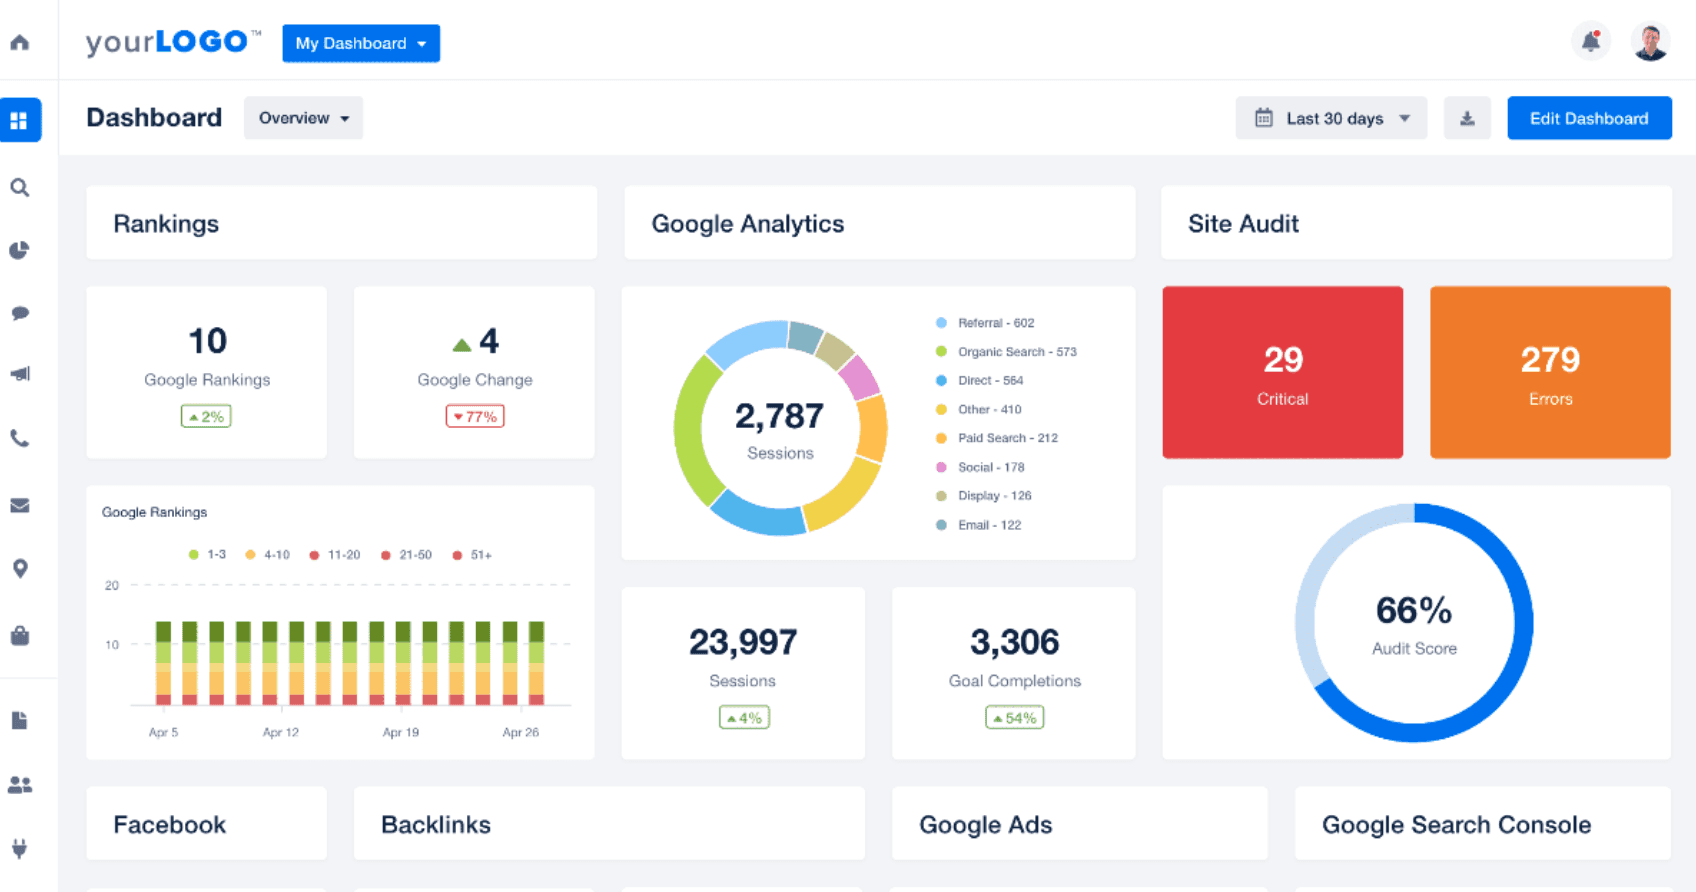
When clients run campaigns across multiple channels, performance gets messy fast. This digital marketing dashboard brings SEO, PPC, social, email, and web analytics into one unified marketing analytics view.
It makes it way easier for agencies to monitor key business performance indicators like cost per acquisition, ROI by channel, and traffic trends across platforms. Drill down into campaign performance or zoom out to get a high-level summary of overall marketing effectiveness.
Instead of juggling separate reports, clients see how each channel contributes to broader goals. It’s a go-to view for monthly check-ins and performance reviews that drive strategy forward.
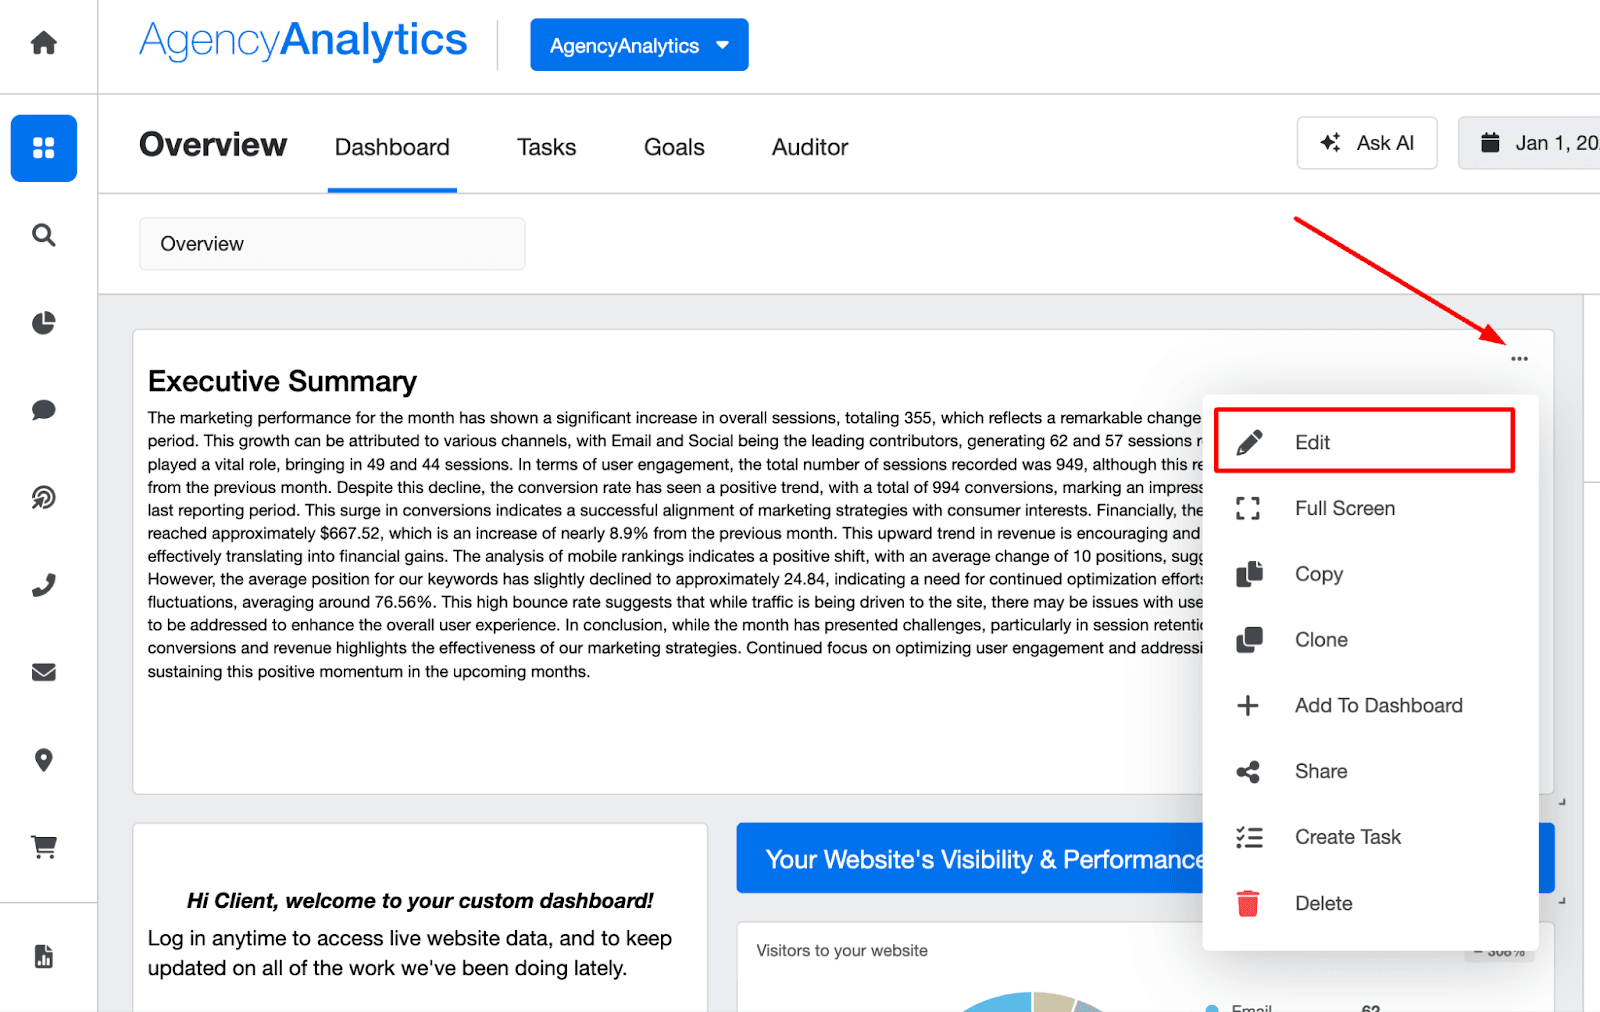
Sending regular client reports? Use the AI summary feature in AgencyAnalytics to transform raw data into clear, client-friendly insights in minutes. No more overthinking the narrative or rewriting the same update twice. Start your free 14-day trial today!
5. PPC Dashboard Example
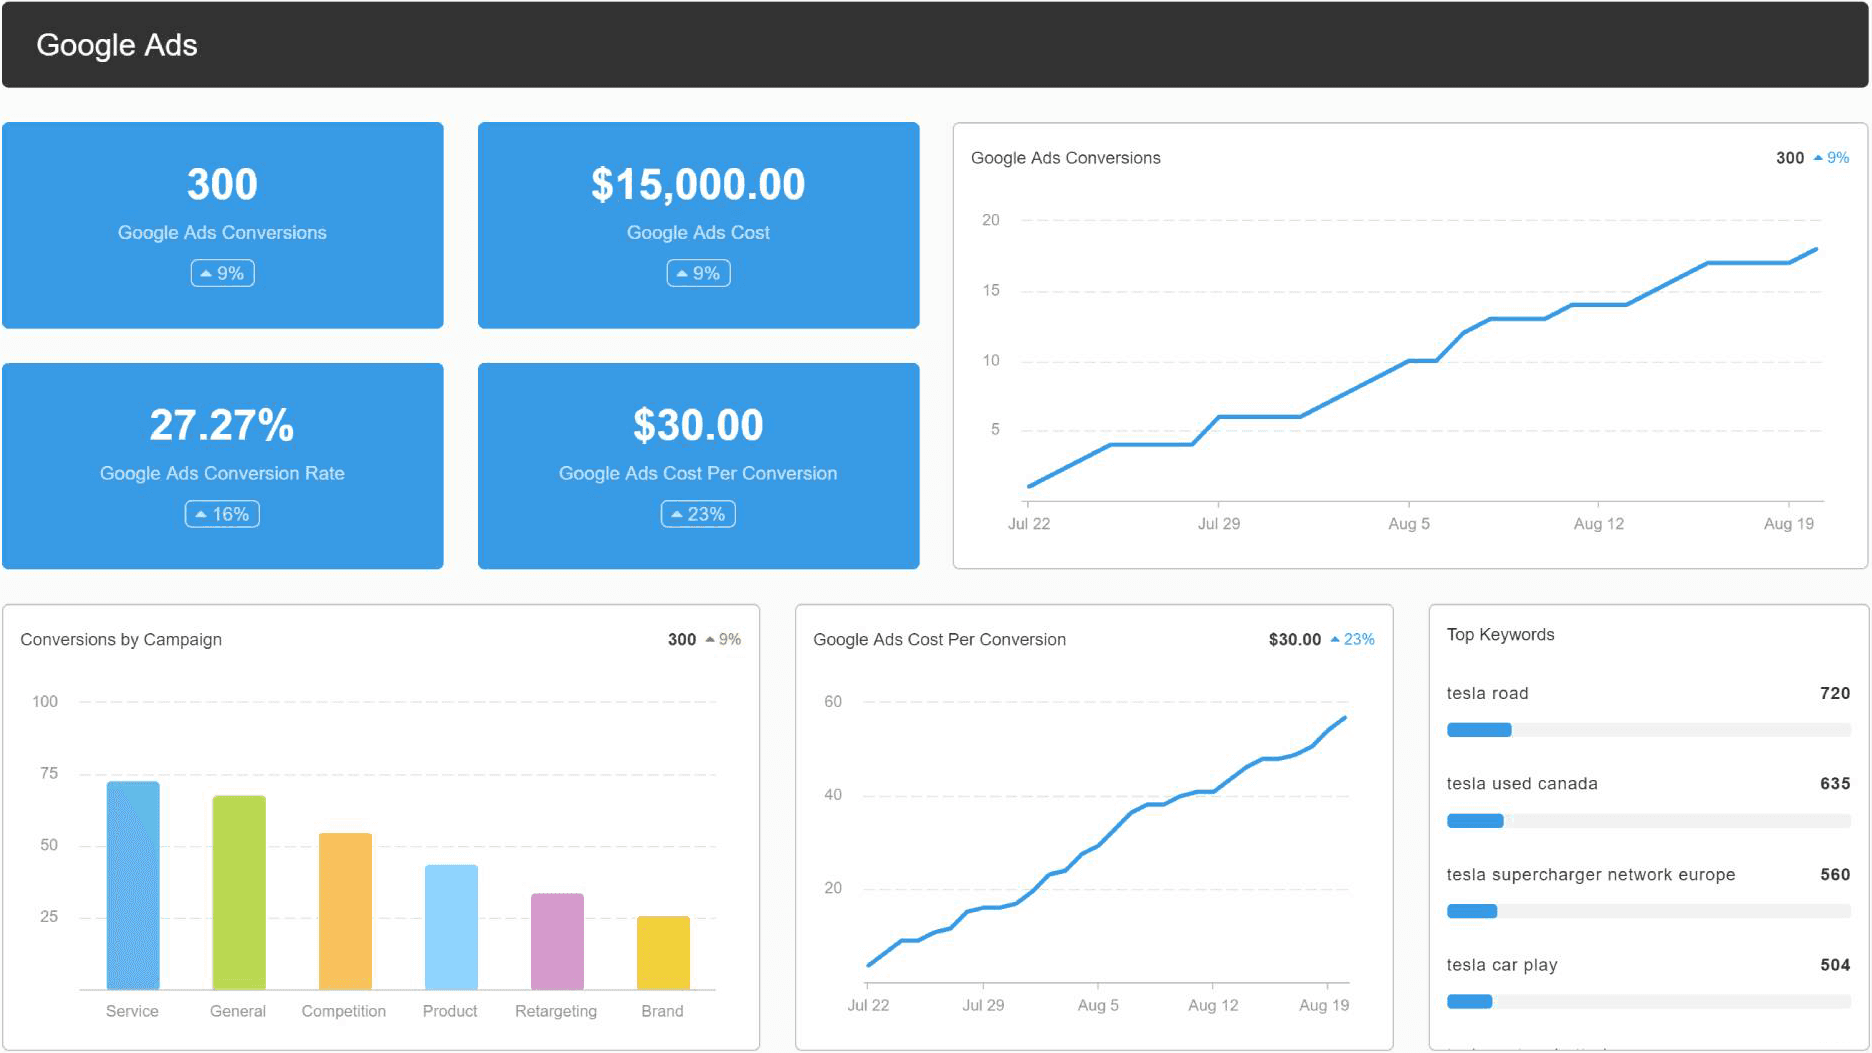
Paid campaigns live or die by the numbers. This PPC dashboard tracks key metrics like impressions, clicks, conversions, cost per click (CPC), and return on ad spend (ROAS) across platforms like Google Ads and Microsoft Ads.
Agencies use it to highlight which campaigns are performing, where ad spend is going, and what’s delivering the best ROI. With filters by campaign, ad group, or time range, it’s easy to isolate performance issues or scale what’s working.
For client calls, this dashboard becomes a visual proof point showing exactly how their budget is being used and the results it’s driving.
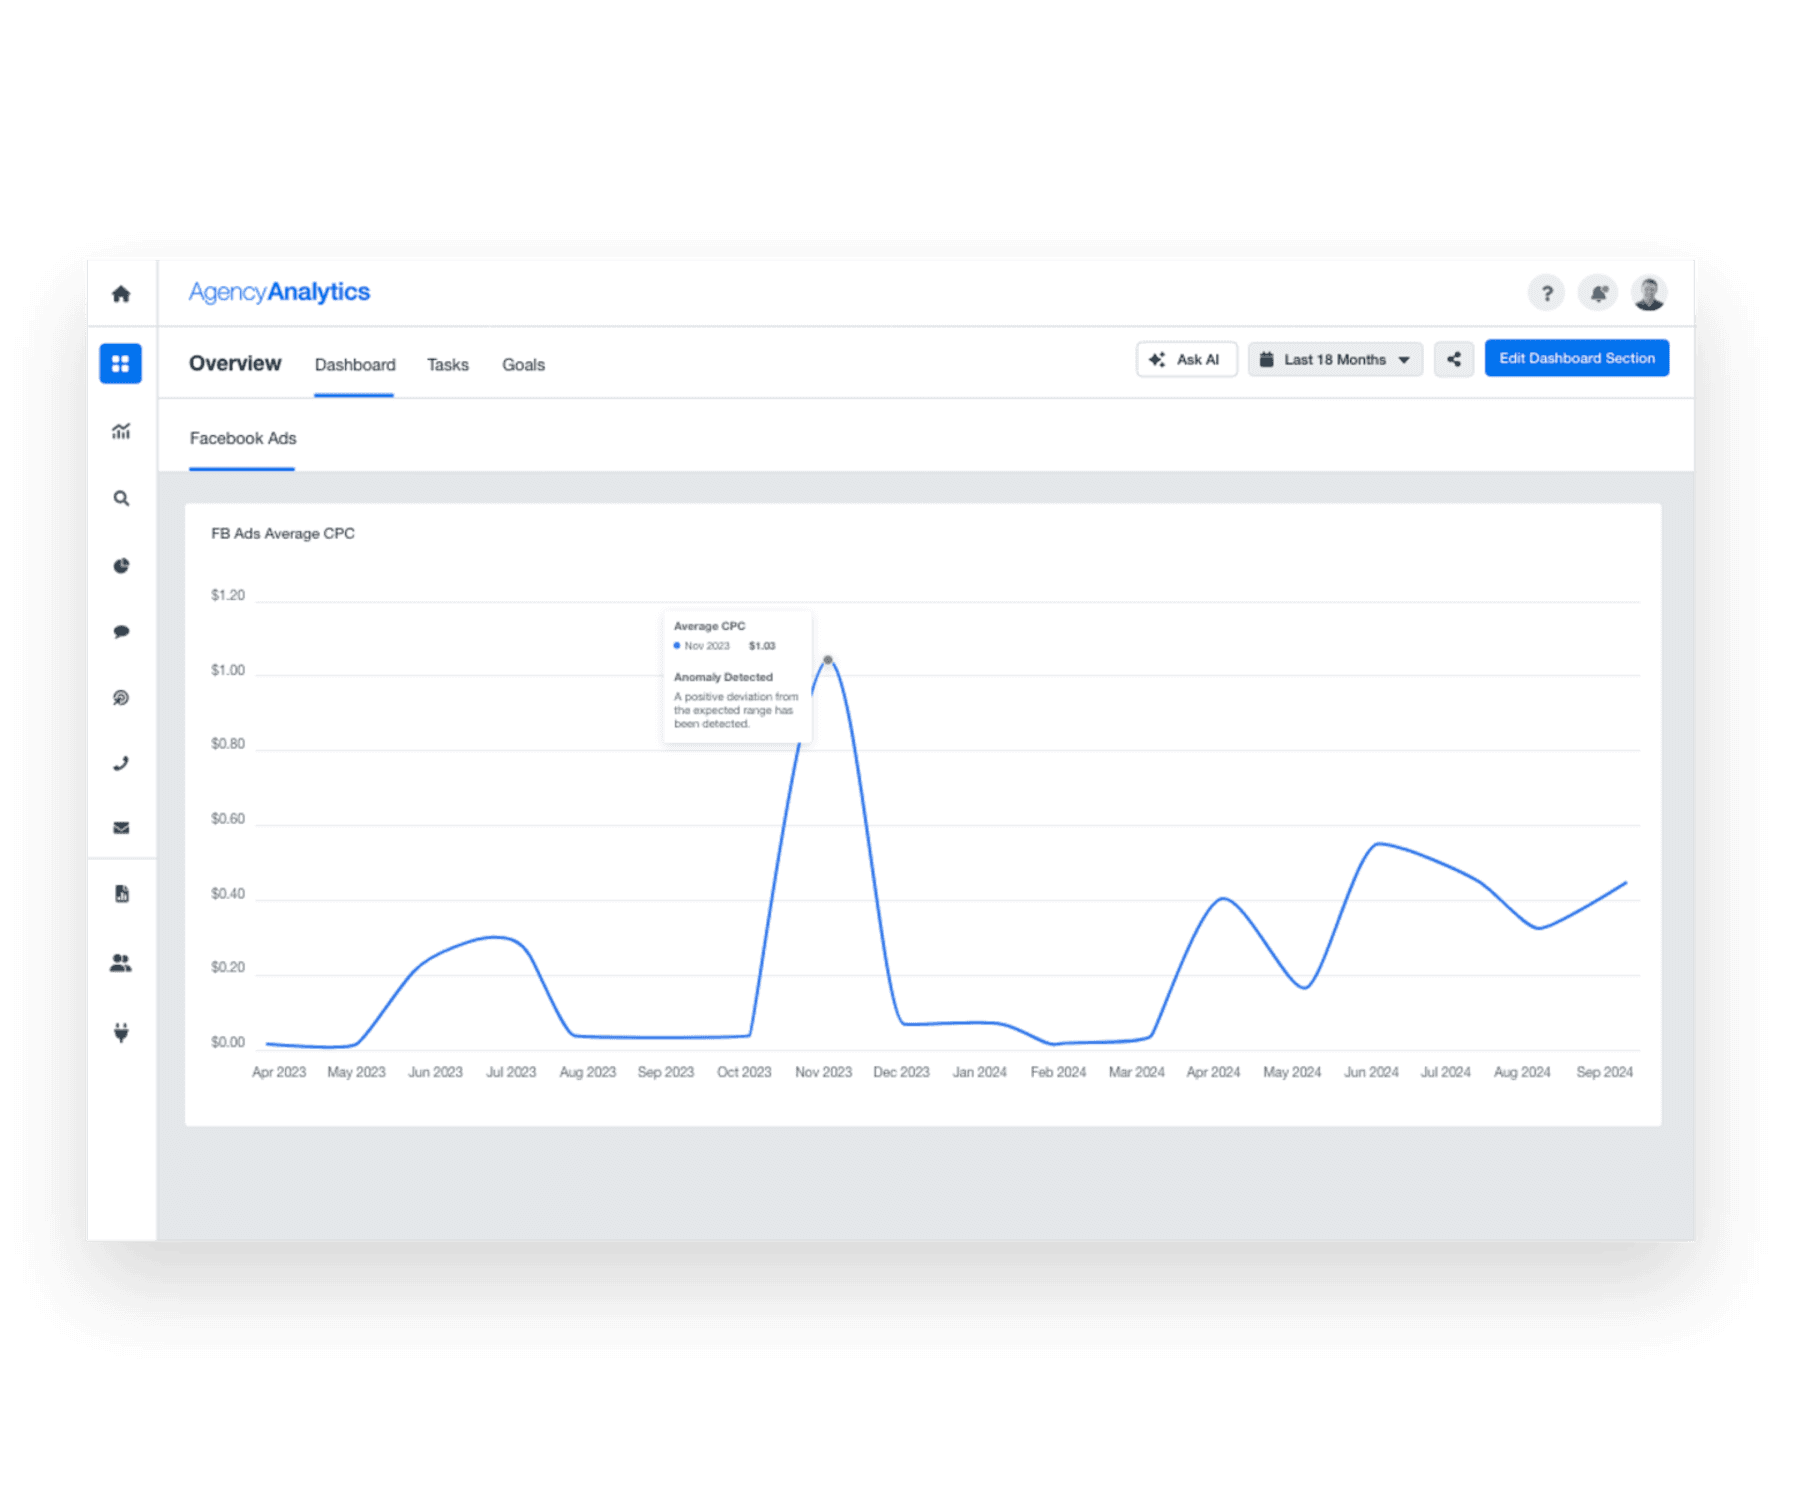
With features like anomaly detection, trend forecasting, and benchmark Insights, AgencyAnalytics makes it easy to prove a client’s PPC ROI. Get access to these features and more with your 14-day free trial!
6. Ecommerce Dashboard Example
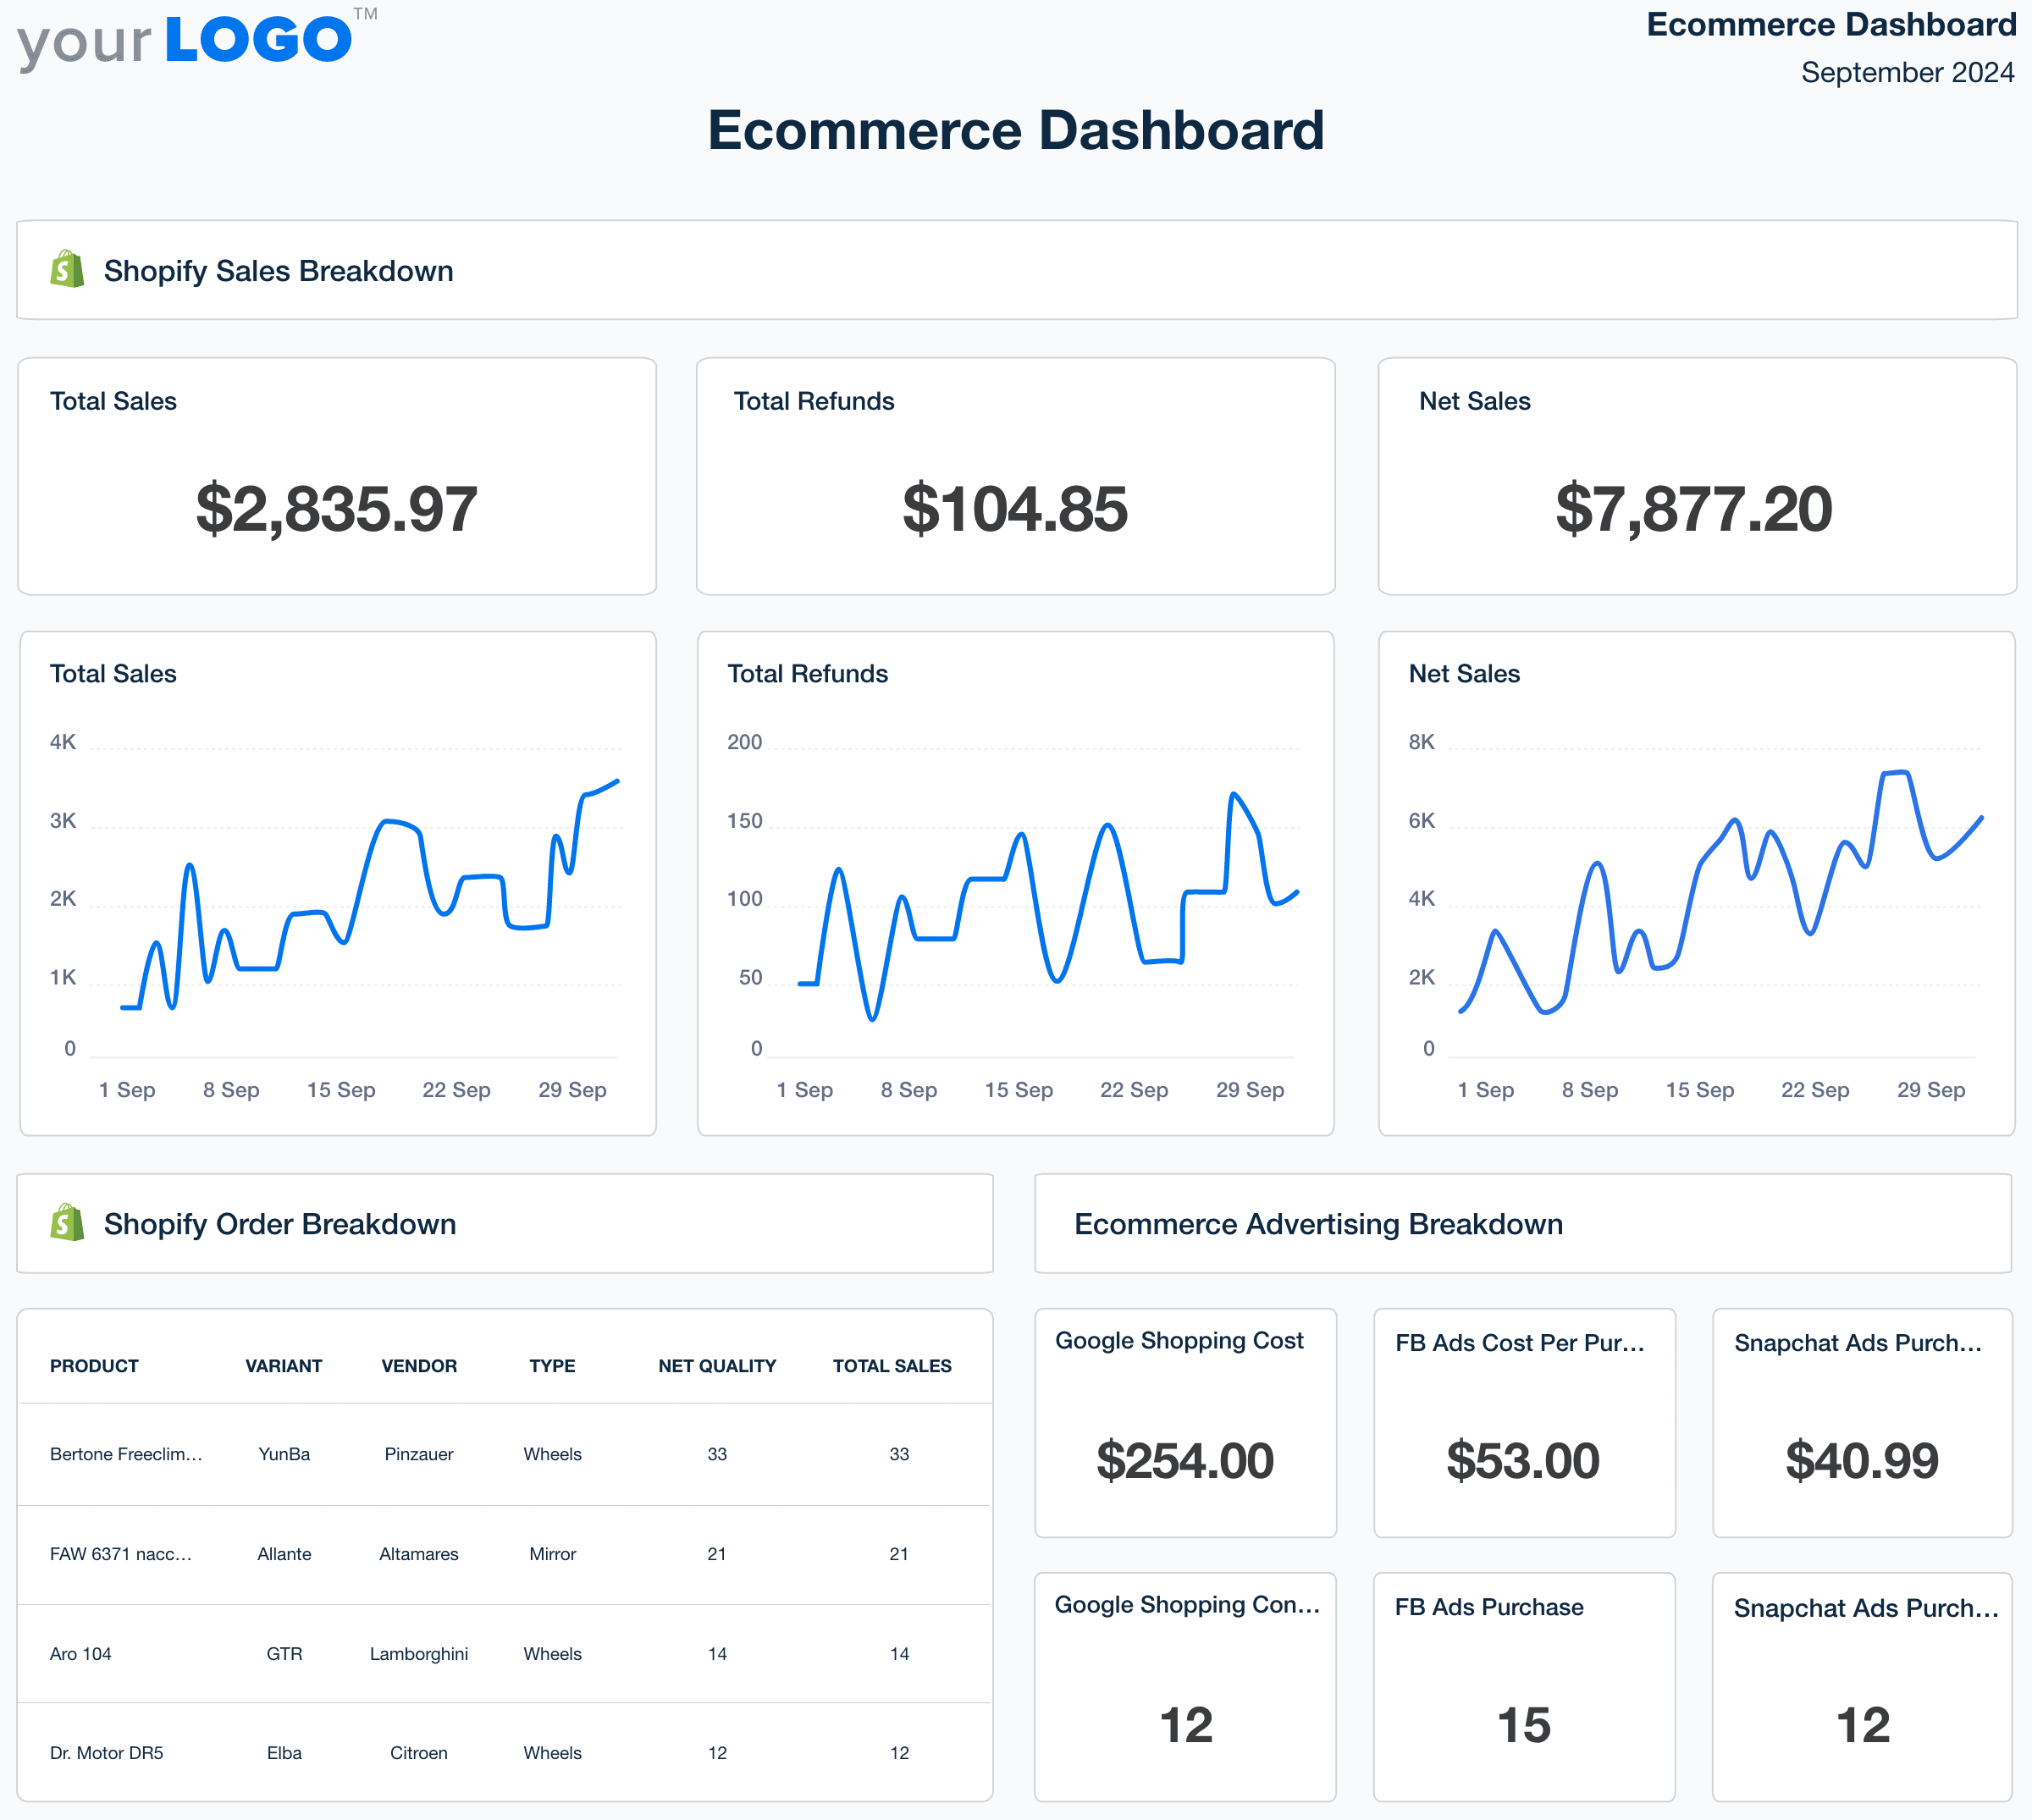
Online stores generate a ton of data like orders, revenue, average order value, conversion rates, and cart abandonment rates. An ecommerce dashboard pulls those metrics into one real-time view, syncing directly with platforms like Shopify and WooCommerce.
Instead of jumping between ecommerce and analytics tools, agencies get a clear link between marketing activity and sales performance from AgencyAnalytics. Want to show how a recent email campaign or ad push led to a spike in revenue? It’s all connected and easy to show.
This dashboard gives clients something they rarely get: context. They see not just what sold, but why it sold and what levers to pull next.
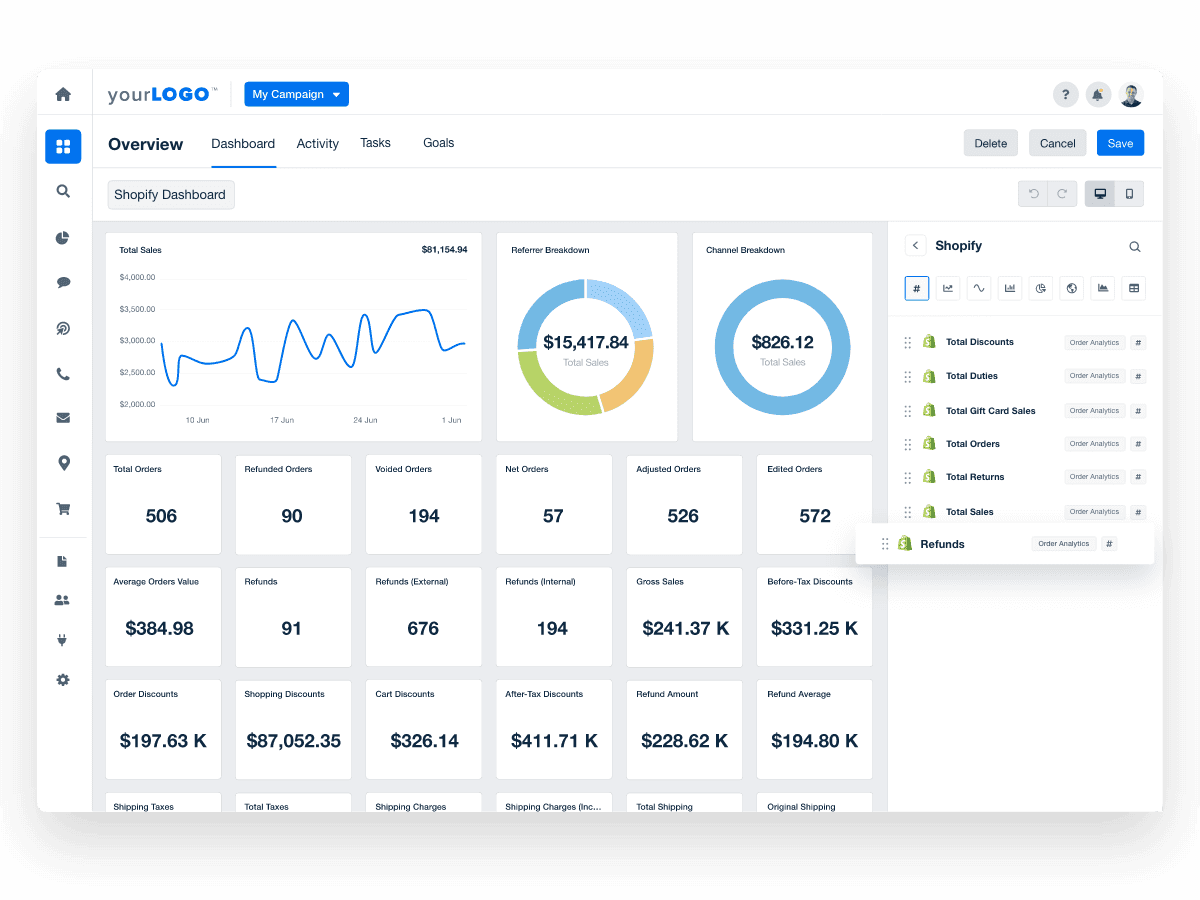
Show clients exactly which marketing efforts are driving their revenue. Try the ecommerce dashboard in AgencyAnalytics free for 14 days.
7. Email Marketing Dashboard Example
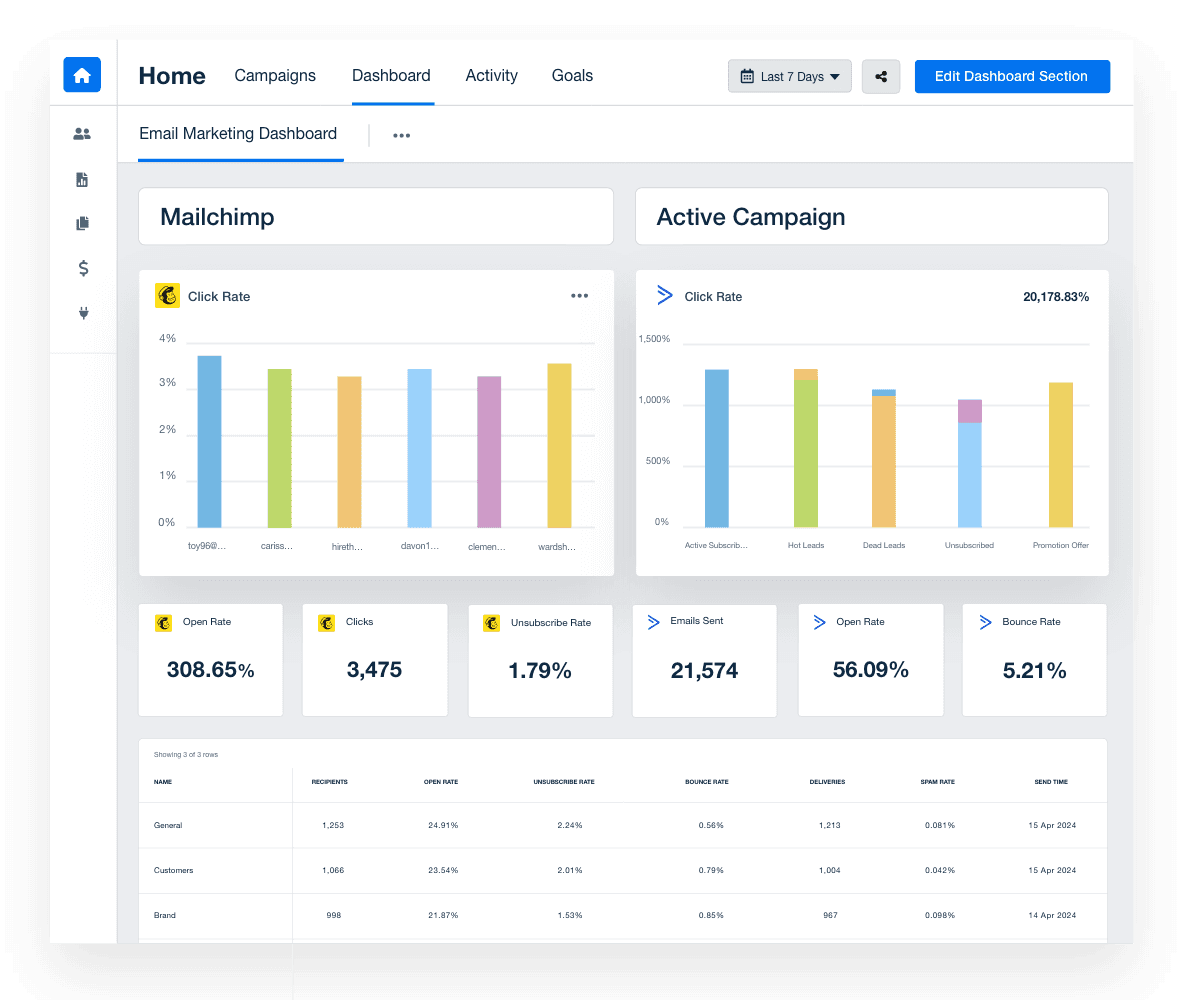
Email campaigns entail reporting on important email marketing metrics such as open rates, click-through rates, conversions, and unsubscribe rate trends. This dashboard connects directly to tools like Mailchimp, ActiveCampaign, or HubSpot to bring those metrics front and center.
Agencies use an email marketing dashboard to track the success of individual campaigns, A/B test, and automate their workflows. By breaking down performance by list segment or email type, it’s easier to fine-tune messaging and improve engagement over time.
Instead of forwarding screenshots or digging through platform exports, this dashboard gives clients a clear view of what’s working and where there’s room to tweak and improve.
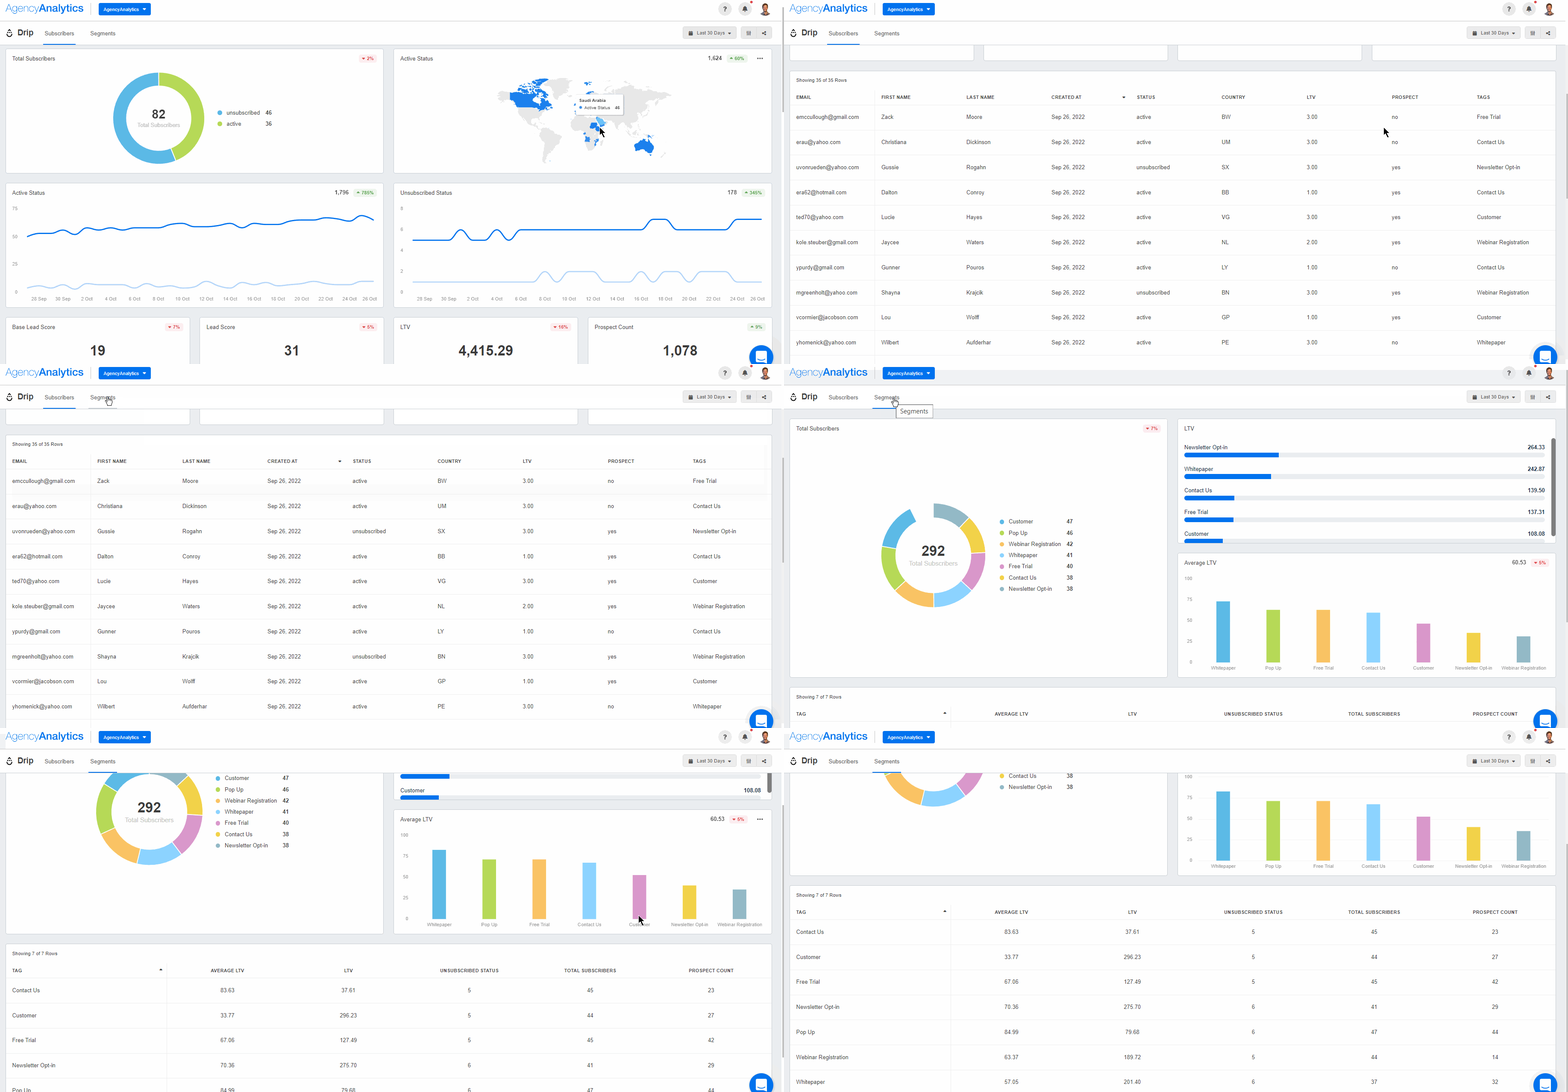
Segment audiences, track campaign results, and get all your client’s email data in one place. The AgencyAnalytics email dashboard makes it easy to turn engagement into strategy. Start your free 14-day trial.
4 Platform-Specific Dashboard Examples
Sometimes clients want to zoom in on performance from a single platform. Whether it's to track ad spend, video views, or post engagement, a focused dashboard helps zero in on the metrics that matter most for that channel. These four examples show how agencies use platform-specific dashboards to deliver more targeted insights.
1. Facebook Dashboard Example
Facebook analytics dashboard example
Facebook campaigns get complicated fast, especially with multiple audiences, objectives, and ad sets in play. A Facebook dashboard pulls together reach, impressions, engagement, conversions, and ad spend into a clear summary view.
Agencies use it to quickly identify top-performing creatives, monitor cost trends, and back up recommendations with real data. It’s especially useful during A/B testing or when running both organic and paid content side by side.
With one login, clients can see everything they need without having to go between Ads Manager and Business Suite.
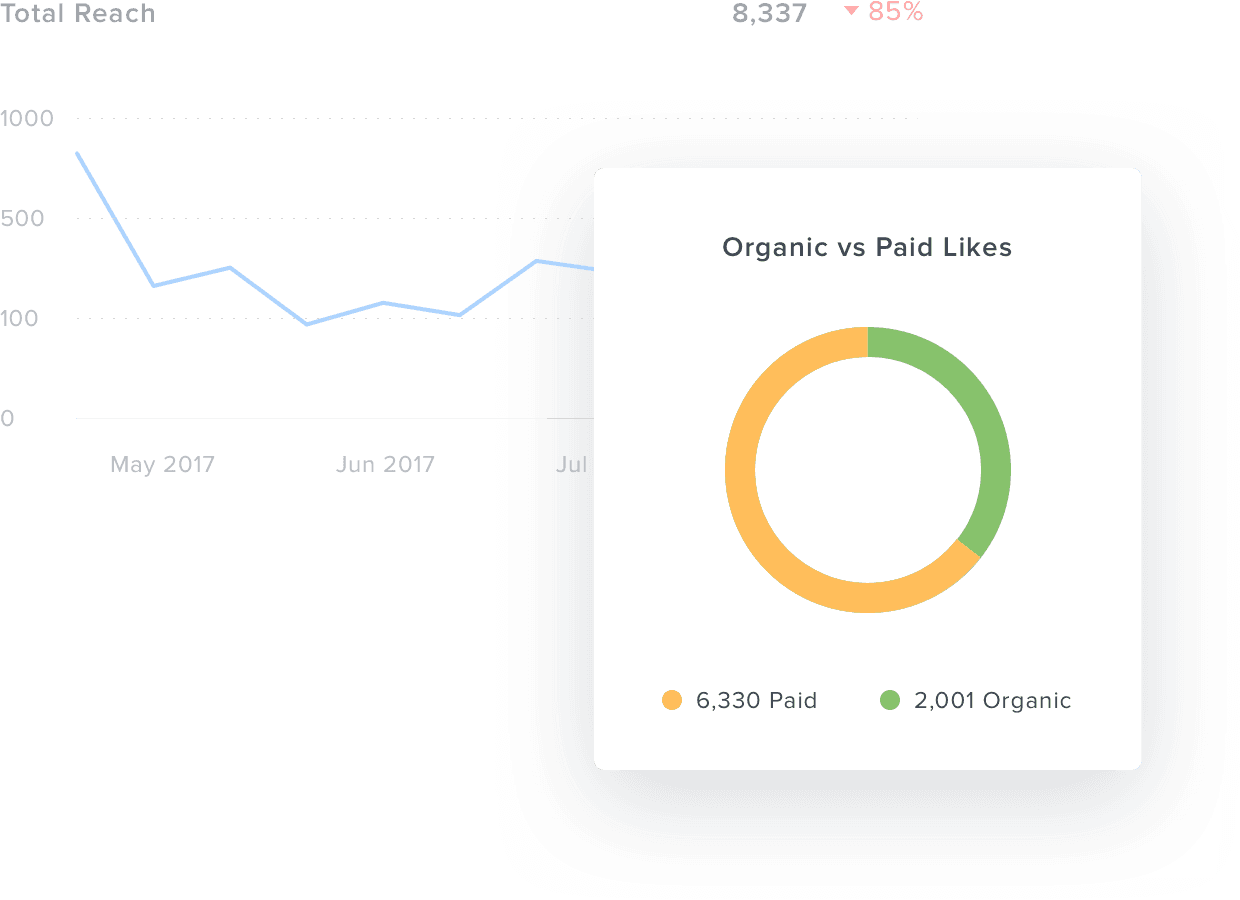
Want to compare your clients’ paid and organic Facebook campaigns with less effort? Try AgencyAnalytics free for 14 days to speed up your reporting time.
2. Google Ads Dashboard Example
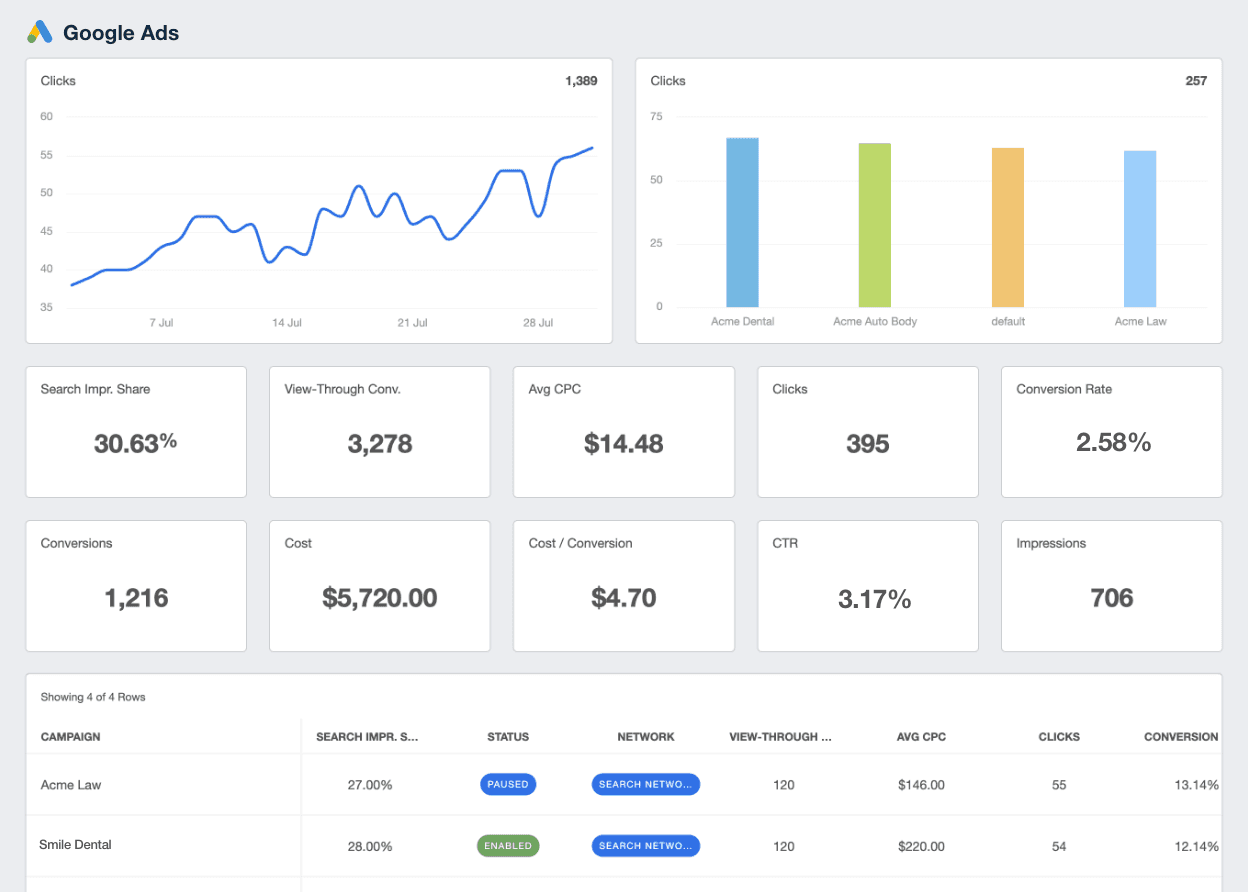
If you’ve ever used Google Ads before, you know the platform offers no shortage of data. But that can become a problem in itself. Between Search, Display, and YouTube campaigns, it’s easy for clients to feel buried in metrics and miss the big picture.
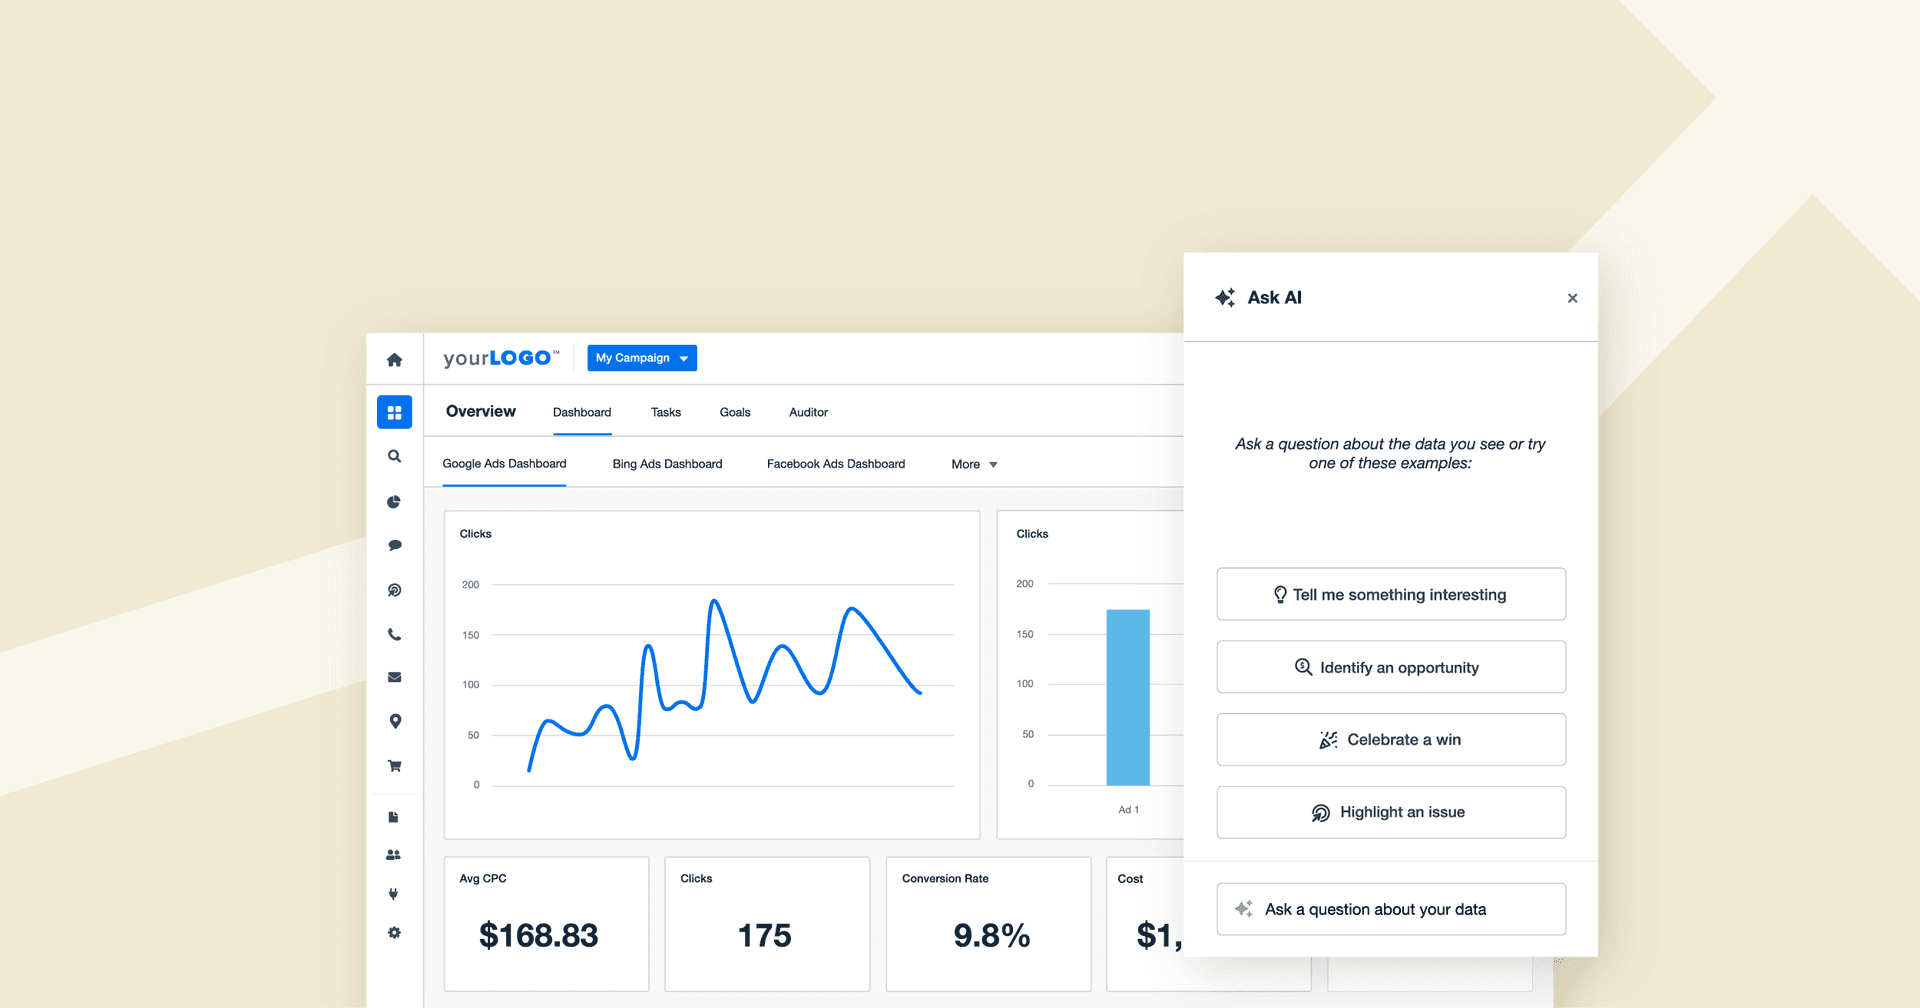
A dedicated Google Ads dashboard organizes the chaos. It surfaces the KPIs that matter most, like impressions, clicks, conversions, cost per conversion, and ROAS, freeing up an agency’s time to quickly evaluate performance and make informed decisions.
Instead of toggling between views in Google Ads, agencies get one streamlined layout that’s client-ready. It helps frame strategic conversations around what’s working, what needs to shift, and how to maximize ad spend with less guesswork.
3. Instagram Dashboard Example
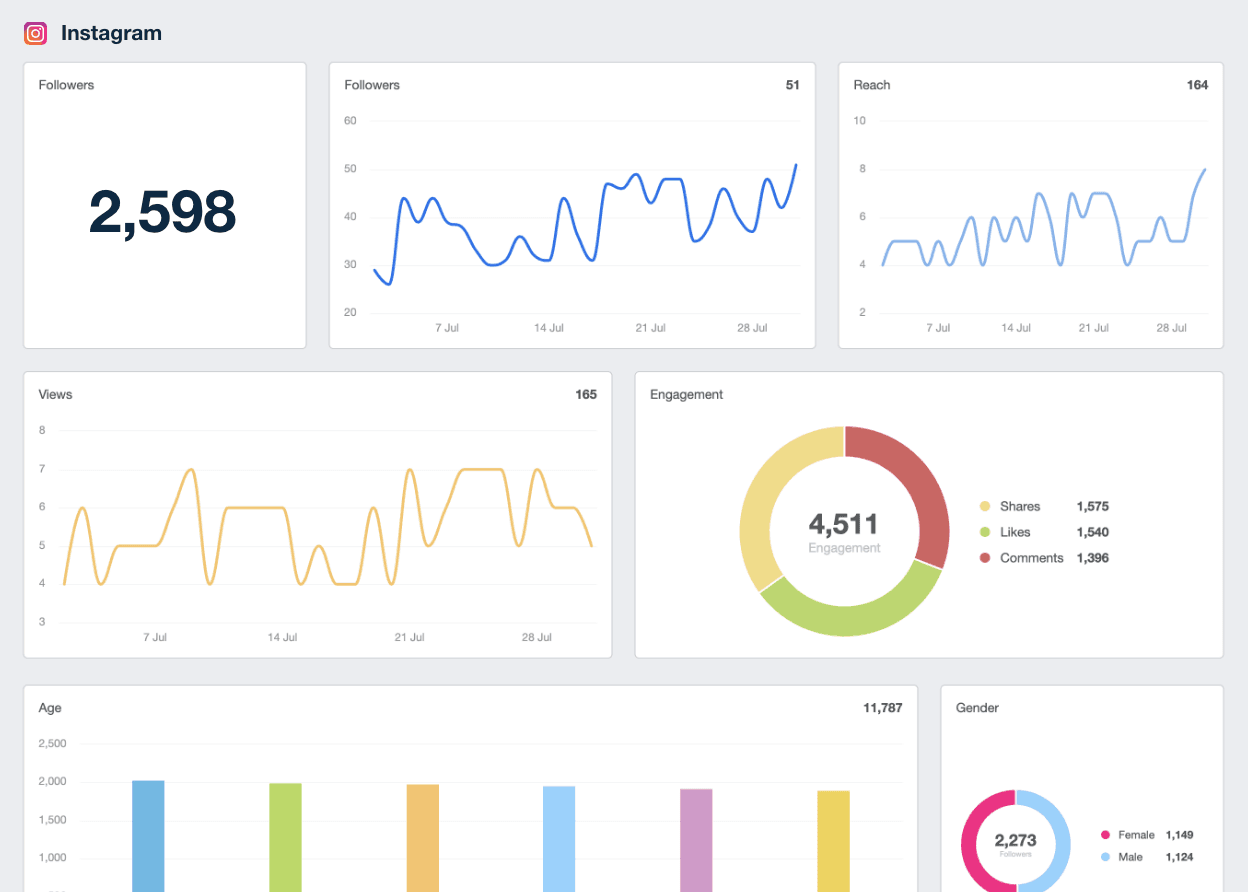
Clients can see their Instagram likes themselves in-platform. It’s up to your team to use an Instagram dashboard to surface key metrics like follower growth, reach, engagement rate, story views, and post performance—all pulled directly from Instagram’s API.
It’s especially useful for content-heavy clients who want to know what’s resonating with their audience and when to post. With visual comparisons across posts, reels, and stories, the dashboard helps agencies identify digital marketing trends and plan future content more strategically.
Clients get a clean, visual breakdown of what’s working on Instagram, without the noise of less relevant content marketing metrics.
4. YouTube Dashboard Example
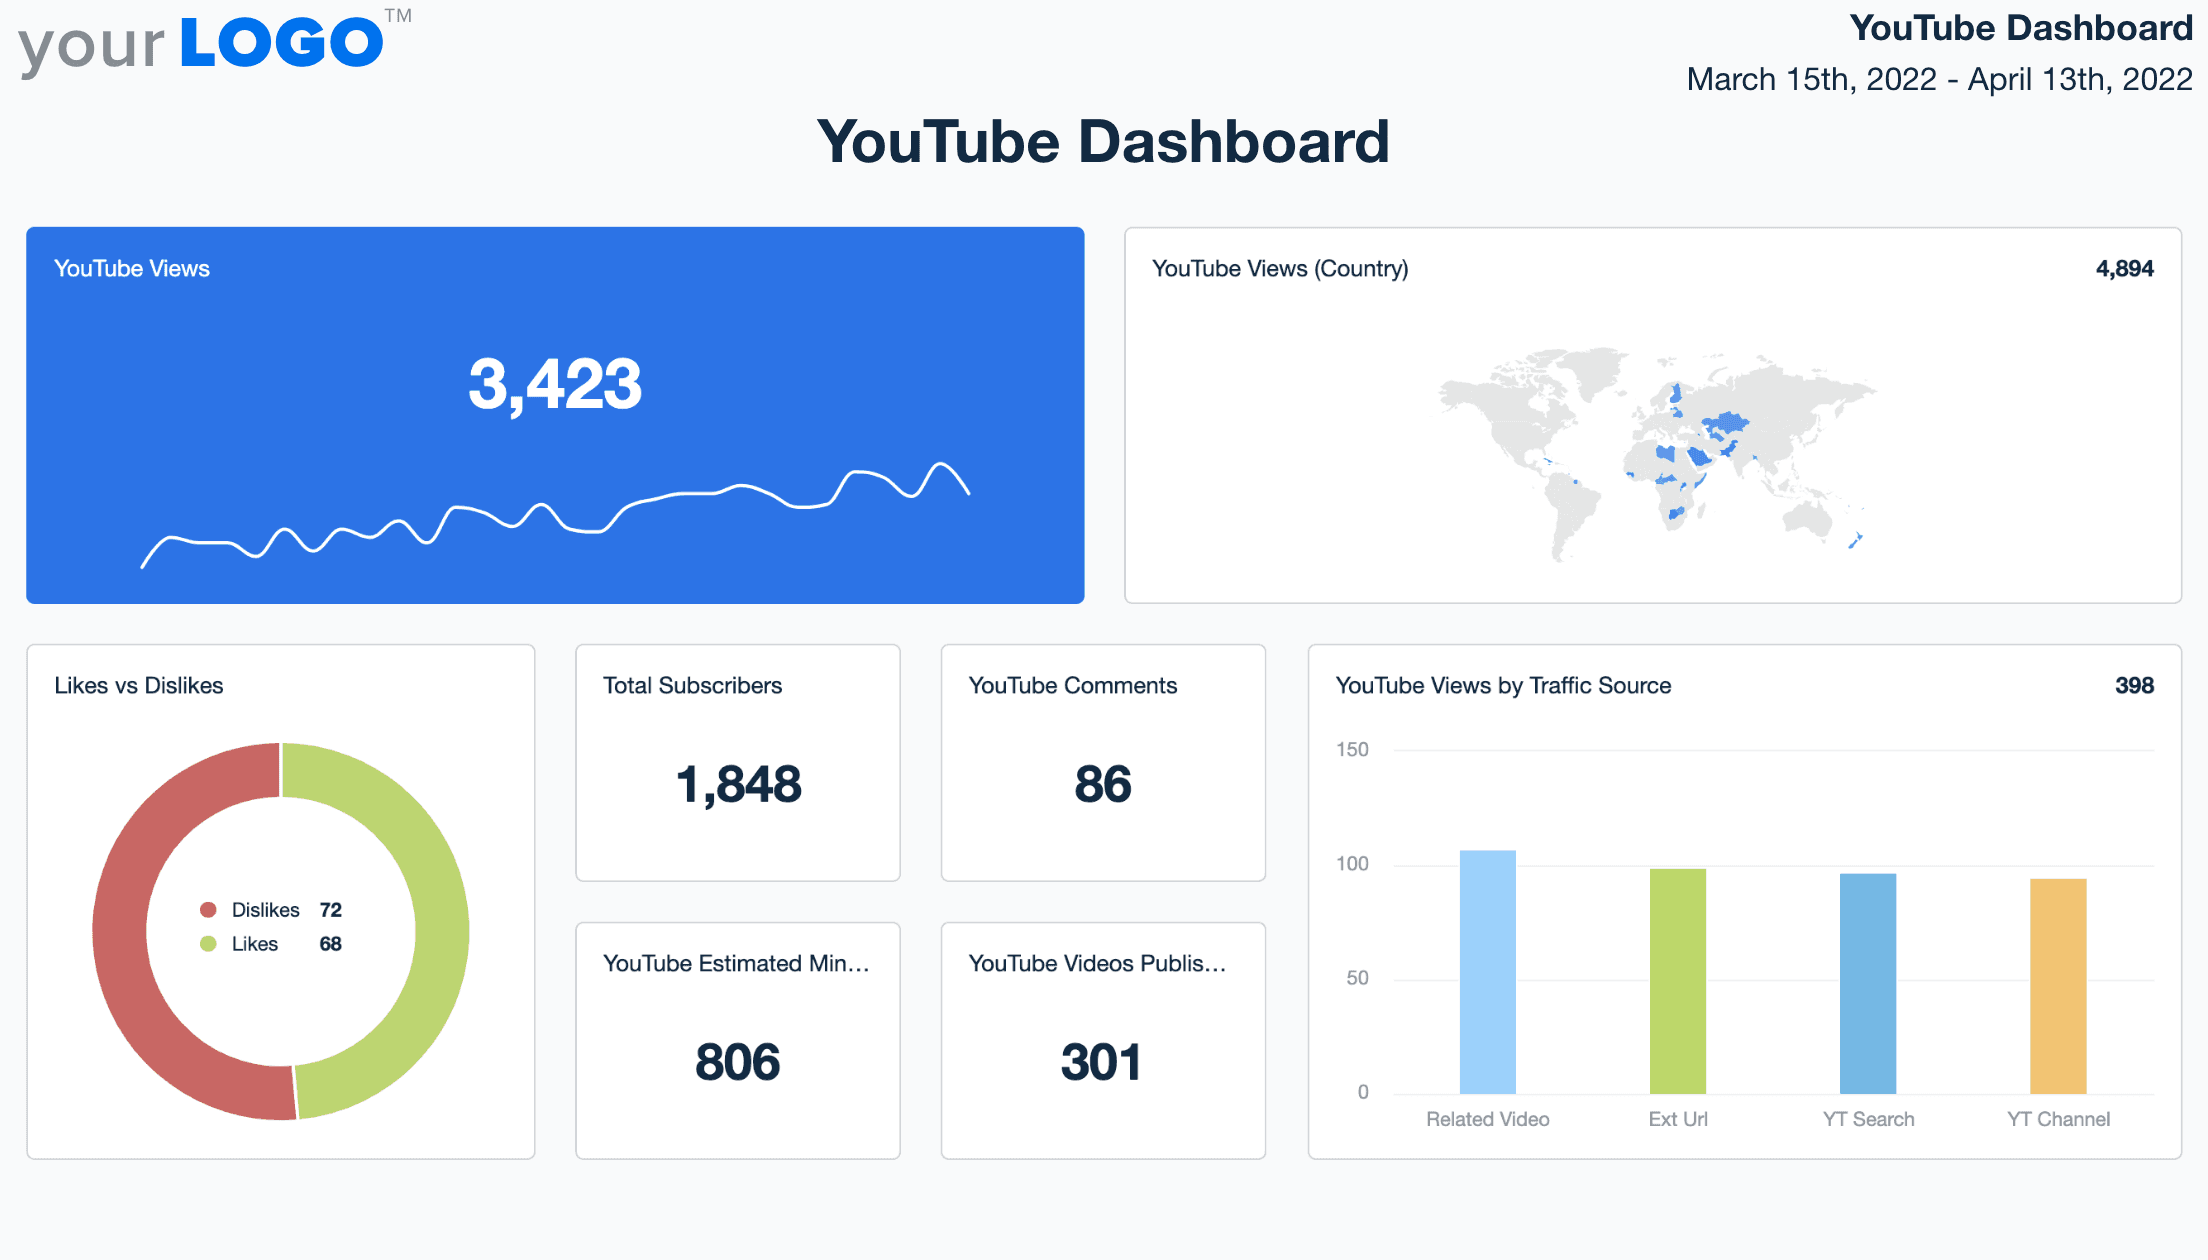
Video marketing analytics are easy to miss when they’re completely buried in YouTube Studio. This makes it tough for your team to track a client’s growth or tie performance back to the strategy you’ve worked hard on. This YouTube dashboard surfaces key data points like video views, watch time, average view duration, subscribers gained, and top-performing videos.
Agencies use it to analyze content trends, understand audience retention, and identify which topics or formats are driving the most engagement. For brands investing heavily in video, this dashboard turns raw YouTube stats into insights that guide their next upload.
Everything’s in one place, so clients can see how their channel is growing, without needing to learn the backend of YouTube. It builds confidence in your work and strengthens long-term trust in your agency.
Agency Tip: Struggling with a client’s video marketing strategy? Don’t stress! Try interactive visualizations by including clickable videos within the report. Interactive dashboards keep clients engaged and interested in the key performance indicators that move the needle. We’ve got you covered with this guide to video ads marketing.
What Should a Data Visualization Dashboard Include?
A dashboard isn't meant to be a place that marketers dump metrics and never look at again. Marketing dashboards are a great opportunity to start a conversation with a client. They’re clear, focused, and built around what the client actually wants to know.
Here are a few tips on what to include in a data visualization dashboard every time:
1. Clear KPIs That Align With Client Goals
Pick metrics that match the client's interests. For example, if a client’s goal is lead generation, marketers should highlight conversion rates, form completions, and cost per lead, not generic web traffic.
2. Visual Hierarchy That Guides the Eye
Clients skim. We all do. Your dashboard needs to guide their attention. Prioritize layout and color so key data stands out instantly.
3. Time Filters and Comparisons
Clients want to know if performance is improving. Add filters for date ranges and include comparisons (month-over-month, year-over-year) so trends are easy to spot.
4. Multi-Channel Integration
Bringing in data from multiple platforms like SEO tools, Google Ads, social media, email, helps you tell a complete story. This eliminates the need for separate reports and makes your team’s strategy easier to explain.
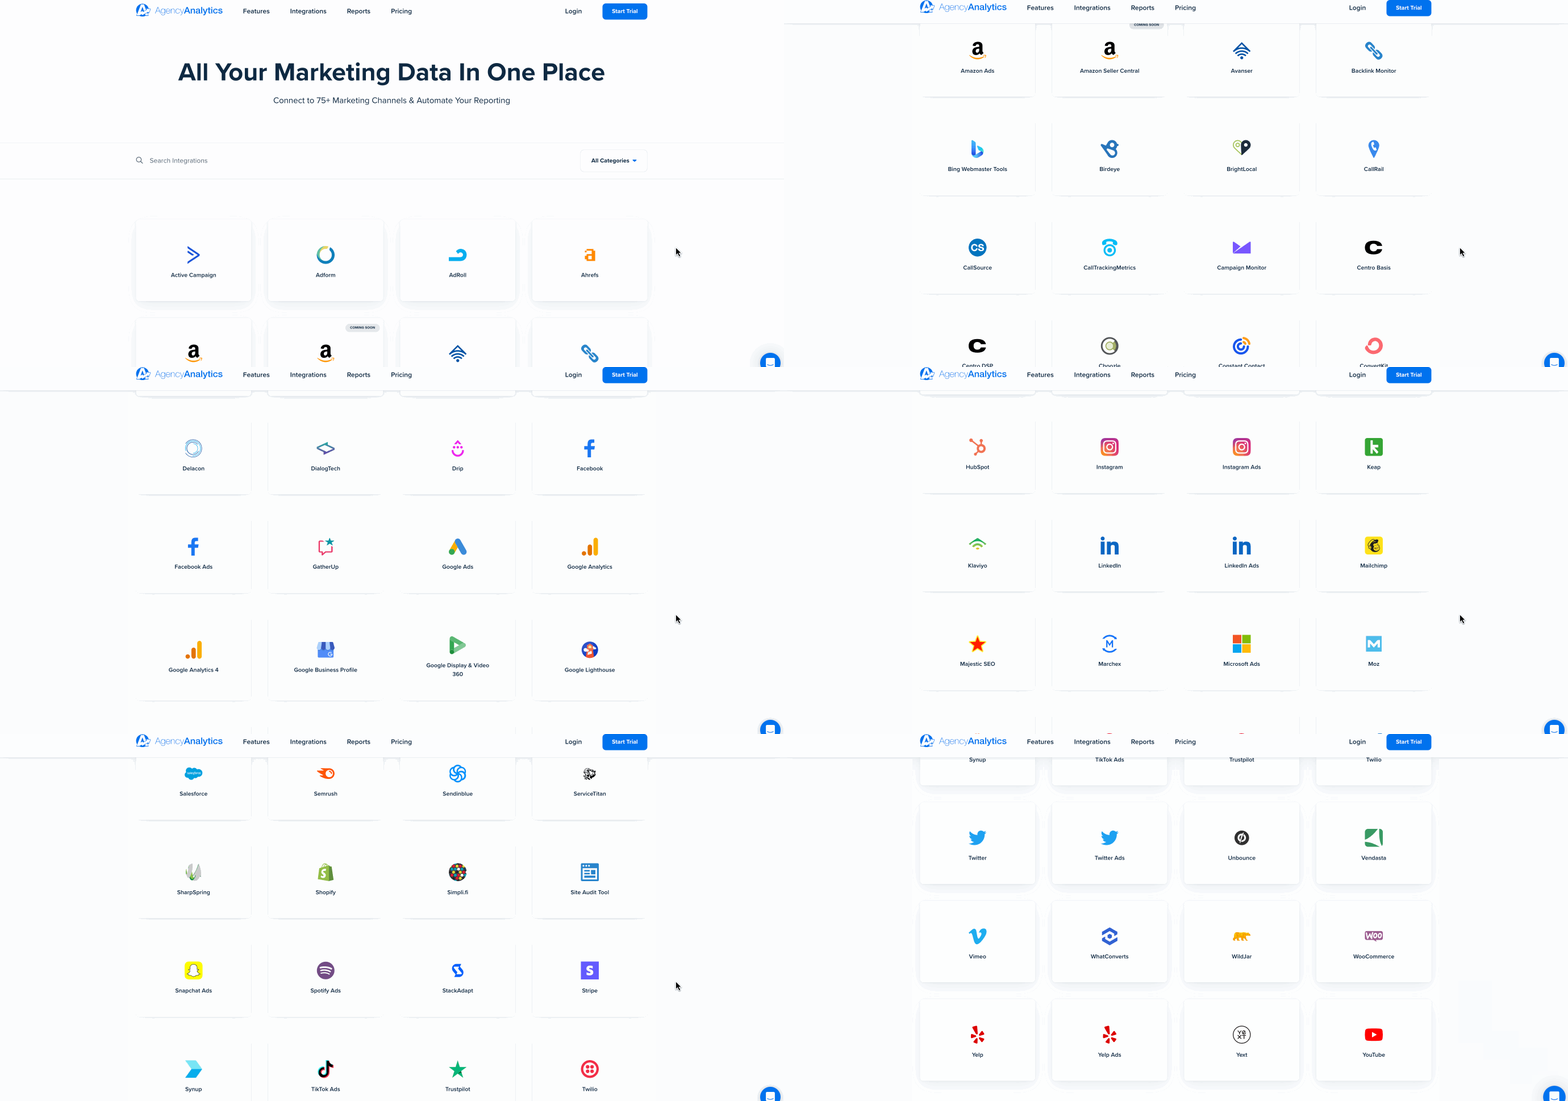
Easily connect 80+ marketing platforms and see all your client data in one place. Start your free 14-day trial with AgencyAnalytics.
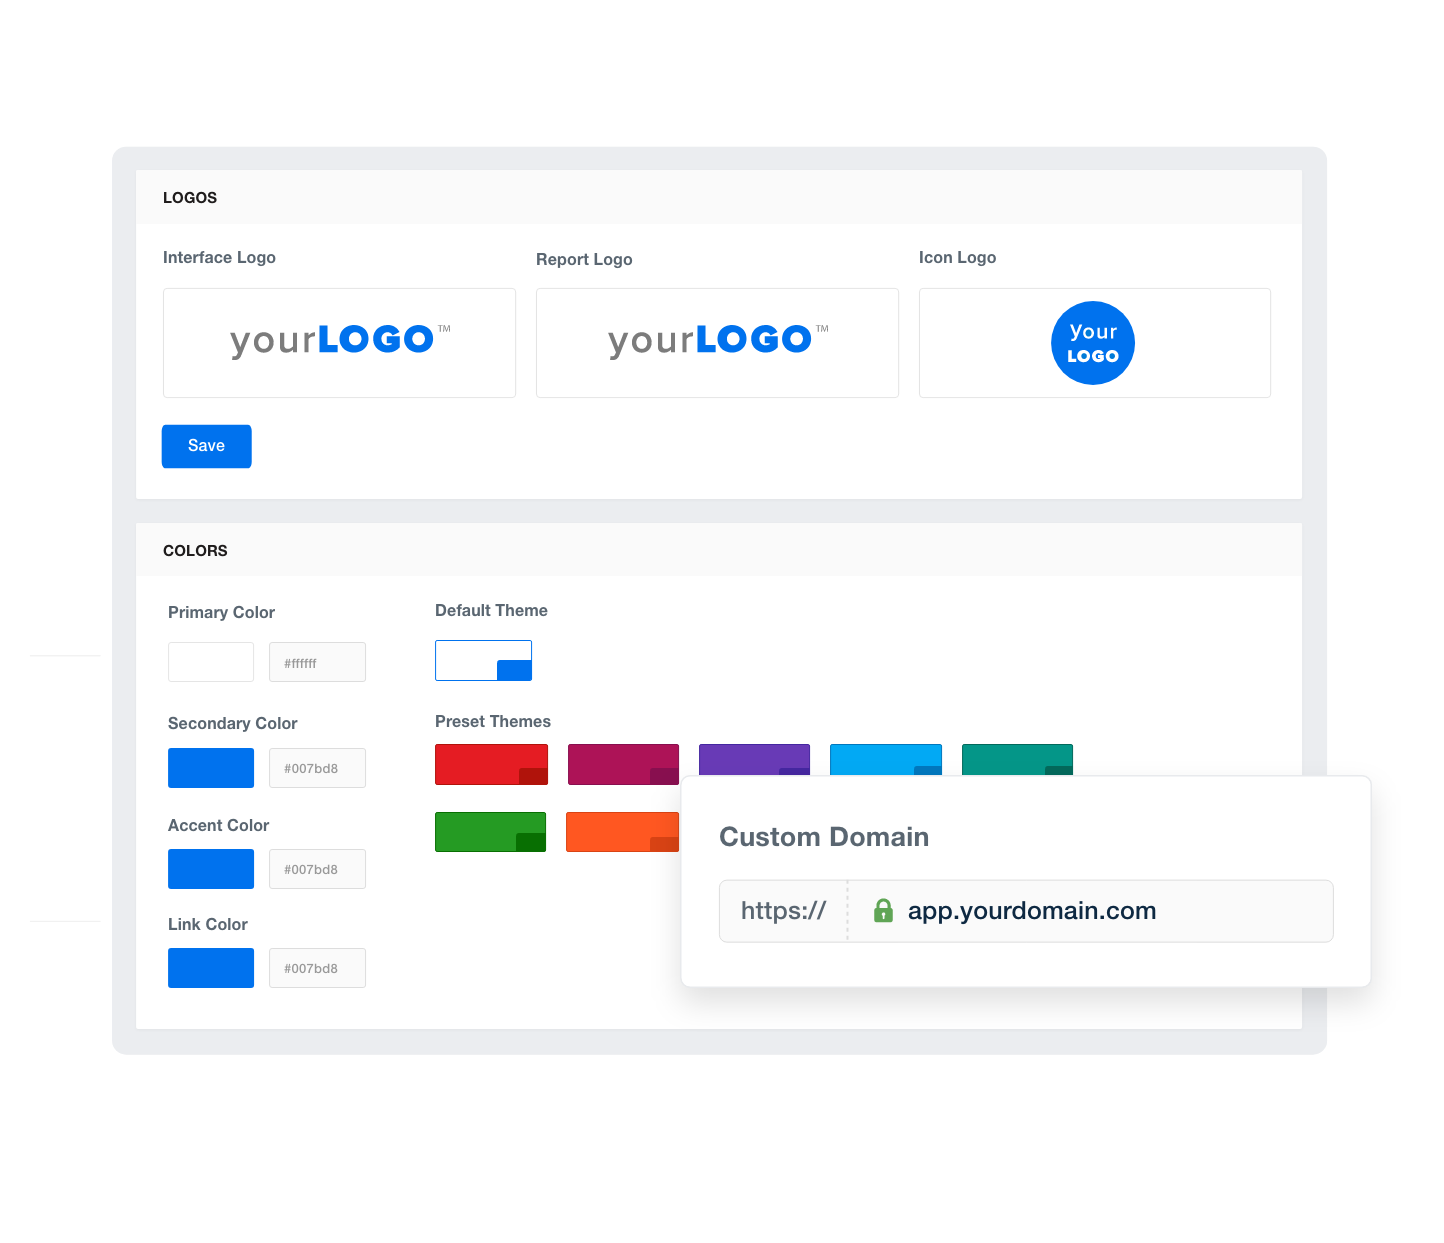
5. Custom Branding
White labeling helps clients feel like the dashboard was built just for them. Add their logo, custom color palette, and agency branding for a polished, professional experience.
6. Comments and Context
Numbers alone aren’t enough. Add notes to explain performance spikes or dips so clients understand the “why” behind the data—without needing to ask.
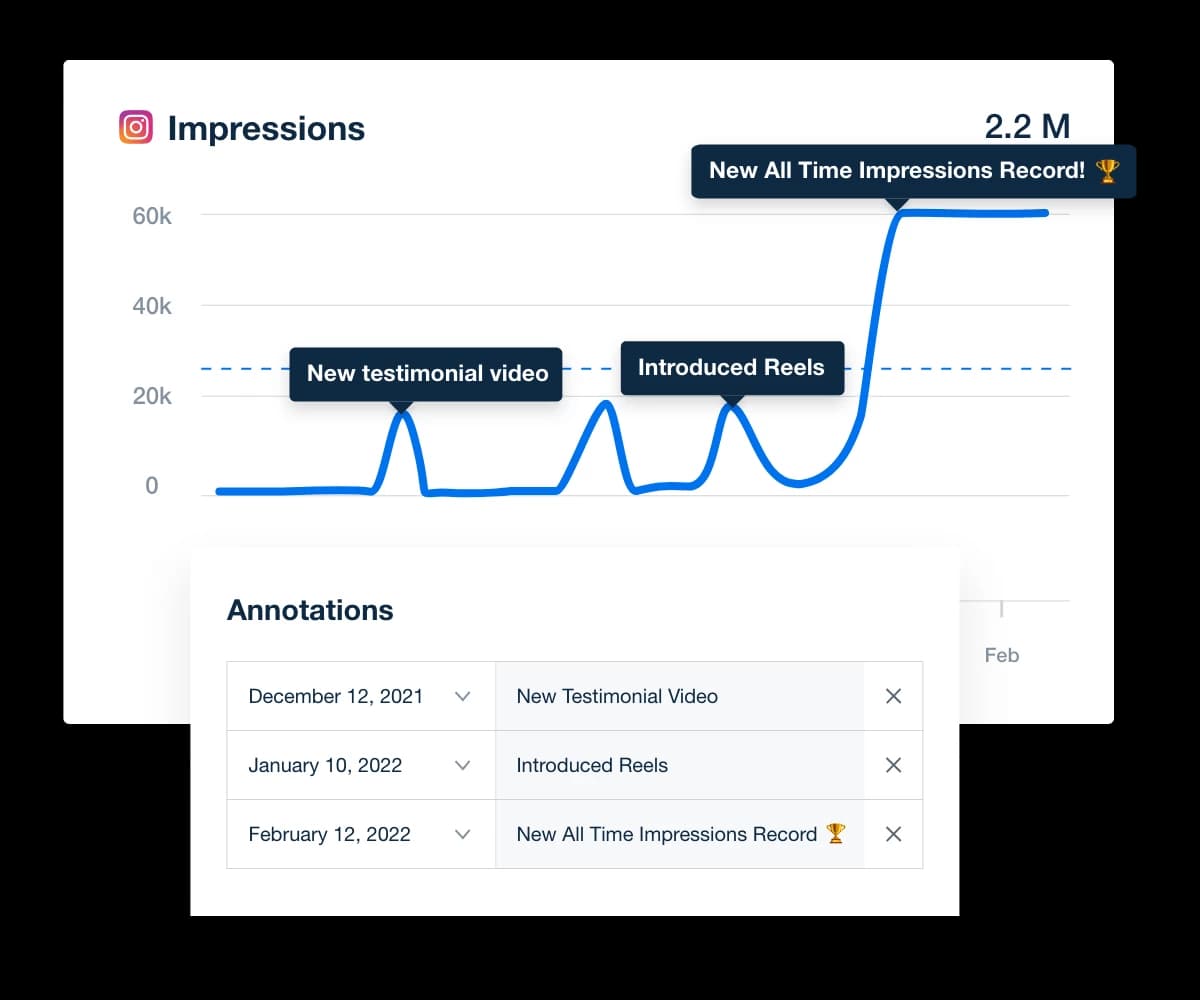
Add comments directly in your client’s dashboard to highlight wins, flag issues, and explain what’s driving the numbers. Give them clarity right where the data lives. Try AgencyAnalytics free for 14 days.
Conclusion
Client reporting doesn’t need to be a time-suck or a source of stress. With the right data visualization dashboards in place, agencies shift from reactive reporting to proactive conversations. You show clients the metrics that matter, explain performance with context, and keep everything in one clean, visual workspace.
Each of these metrics dashboards is built to do more than display metrics. They’re practical tools designed to save hours, improve clarity, and strengthen client relationships. And when your agency looks organized, strategic, and in control, clients notice.
Ready to streamline your reporting and give your clients dashboards that actually make sense? Start your free 14-day trial with AgencyAnalytics and see the difference in your next client call.

Written by
Richelle Peace is a writer with a degree in Journalism who focuses on web content, blog posts, and social media. She enjoys learning about different topics and sharing that knowledge with others. When she isn’t writing, Richelle spends time teaching yoga, where she combines mindfulness, movement, and her passion for wellness.
Read more posts by Richelle PeaceSee how 7,000+ marketing agencies help clients win
Free 14-day trial. No credit card required.


