Average View Duration
Content Optimization
Guide the improvement of content quality for increased audience engagement.
CTA Placement
Identify the right timing for in-video CTAs to increase conversions.
Client Reports
Clarify how different video formats and durations impact audience reactions.
A/B Testing
Demystify viewer responses to various video formats and lengths.
Why Tracking Average View Duration Is Important
Average View Duration (AVD) is a straightforward metric. It gives clear feedback as to whether viewers enjoy a video or not, by showing how much time they spend watching before they click away. A high Average View Duration signifies to the algorithm that viewers find a video useful. Subsequently, the algorithm recommends the video to more viewers.
Average Viewer Duration specifies where audience interest peaks or dips, thus allowing for strategic video targeting and optimization. It’s a barometer of content effectiveness, guiding marketers to tailor future campaigns for heightened engagement and impact.

Stop Wasting Time on Reports. Get Marketing Insights Faster & Drive Results.
How Average View Duration Relates To Other KPIs
Average View Duration is strongly related to other key performance indicators—Bounce Rate, Click-Through Rate, and Conversion Rates—that collectively show the success of a campaign.
This metric has an inverse connection with Bounce Rate. A high Average View Duration results in a decreased Bounce Rate as more viewers remain and engage with a video.
An increase in Average View Duration suggests higher engagement and interest among viewers. Engaged viewers are more likely to make a purchase, sign up for a newsletter, and refer friends and family, increasing Conversions.
KPIs like social Shares, Likes, and Comments are also affected by Average View Duration. Viewers who find a video interesting are often quick to engage with it on their socials, increasing social engagement and brand awareness.
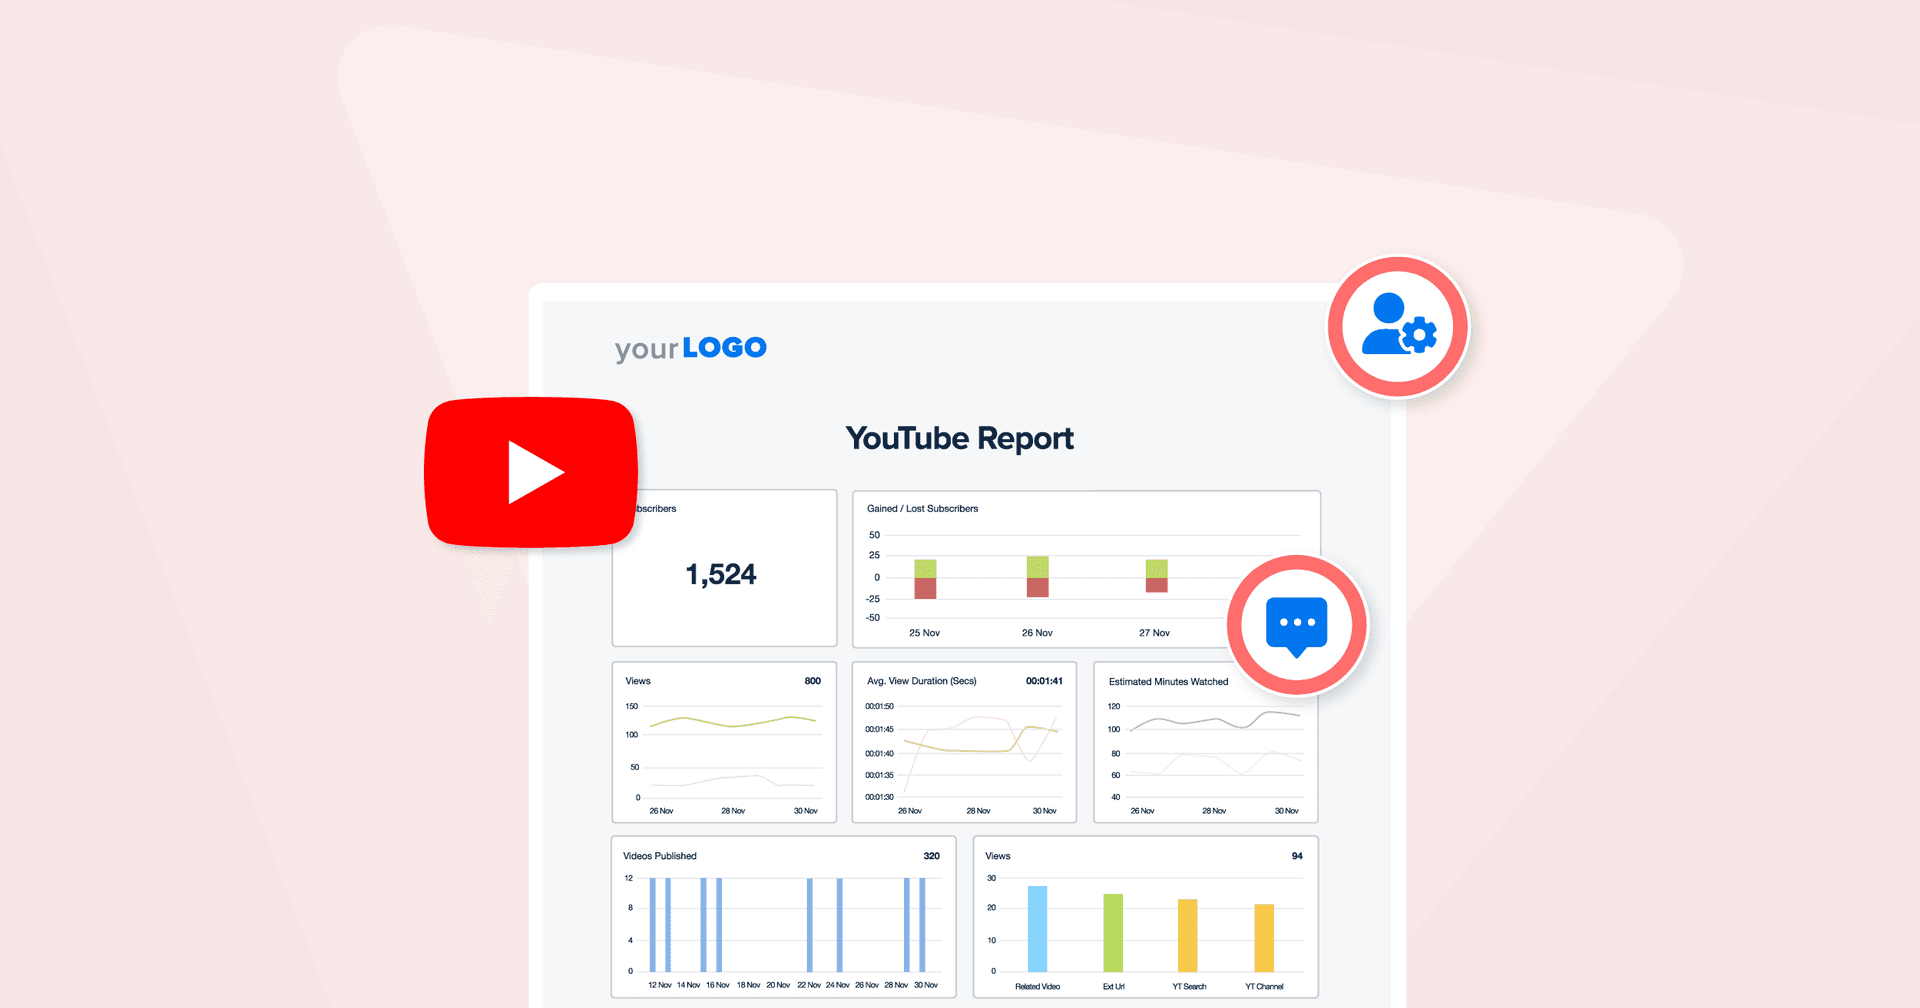
Pull all of this data together into a customizable YouTube dashboard, and quickly impress clients with your video success!

High quality audio and video go a long way to keeping a viewer watching. If you have cheap microphones and cameras and generally poor production, your viewing metrics such as Average View Duration, Click-Through Rates and Views of your other videos will be poor and this will hurt your channel’s visibility.
How To Calculate Average View Duration
Average View Duration has a straightforward formula. It's calculated by dividing the total watch time (in minutes) by the total number of views.
For instance, if a video has a watch time of 700 minutes and was viewed 100 times in total, the Average View Duration would be 7 minutes per view. To find Average View Duration in YouTube studios, sign in, navigate to analytics, select the video tab, choose video, and scroll down to view “audience engagement metrics > Average View Duration.
Average View Duration Formula Example
What Is a Good Average View Duration?
An Average View Duration of 50% and above is a good one. This implies that viewers are watching at least half of the video or more. This allows marketers enough time to present compelling evidence in support of the video topic, as well as clear CTAs to increase Conversions.
What Is a Bad Average View Duration?
An Average View Duration of 40% or below is a bad one. It suggests that viewers are not resonating with the video content and do not find it engaging. A poor Average View Duration often leads to an increase in Bounce Rate and a decrease in Ad Revenue.
How To Set Average View Duration Benchmarks and Goals
Historical data from industry peers and competitors helps gauge what is attainable versus what is a lofty goal to set. For instance, aiming for an Average View Duration of 60% is attainable. However, aiming for 90% Average View Duration might be too ambitious when compared to industry benchmarks, available resources, and audience engagement levels.

Why Average View Duration Matters to Clients
For clients, Average View Duration has a binary significance. An increase implies that a video campaign is successful and captivating to their audience, while a decrease means that something is wrong and should be fixed.
Average View Duration is also related to revenue. An increase in this metric means that viewers are engaging with the video for longer periods, indicating an interest in the topic, service or product featured–and enhancing the chances they’ll click a link to buy or learn more.
This metric is also important for brand visibility and recall. In a saturated industry, a high AVD implies that a company is breaking through the noise, capturing the attention of its audience, and expanding its reach.

Why Average View Duration Matters to Agencies
Agencies always look beyond the surface. Understanding the elements, visuals, and add-ons that prompt an increase or decrease in viewer behavior is paramount for them. Average View Duration helps agencies decipher what attracts viewers, retains them, and when viewers drop off or engage more, thus allowing for fine-tuning of content to increase efficiency and maximize engagement.
Average View Duration should be treated like a roadmap into the minds of viewers, revealing their preferences and desires. This metric empowers agencies to optimize content strategies to be aligned with client objectives and the desires of a target demographic.

Win Back Billable Hours by Automating Your Client Reporting
Best Practices When Analyzing and Reporting on Average View Duration
Reports on Average View Duration helps to measure ROI over time and provide room for continuous improvement through a feedback loop. Using this information, strategies are iterated for ongoing success.
Analyze Over Time
Observe AVD trends across weeks, months, quarterly, or annually to understand long-term audience preferences.
Compare Across Channels
Compare this metric across channels to understand viewer response and pinpoint channels that generate higher AVD.
Put KPIs in Context
Report Average View Duration and its effects on other KPIs and the overall marketing strategy.
Align to Client Goals
Show how changes in Average View Duration bring clients closer to their campaign goals of increased ad revenue and increased conversions.
Visualize Performance
Use visuals, charts, and graphs to report and analyze data. This makes it easy to spot anomalies, trends, and areas of improvement.
Include Actionable Recommendations
Based on trends and analysis, provide steps to take and adjustments to make in order to optimize resources and drive impactful decisions.
Video is a big part of our strategy–it’s the most informative and interesting way to get your message out. From dynamic animated logos to how-to videos and short format social media video, it hits all the marks for introducing our clients to solutions, putting our brand out there, and catching your eye in a high-value way!
FAQs About Average View Duration
Curious how average view duration connects to audience engagement and video success? These FAQs explain how tracking view duration for YouTube videos and other video platforms informs content optimization, improves search rankings, and encourages viewers to stay longer on client videos.
Average View Duration measures how long viewers typically watch a video before clicking something else. It shows whether the content maintains audience interest and delivers enough value to keep them engaged.
Average View Duration is calculated by dividing a video’s total watch time by the total number of views. For example, if viewers watch a total of 700 minutes across 100 views, the Average View Duration is 7 minutes.
Average View Duration helps assess viewer engagement by revealing how long people stay interested in a video. A higher duration means viewers find the content useful, which increases the chance they’ll convert or take action.
Strong thumbnails, quick and clear intros, and high-quality visuals increase Average View Duration. People generally stay longer when content delivers value quickly and keeps distractions to a minimum.
Low Average View Duration often signals that viewers aren’t staying for long—possibly due to poor production quality, weak intros, or irrelevant content. It highlights where audiences drop off, giving creators a clear roadmap to adjust video length, hook viewers early, and keep them watching longer.
A high Average View Duration tells the algorithm that the content consistently holds attention. This increases the likelihood it will appear in search results, suggested videos, and homepage feeds.
YouTube Studio doesn’t just show view duration on YouTube—it pinpoints when viewers stop watching, which videos quickly lose interest, and how chapters or end screens affect retention. Content creators can identify underperforming sections and improve structure, tone, or video length to hold audience attention longer.
While Average View Duration tracks how long viewers stayed, Average Percentage Viewed shows how much of the video they actually watched. This is especially useful when comparing YouTube Shorts to longer videos, offering a clearer performance metric across different content lengths.
YouTube performance improves when value is delivered early. Viewers hooked in the first few seconds are more likely to stay engaged. Using strong intros, visual storytelling, chapters that dive deeper, and consistent pacing helps improve Average View Duration—particularly in educational or tutorial videos.
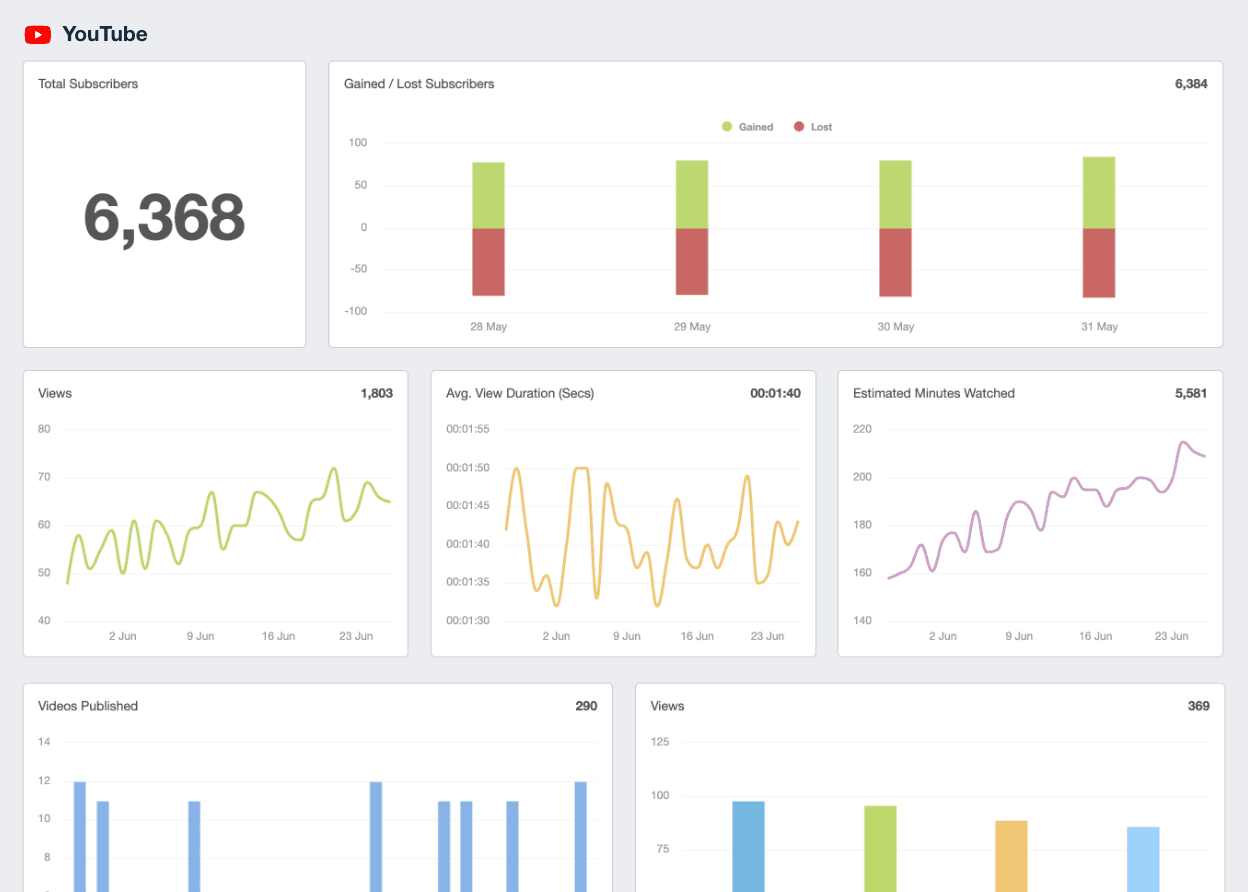
YouTube Dashboard Example
How To Improve Average View Duration
Average View Duration isn’t a vanity metric. It directly impacts the bottom line of every business. Whether an agency is aiming to increase Ad Revenue or Retention Rates, these tips will help.
Optimize Video Thumbnails
Give videos a strong visual appeal by using compelling words, and colorful pictures on thumbnails.
Use Short and Engaging Intros
Reduce video bounce rate by keeping intros short and getting to the point quickly.
Create High Quality Videos
Keep viewers engaged with high quality graphics, transitions, and video elements.
Related Blog Posts
See how 7,000+ marketing agencies help clients win
Free 14-day trial. No credit card required.


