Table of Contents
QUICK SUMMARY:
YouTube metrics, the quantitative indicators of channel performance, play a pivotal role in shaping video marketing strategies. Encompassing vital KPIs like view count, watch time, engagement rate, and subscriber growth, these metrics are essential tools for evaluating and enhancing YouTube video campaigns. This article highlights the top 10 YouTube metrics and KPIs, vital for assessing and enhancing the success of YouTube videos.s.
Whether you’re managing a YouTube account for your agency or clients, there’s no question that building a successful YouTube channel involves a significant amount of work.
Aside from planning, creating, and editing new content, one of the most important aspects of growing a channel is staying on top of YouTube metrics and analytics. To do this effectively, you need to access YouTube analytics to monitor and analyze your channel's performance.
After all, how would you know what’s working if you don’t track progress? Amidst the ongoing growth of video marketing, your agency must know how to optimize YouTube video content, and it’s only possible through data tracking.
What Are YouTube Metrics and Why Are They Important?
YouTube metrics are a set of quantitative data points that measure the performance of videos and channels on the YouTube platform. These metrics encompass a range of indicators including view count, watch time, engagement rate (likes, comments, shares), subscriber growth, and more. They are essential for a marketing agency managing client campaigns as they provide critical insights into audience behavior and content performance through YouTube analytics data.
A KPI is a measurable value that indicates how well an organization is achieving its key objectives.
Analyzing these KPIs helps agencies understand what resonates with the audience, allowing them to tailor content accordingly. This data-driven approach ensures that clients’ YouTube strategies align with user preferences and trends, leading to increased engagement, brand awareness, and ultimately, a stronger return on investment. Additionally, these metrics aid in refining targeting strategies, optimizing content for search, and measuring the overall impact of campaigns on achieving clients’ marketing objectives.
The Top 10 YouTube Metrics Your Agency Should Know
Let’s get into it! To better understand the role of YouTube metrics, we’ve divided them into three categories for easy reference: channel, reach, and engagement metrics.
Here’s a breakdown of each subset and essential YouTube metrics to keep track of.
YouTube Channel Metrics
In many ways, a YouTube channel can be analyzed similarly to a website. Channel metrics give a high-level overview of the growth and popularity of your client’s YouTube account. Here are the top ones to keep track of.
1. Subscribers
Subscribers are an important KPI since they show how well your videos attract superfans. Track this number regularly to ensure that you’re nurturing and growing your client’s core base in the long term.
A video that increases your subscriber count is ultimately effective. And an increased subscriber count makes it much more likely that future videos will perform well with your most loyal viewers or customers. Additionally, understanding your YouTube audience, including their demographics and behavior, is crucial for tailoring content and making strategic decisions for channel growth.
2. Most Popular Videos
Identifying the top 5-10 videos by views and engagement will help inform future efforts. Data from these popular pieces of content can help show what elements from your video audiences seem to like best–which you can then replicate. Analyzing the number of times specific parts of a video are re-watched can also provide insights into viewer interest at particular moments.
The more views, comments, and likes you get on your client’s video, the better! Use this information to understand the best posting schedule so you’re not just annoying everyone with mundane updates every day.
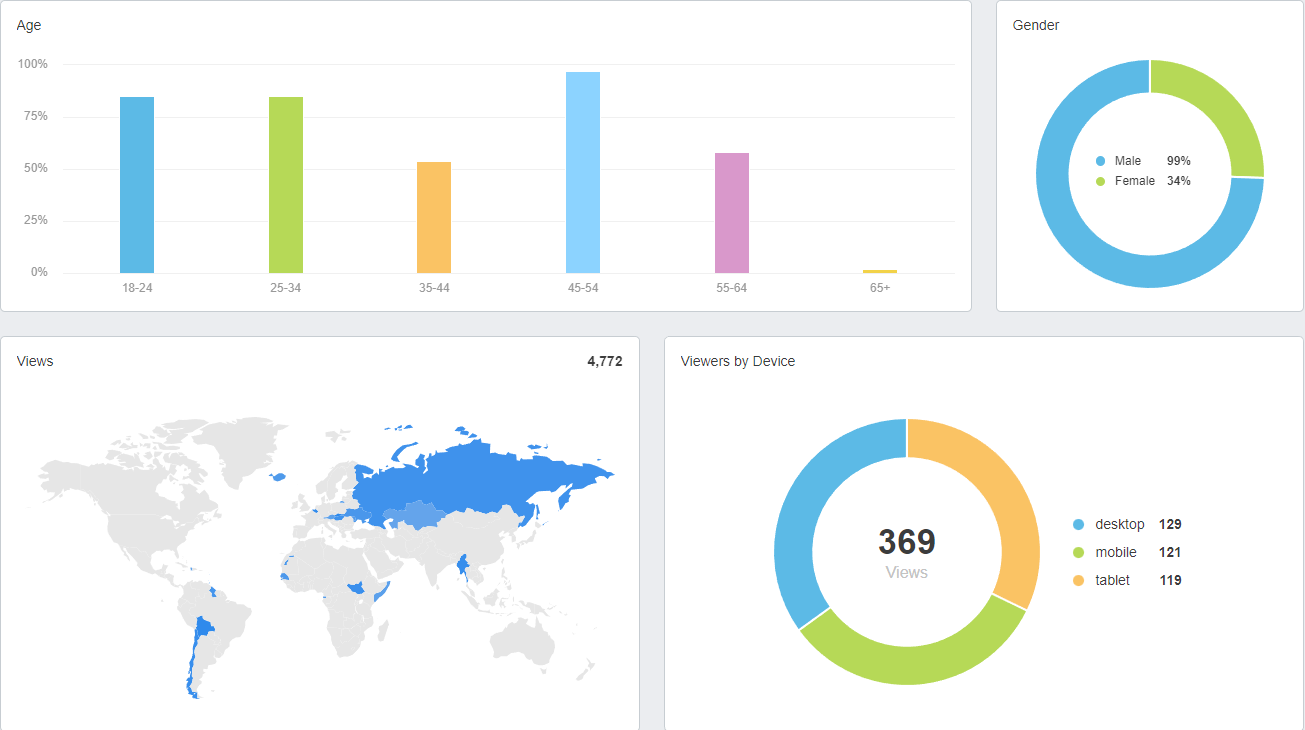
Agency Tip: One of the best ways to grow a YouTube channel is to know exactly who you’re speaking to, which is why understanding your audience demographics is an absolute must. Keep an eye on insights such as age groups, gender, location, and device type. That way, you’ll know how to adjust your client’s video content and develop new ideas.
Reach Metrics
Since brand visibility is an essential consideration for any business on YouTube, reach metrics provide an overview of how far their content is spreading– here’s what you should know.
1. Views
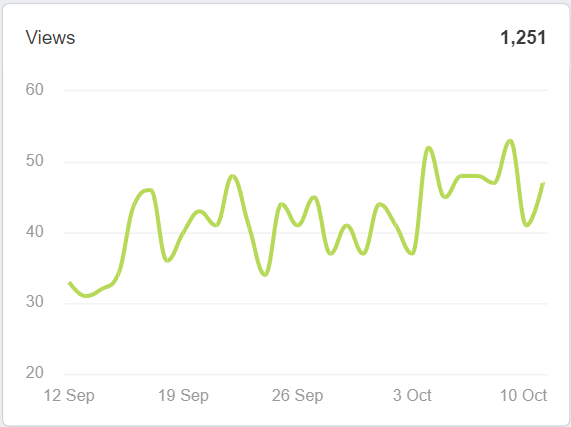
Views are the broadest quick-check metric from which to start your KPI tracking. You know you're on the right track when they’re growing from video to video. When they aren’t, it might be time to pivot (or at least dive deeper) into other KPIs to ensure your YouTube content is proving effective in the ways that count, i.e., conversions.
Keep in mind that views alone are an incomplete measure of success, though. If a video has thousands of views, but an average watch time of 2%, it’s not a success, and other areas need evaluation (e.g., title, thumbnail).
2. Unique Viewers
In basic terms, unique viewers are equivalent to unique visitors to your client’s website.
It’s a useful KPI because it tells you how many new viewers your videos reach over time. Use it with other metrics to analyze how your client’s videos perform within subscriber segments.
If this number is not growing over time, you might be leaning too heavily on your baseline audiences, and/or your ad targeting may need some refinement. Conversely, if this KPI persists within a flatter growth trajectory (but overall views remain strong), you know you’re doing an excellent job serving subscribers.
3. Traffic Sources
Traffic source data lets you know where YouTube traction is coming from. It also helps you to understand if there are more hits from searches, browsing, playlists, or suggested videos.
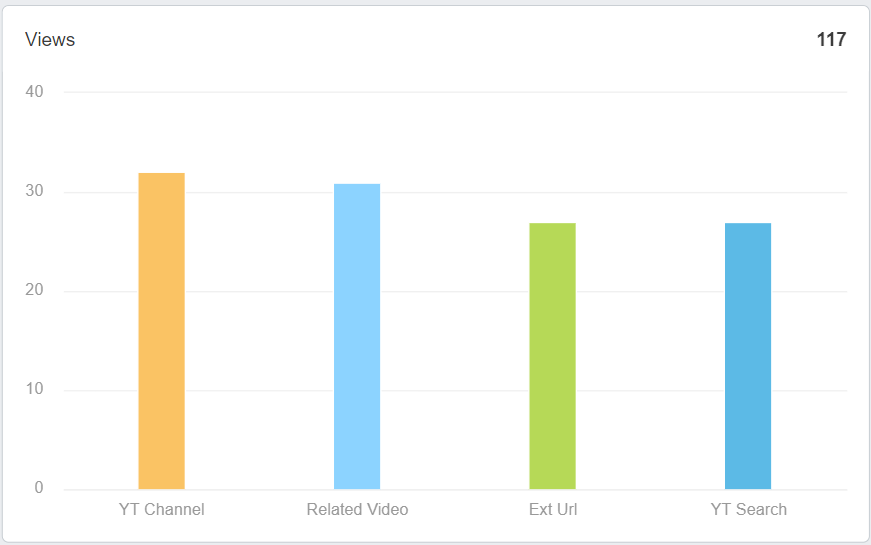
This metric helps you to target growth areas. For instance, if a video performs particularly well based on a YouTube search, you’ll want to dig into other metrics to determine why. Alternatively, if your video is being found through a specific playlist, that’s another opportunity to explore.
4. Audience Retention
Use this metric to understand how well a video retains viewers over time by measuring the average percentage of a video that viewers watch. YouTube will also present this data across a benchmark of all other videos on the platform of a similar running time. That way, you’ll have a better gauge of video performance.
Spikes or dips within this metric may hint at how well different subtopics perform during a video’s duration. Use spikes to indicate content resonating with your client’s audience. Similarly, monitor dips to understand better what topics to ditch or reengineer.
Agency Tip: Identify which types of keywords guide viewers to your client’s videos. That way, you’ll also uncover any new organic keywords to refine paid and unpaid targeting.
Engagement Metrics
While it’s important to the reach of your client’s content on YouTube, it’s equally important to understand what content resonates with a target audience.
Since YouTube is far more likely to suggest content that people are engaging with, these metrics are essential to channel growth.
1. Watch Time
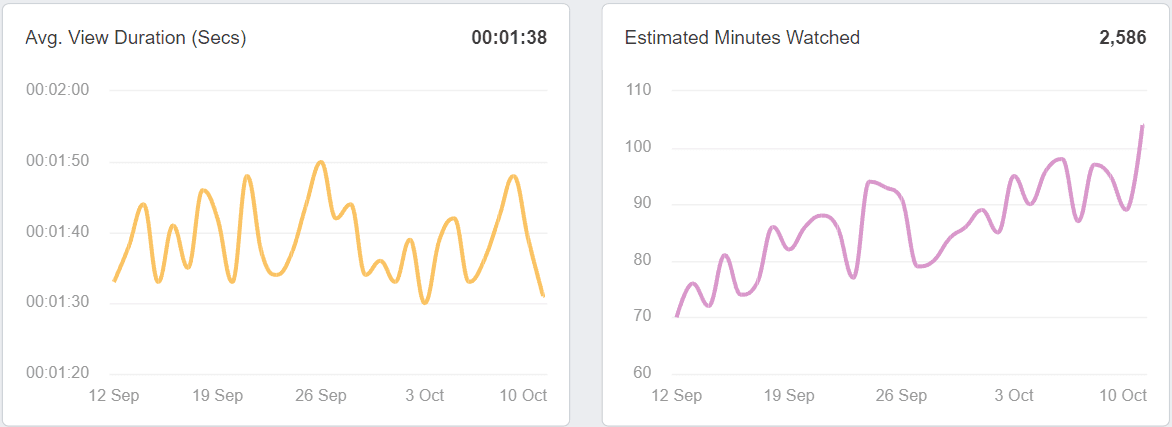
This critical KPI helps you analyze how well your videos deliver on their intended promise–to provide content worthy of watching all the way through (or close to it).
Another important metric to consider is the click-through rate, which helps evaluate the efficiency of your thumbnails and video titles by analyzing how often viewers click to view a video after seeing a preview or video suggestion for it.
Simply put, high average watch times indicate success and mean that viewers are sticking with your video.
Low indicators in this category mean that something isn’t working and could use a fresh look.
2. Likes, Dislikes, and Comments
These are standalone engagement metrics that measure content performance. A word of caution, though–don’t view them in isolation or make strategic decisions solely based on these (otherwise, they’re just vanity metrics). Rather, use these numbers as tie-ins and secondary support for the overall performance picture.

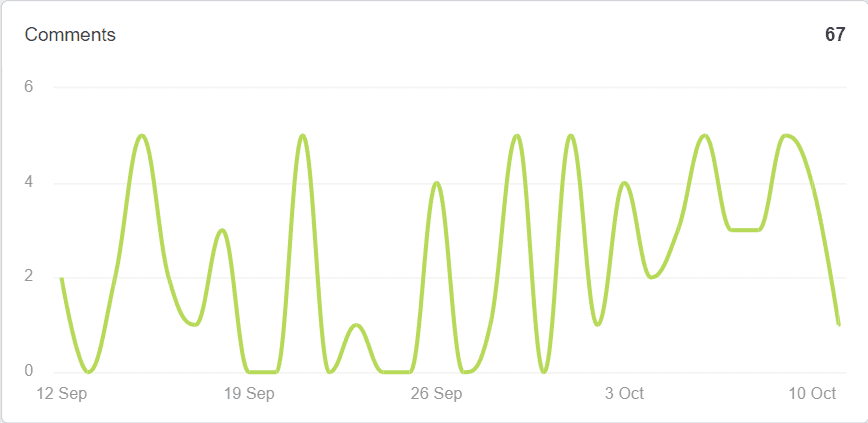
Growth in these marketing metrics will trigger algorithms and prove your video’s worth to future audiences. And even though YouTube removed the public-facing “dislikes”, you still want more likes than dislikes.
3. Shares
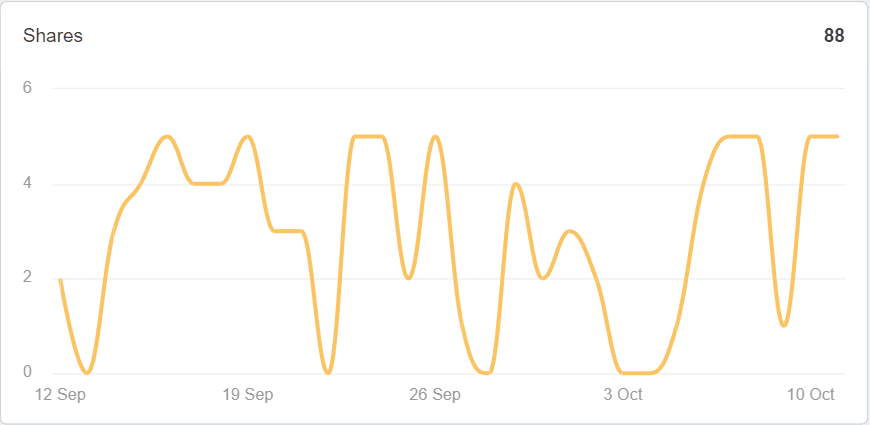
While technically belonging to the same category as the above, a share is an especially strong vote of viewer confidence in your client’s video. As such, it makes sense to monitor this metric closely. Measuring the number of shares will show you what topics and formats are resonating with your intended audiences.
4. Engagement
This consolidated KPI shows the level of viewer interaction with your client’s videos. For a more high-level overview, use this metric to understand the total number of likes, dislikes, comments, and shares.
High engagement means something is working. It will also trigger algorithms within YouTube to surface your video for more viewers organically and within ad campaigns. Note that there’s often a direct correlation between high or low engagement and other KPIs.
Agency Tip: Your client’s YouTube video title and description are as important as the video itself. Drive viewer engagement and clicks to your client’s website by researching the most relevant keywords beforehand.
And there you have it! Use these metrics to track your client’s YouTube performance and bring them one step closer to marketing success.
YouTube Metrics vs. KPIs–What’s The Difference?
We’ve been over the difference between KPIs and metrics before. In simplest terms, key performance indicators (KPIs) are exactly that–measurements tied to business objectives. Metrics, by contrast, are more goal-agnostic. They inform KPIs but aren’t necessarily linked directly to growth trajectories.
For example, video views are more of a metric than a KPI because views won’t necessarily translate to anything meaningful for the business. However, view time could be used as a KPI, as it means that the target audience is actually engaging with your video content.
Metrics show you where the wind is blowing, whereas KPIs are the constellations used to chart your journey. As such, some metrics can stand in for KPIs as you see where you’re moving, but not all will precisely link back to performance in the ways that ultimately count–for example, MQLs and conversions.
How Often You Should Track YouTube Metrics and KPIs
Even if your videos are performing well, YouTube metrics and KPI tracking need to be about getting smarter about what’s working and what could be improved.
Some factors to consider when deciding how often to track YouTube data may include:
Your client’s publishing schedule and/or ad campaign schedule
The specific KPIs you’re tracking and how they may impact future content decisions
What’s considered appropriate or standard for each client industry or niche
When an ad campaign is active, for instance, you’ll likely want to check in at least daily. Weekly could work as well, depending on the timeline of the campaign and your ability to test and change out assets (e.g., it can take some time to revise a video that’s underperforming).
Other KPIs require more patience. Subscribers are a crucial indicator of long-term growth and engagement, so give yourself more time to test and analyze that KPI. Similarly, time watched, and the different flavors of engagement metrics may benefit from weeks or months in between any significant actions you might take regarding strategic shifts on YouTube.
A sample schedule might look like this:
Daily monitoring
Weekly analysis and small adjustments, such as acting on results of A/B testing
Monthly analysis and strategy adjustments, based on 1 and 2 and against KPIs
Quarterly analysis against larger client KPIs
How To View YouTube Data Insights and Analytics
The first (and easiest) place to go for data insights on YouTube will be using the YouTube integration with AgencyAnalytics. By utilizing a YouTube analytics tool, you can access and analyze data directly from YouTube Studio, making it easier to track the channel's performance.
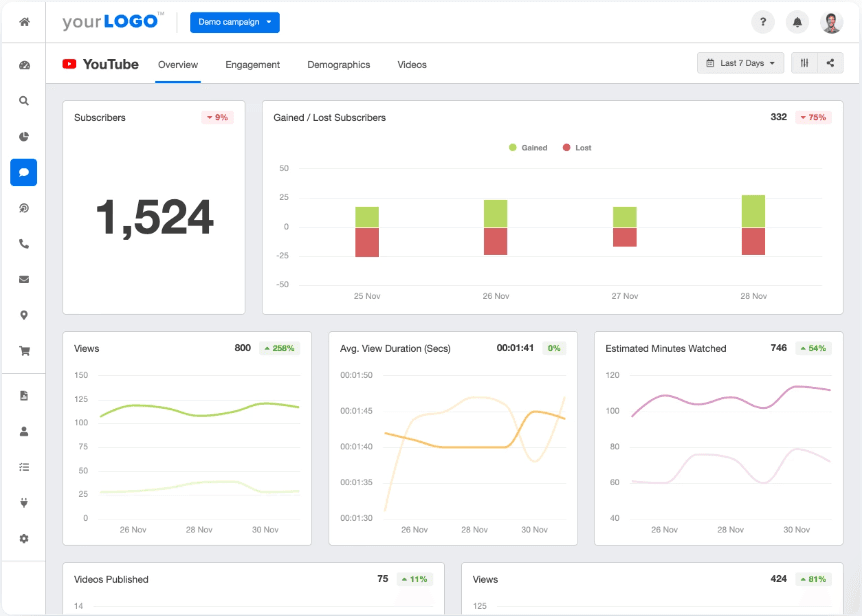
Although there are various YouTube analytics tools available to a marketing agency, when you invest in AgencyAnalytics, your team immediately turns YouTube analytics into a beautiful KPI dashboard or client report that will make it easier than ever to see what’s working.
Want to find out how easy it is to create a YouTube analytics report for your clients? Try AgencyAnalytics free for 14 days!

There’s also an Advanced mode that can be triggered by clicking the text link in the upper-right-hand corner of your YouTube Analytics tab within your YouTube Studio. This view will offer more customization to dig deeper into your YouTube channel analytics, allowing you to track various metrics and data for your channel.
But aside from planning, creating, and editing new content on public YouTube channels, you’ll also need to stay on top of your YouTube analytics. By tracking these insights through the YouTube Studio app, you’ll be in a better position to measure the results of past videos and determine if your client’s current strategy is on par.
While native data Google Analytics provides all the needed information to measure results, there are a few reasons why agencies should enlist other analytics tools
These include:
Simplified, streamlined reports
Cross-platform analytics (YouTube and other channels and KPIs)
Aggregating and comparing data across multiple campaigns and accounts
Tracking and analyzing competitors and trends
Customizing charts
Whether you’re growing the channel organically or through paid ads, efficiently analyzing and reporting results can be a challenge for agencies. To solve this, use a dedicated YouTube dashboard to pull relevant metrics and KPIs and develop data visualization automatically. Experiment with the best combination of tools that work best for you and your clients, including YouTube video marketing analytics to track and analyze metrics for specific videos on your channel.
Consolidate YouTube Insights in One Place
By now, it should be clear that the best consolidation of YouTube data depends on what metrics and KPIs you need to track for your clients. Take the time to evaluate each client’s needs, strategies, and long-term goals to determine what exactly to measure.
As your agency begins to scale, pulling all that manual data will only slow you down and cause unnecessary headaches. That’s why you should invest in a long-term KPI reporting solution like AgencyAnalytics.
Creating a customizable, white-labeled report is just a click away!
And it doesn’t just stop at YouTube insights. With our custom dashboard feature, it’s easy to highlight your clients’ SEO, paid search, and social media successes–all under one roof. Check out our social media marketing dashboard, where you can combine all your marketing efforts for your clients.
Gather all of your client’s key metrics and KPIs with ease every month. Try AgencyAnalytics free for 14 days–no credit card required.

Written by
Michael DiBiasio is a Marketing and Storytelling Consultant and Content Strategist working out of New York City and Burlington, Vermont. With experience as a Head of Marketing (SaaS, eComm) and as a Video Marketing Lead (professional services), he helps stakeholders find the sweet spot between audience needs and values and their own sales and service goals.
Read more posts by Michael DiBiasioSee how 7,000+ marketing agencies help clients win
Free 14-day trial. No credit card required.


