Table of Contents
Table of Contents
- What are content marketing metrics?
- What are your objectives and KPIs for content marketing?
- 15+ important content marketing metrics to track
- Traffic & visibility metrics
- User behavior metrics
- SEO metrics
- Conversion metrics
- Content production & efficiency metrics
- How to measure content marketing success
- Summary: Leverage the full potential of content marketing metrics
7,000+ agencies have ditched manual reports. You can too.
Free 14-Day TrialQUICK SUMMARY:
Content marketing metrics highlight the role content plays in driving measurable results, including traffic growth, user engagement, lead volume, and conversions. They’re also used to evaluate top-performing formats, identify areas for improvement, and align content efforts with broader objectives. This article outlines 15+ content marketing metrics agencies should track, and explains why using a reporting tool like AgencyAnalytics is essential for consolidating data across multiple channels.
Content marketing is a must-have strategy for climbing search engine results pages, gaining organic visibility, and building authority. There’s no doubt about it, even as AI reshapes how search works. But measuring the actual impact of those efforts? That’s another story, as many content marketers know.
There’s no shortage of data—impressions, average time on page, scroll depth… you name it. The list goes on. With so much in motion, it’s often challenging to know which ones are worth reporting on. Still, when clients ask, “Is our content bringing in qualified leads?” or “What’s actually driving social media engagement?”, you’ll need the right content marketing metrics to answer with confidence.
Plus, you’re not just managing one content marketing campaign. With multiple clients on the roster, it becomes a task to compile all that data and present it in a digestible way that means something. Needless to say, it’s a lot to consider.
Not sure where to begin? You don’t need an overly complex content marketing program—just a solid strategy and a clear understanding of what to measure. In this article, we’ll share 15+ content marketing metrics that actually matter, along with the importance of using a reporting tool to track multi-channel data in one place.
What are content marketing metrics?
Content marketing metrics are measurable data points that show how well content contributes to specific objectives. While it varies between clients, common goals include increasing visibility, engaging target audiences, generating leads, or driving conversions.
In a nutshell, these metrics help your agency to refine SEO strategies, pinpoint promising content formats, and demonstrate tangible impact.
What makes a great content marketing metric?
A great content marketing metric moves past basic performance, showing clients how their efforts tie into tangible outcomes.
More specifically, it should be:
Actionable: A useful metric points to a clear next step (e.g., improving underperforming content or investing in a well-performing format).
Reliable: This data should be consistently trackable over time and sourced from trusted data sources.
Contextualized: Performance should be measured against relevant benchmarks or historical trends to create a broader narrative.
Outcome-Oriented: Focus on metrics that reflect business goals—like qualified leads, conversions, or revenue—instead of surface-level vanity metrics.
Content marketing measurement goes beyond tracking arbitrary data points. To deliver real value, focus on meaningful metrics that support your client’s overall SEO strategy.
What are your objectives and KPIs for content marketing?
The right content marketing metrics depend entirely on your client’s goals. Without that foundation, it’s easy to waste time measuring the wrong things.
As a best practice, ensure your team and the client agree on what success looks like. Setting clear expectations makes it easier to create relevant content that delivers the intended results.
KPIs keep us accountable, provide the client with transparency into what work we deliver, and, most importantly, demonstrate that we are on track and achieving mutually agreed-upon goals. This is our agency's true north: "Results for clients."
David Krauter, SEO Strategist, Websites That Sell
For greater clarity, here’s a breakdown of common objectives and their corresponding KPIs.
Objective | Key Performance Indicators (KPIs) |
|---|---|
Increase website traffic | Pageviews, unique visitors, traffic by source, new vs. returning users. |
Boost engagement metrics | Average time on page, scroll depth, bounce rate, comments, shares. |
Generate leads | Form submissions, gated content downloads, newsletter signups. |
Support SEO performance | Keyword rankings, backlinks, organic search traffic, domain authority. |
Improve brand awareness | Social impressions, mentions, branded search volume. |
Drive revenue or conversions | Conversion rate, influenced sales pipeline, cost per lead. |
By defining objectives beforehand, you’ll ensure that content efforts are measurable, purposeful, and effective.
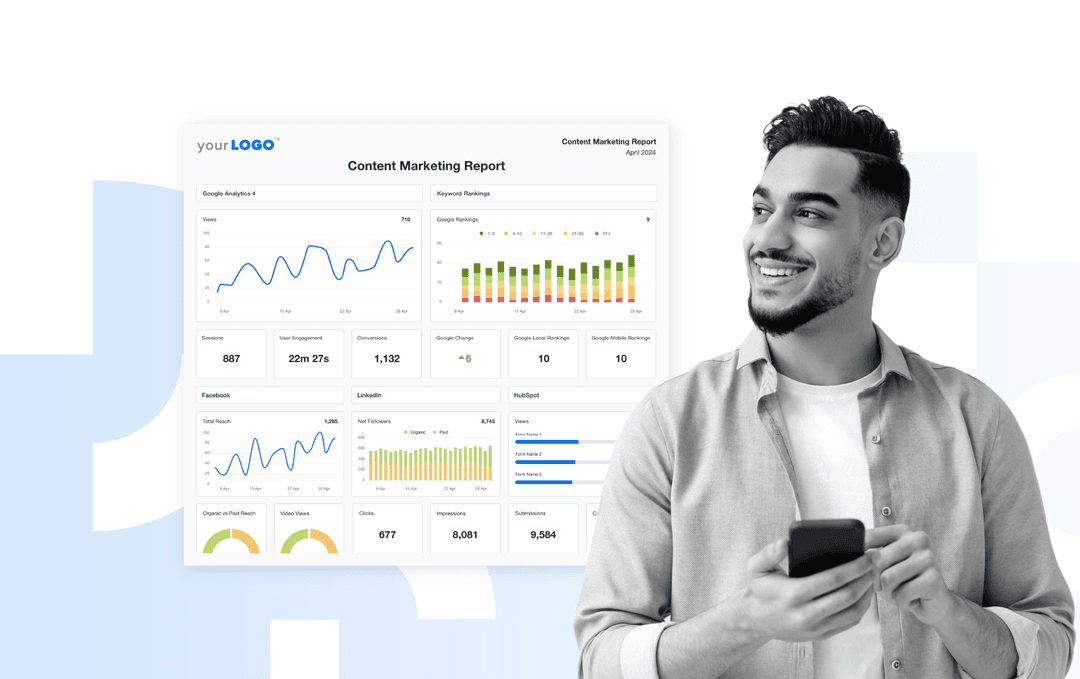
Measure content marketing effectiveness without the hassle. Invest in a reporting solution that consolidates data across Google Analytics, social media platforms, and 80+ channels. Try AgencyAnalytics, for free for 14 days.
15+ important content marketing metrics to track
Content marketing delivers long-term, sustainable results. Unlike paid ads, though, it doesn’t offer instant feedback or easy-to-calculate ROI. That’s where content marketing success metrics come in.
Here are the top ones for evaluating performance and ensuring your clients see measurable impact from their investment.
Traffic & visibility metrics
These metrics show how many people discover and view your client’s content. Use them to gauge reach, visibility in search engines, and overall content exposure across channels.
1. Pageviews
Pageviews track the number of times a content page is loaded, including repeat views from the same user. This metric gives a general sense of how visible and popular a piece of content is.
Consistently high pageviews may signal strong SEO performance or effective distribution across channels like email or social media. On the other hand, low pageviews could indicate issues with promotion, topic relevance, or search visibility.
2. Unique Visitors
Unique visitors reflect the number of individual users who viewed a piece of content during a set period, regardless of how many times they return. This metric gives a clearer picture of the true audience size.
A high number of unique visitors suggests growing reach and awareness. Conversely, low numbers may indicate poor discoverability or a mismatch between content and audience interests.
3. Traffic Sources
Traffic sources show where users are coming from, such as organic search, direct visits, referral links, social media, or email. This breakdown helps identify which channels are most effective at driving quality traffic.
A healthy mix of sources is ideal, since it reduces risk and ensures content reach isn’t dependent on a single platform. Overreliance on one channel could mean potential disruptions if there are significant algorithm or regulatory updates.
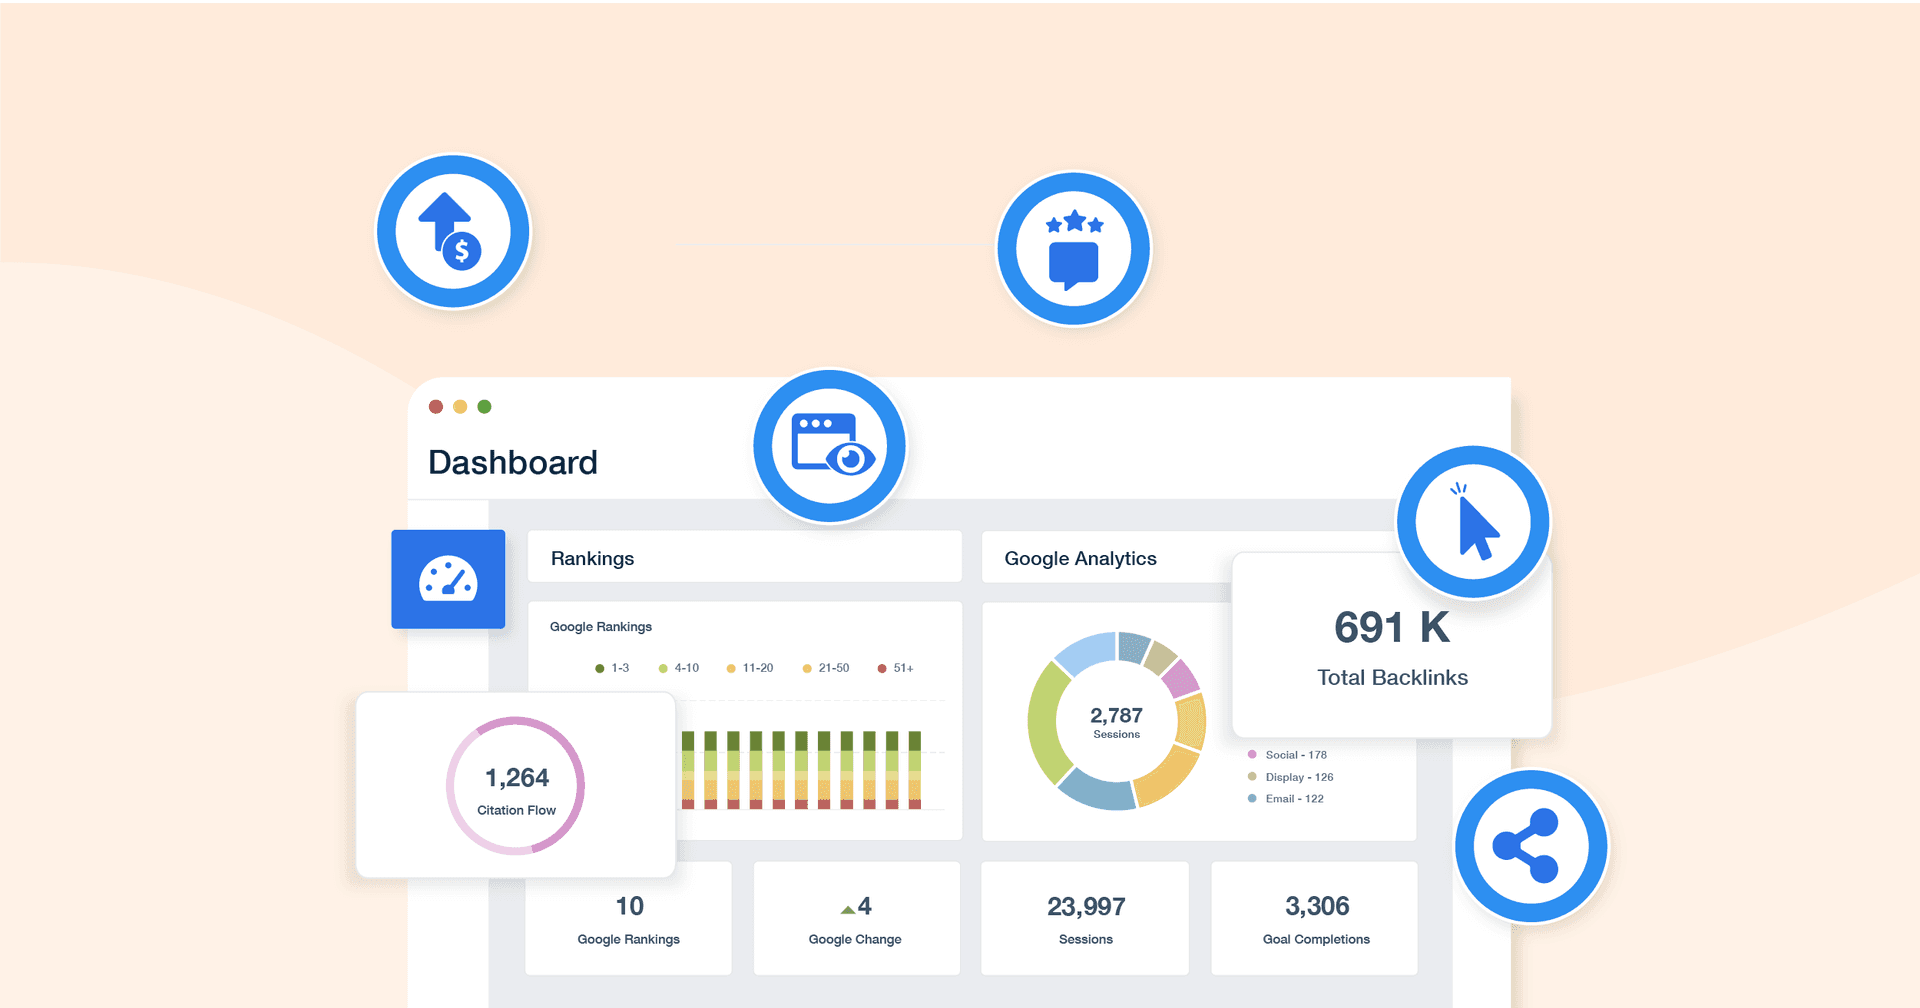
Keep on the pulse of your client’s content marketing KPIs. Track social media engagement, revenue generated, and other critical metrics from one place. Explore AgencyAnalytics today, free for 14 days.
4. Impressions
Impressions show how frequently a piece of content is displayed to users, whether through search engines, social media posts, email previews, or other distribution channels. It reflects how visible the content is, not whether users interact with it.
Rising impressions suggest growing visibility, especially if the content is being picked up by algorithms or widely shared. If impressions are high but engagement is low, it may be a sign that the content isn’t meeting expectations.
5. Clicks
Clicks reflect how many times users chose to engage with a piece of content after it appeared on screen. This may include clicking a blog link, article preview, or CTA button.
An increase in clicks reflects effective messaging, clear value, or strong visual elements that capture attention. Low click numbers could mean that the content isn’t appealing enough.
The only way to assess how your message is perceived is by studying the reactions to your content. When someone clicks, shares, or replies, those are the “facial expressions” and “words” that tell you how well your conversation is going.
Seth Giammanco, Principal, Strategy and Technology, Minds On Design Lab
6. Click-Through Rate (CTR)
Click-through rate (CTR) measures the percentage of users who clicked on a link after seeing it, which is a sign of deeper interest. A high CTR means the content is resonating in some way, usually because of strong headlines, CTAs, or targeting.
A low CTR may indicate that the messaging isn’t compelling enough or that the demographic targeting is off.
User behavior metrics
User behavior metrics reveal how people interact with your client’s content once they land on the website. These insights do more than measure traffic volume—they reveal whether visitors are actively engaging with the content they’re consuming.
Here are the top ones your agency should know.
7. Sessions
A session is a single visit to a website, starting when a user lands on the site and ending after a period of inactivity (usually 30 minutes) or when they leave.
For example, if someone visits a blog post, reads for five minutes, and exits, that counts as one session. If that person returns an hour later, it’s counted as a new session, even though they’re the same user.
A high number of sessions indicates strong interest or repeat engagement, showing that visitors return multiple times. Low session counts may indicate wavering user interest or UX issues (e.g., text-heavy content that lacks headlines or visual breaks).
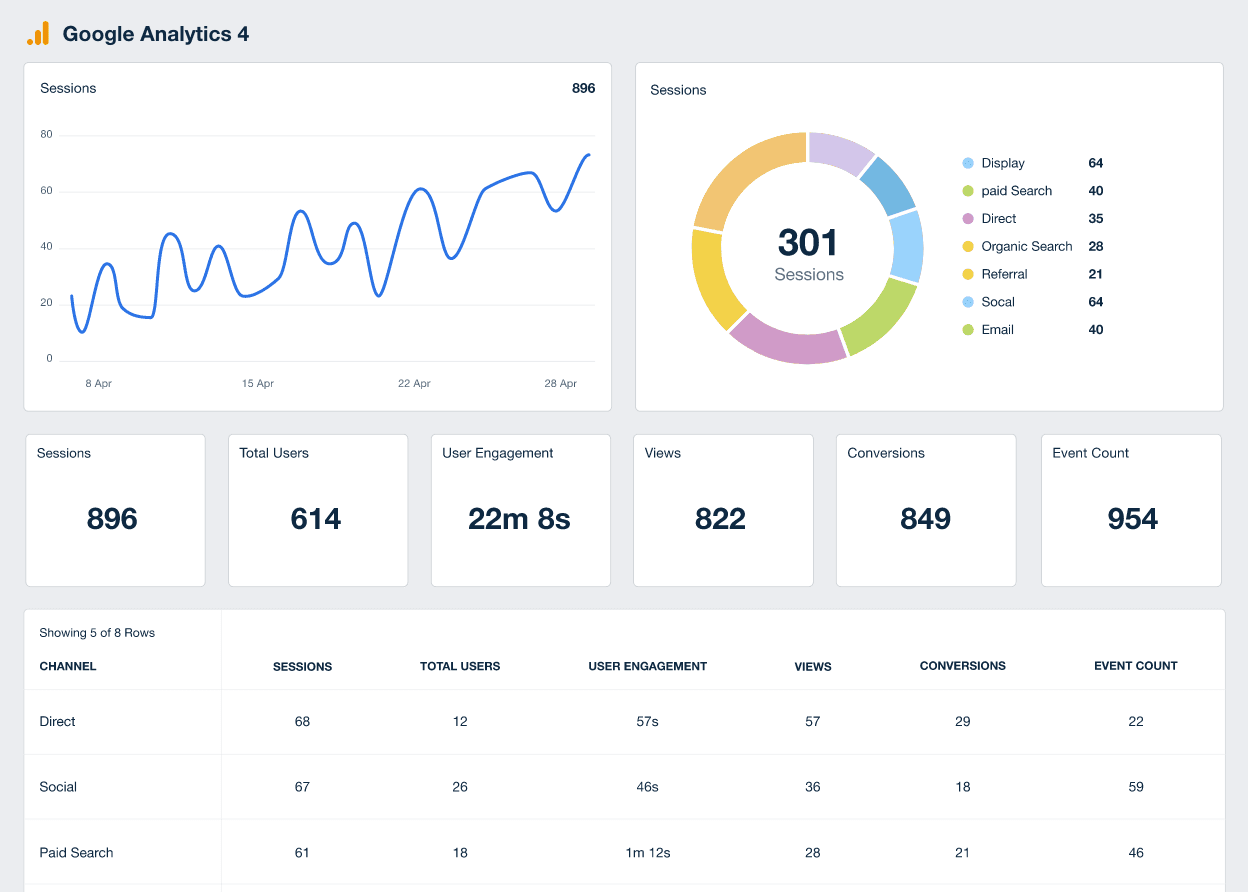
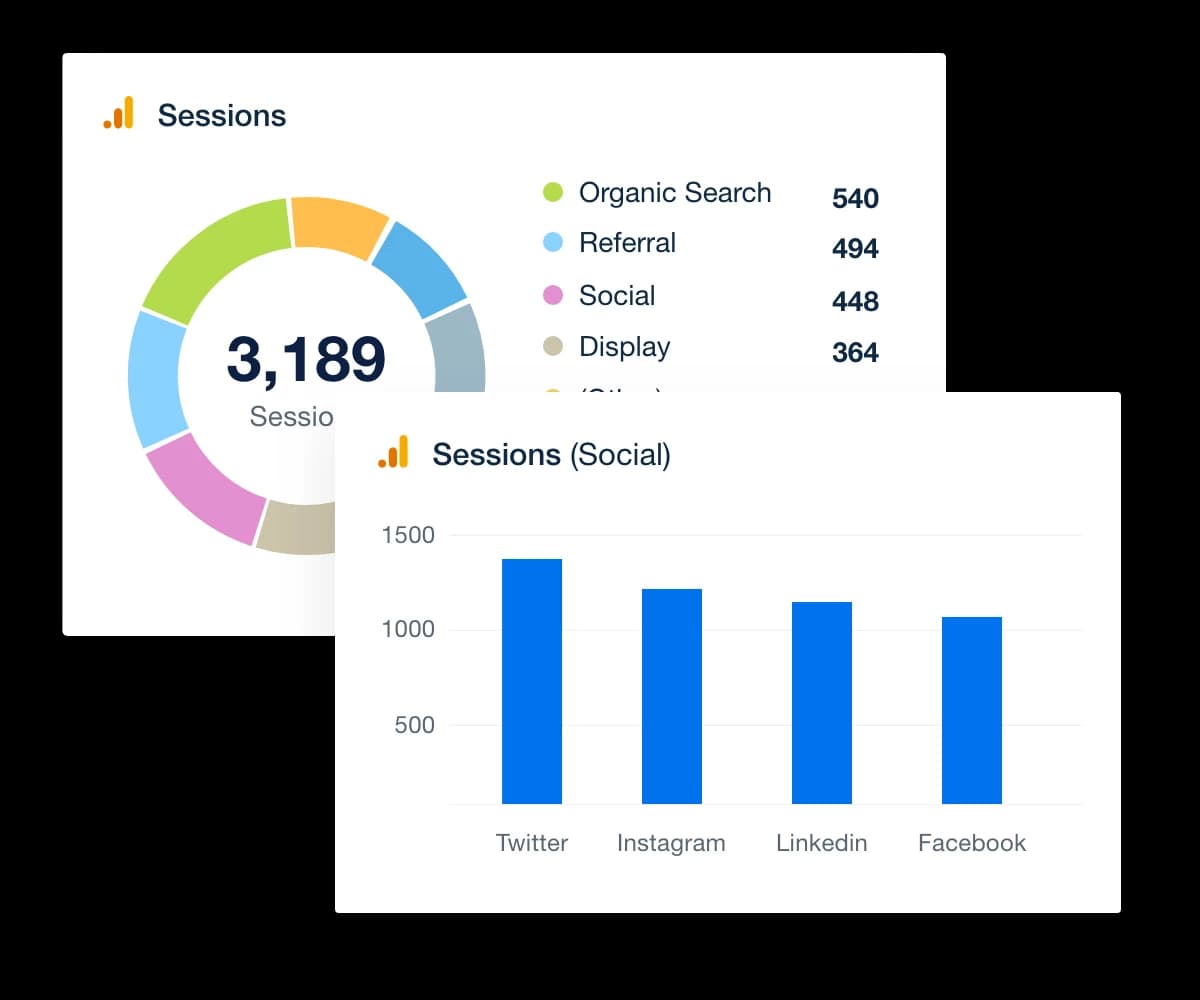
Go beyond standard content creation and show top-performing traffic sources. Use the Google Analytics integration to demonstrate the impact of social media channels, email marketing efforts, and more. Try it in AgencyAnalytics, free for 14 days.
8. Percentage of new sessions
This metric refers to the number of sessions that came from first-time visitors. It shows whether your client’s site is effective at attracting new audiences.
A high percentage points to substantial reach and steady audience growth. A lower percentage isn’t necessarily a bad thing; it means that visitors are returning and that the content is worth revisiting. Both are valuable, depending on the client’s goals around customer retention vs. acquisition.
9. Average time on page
Average time on page shows how long users spend on a specific page, giving insight into how engaging or valuable the content is.
Pages with a higher average time often include dynamic elements like videos, infographics, or detailed explanations. By identifying which pages hold attention the longest, you’ll better understand which content formats keep your client’s audience engaged.
10. Bounce rate
Bounce rate refers to the percentage of sessions where a visitor leaves your client’s site without interacting (i.e., they don’t click, browse further, or stay longer than a few seconds).
A high bounce rate suggests the content didn’t hold the user’s attention or encourage further interaction. Conversely, a low bounce rate means users are staying longer or taking additional actions, like exploring other pages on the website.
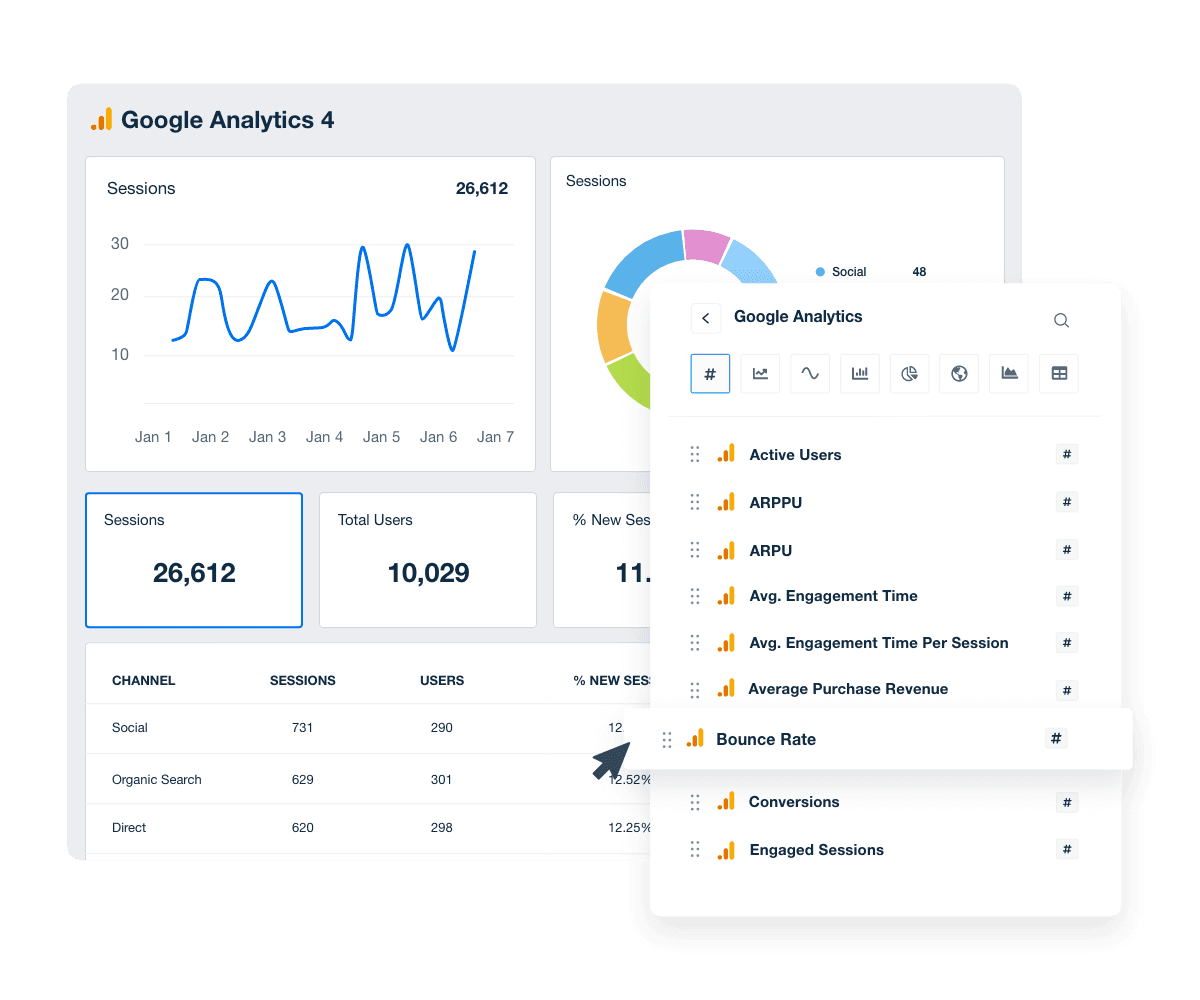
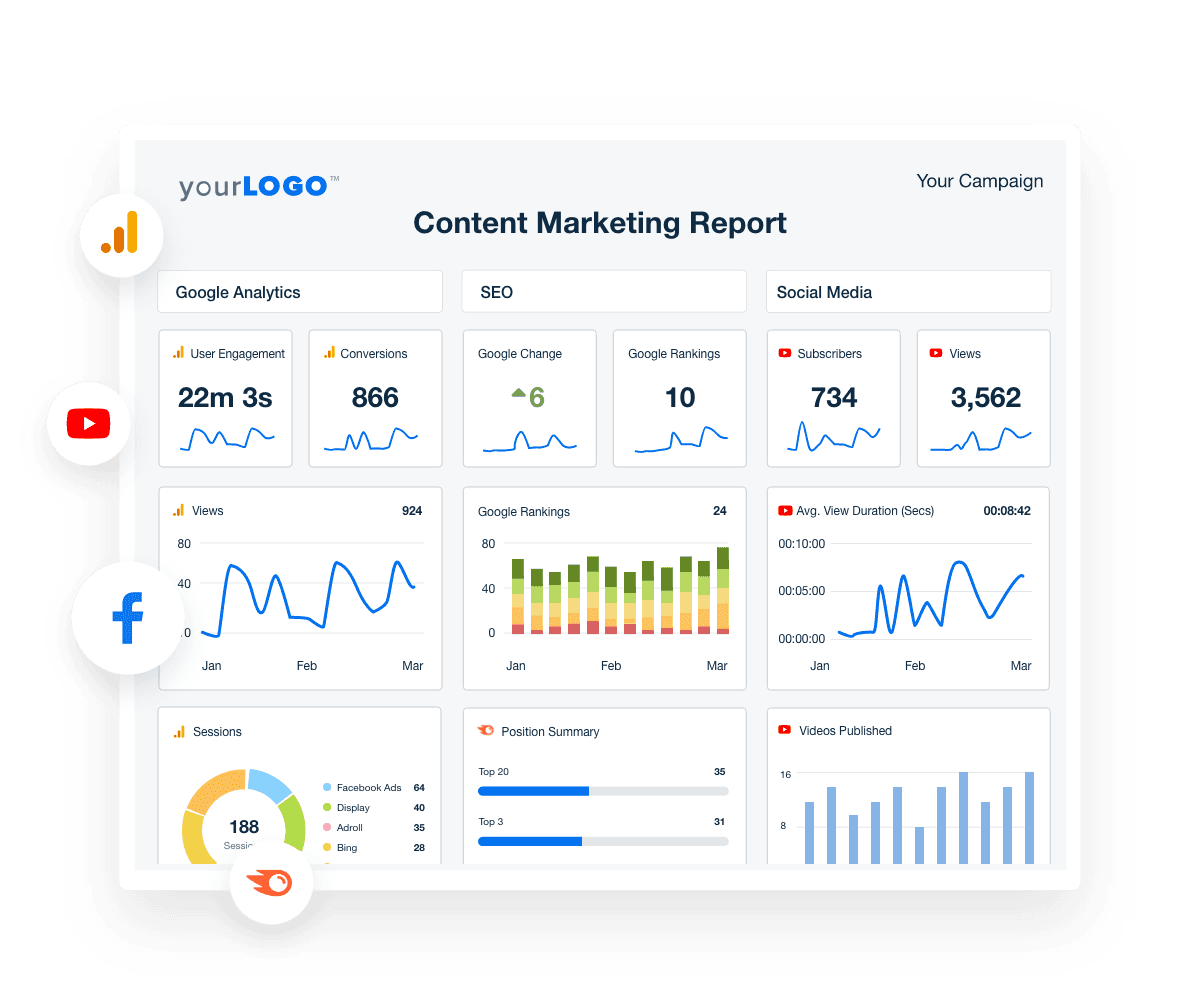
Monitor content marketing performance from a visual, dynamic interface. Build custom dashboards, create white-labeled reports, and share data-driven results. Try AgencyAnalytics, free for 14 days.
11. Pages per session
Pages per session shows how many pages a user typically views during a single website visit. A higher number means users click through to more content, which suggests strong internal linking, relevant recommendations, or user interest.
Conversely, a lower number may indicate weak navigation, unengaging content, or unclear next steps.
12. Scroll depth
Scroll depth tracks how far users move down a page, which helps determine how much content they consume. It’s helpful in assessing longer pages, especially when critical information is included below the fold.
If users consistently scroll through most of the page, it suggests strong interest and engagement. If they drop off early, it may point to weak openings, formatting issues, or important content placed too far down.
SEO metrics
This section covers key metrics that track how well your client’s website attracts and engages traffic from organic search. Use these SEO metrics (not to be confused with SEM metrics) to identify top-performing content, uncover optimization opportunities, and improve organic visibility.
13. Impressions & Click-through rate (CTR)
While we’ve covered these metrics individually, it’s worth looking at them together in an SEO context. To recap, impressions show how often a page appears in search results, while CTR measures the percentage of users who click through after seeing it. When combined, these metrics reveal more insight into page visibility and whether the content grabs attention.
For example, high impressions with low CTR may indicate that the title tag or meta description isn’t interesting enough to drive further action. On the other hand, high CTR with low impressions could suggest the page is performing well for a small number of queries.
In this case, there’s an opportunity to optimize for additional keywords, improve internal linking, or target broader search intent.
14. Average position
Average position shows where a page typically ranks in search engine results for a specific keyword or phrase. The lower the number, the higher the ranking. For example, a position of 1 means the page appears at the top of the organic search results (and in some cases, directly below AI-generated overviews).
Track this metric to evaluate overall search visibility and identify high-performing keywords. If a page ranks consistently high but gets few clicks, it may be a good idea to reoptimize the title or meta description.
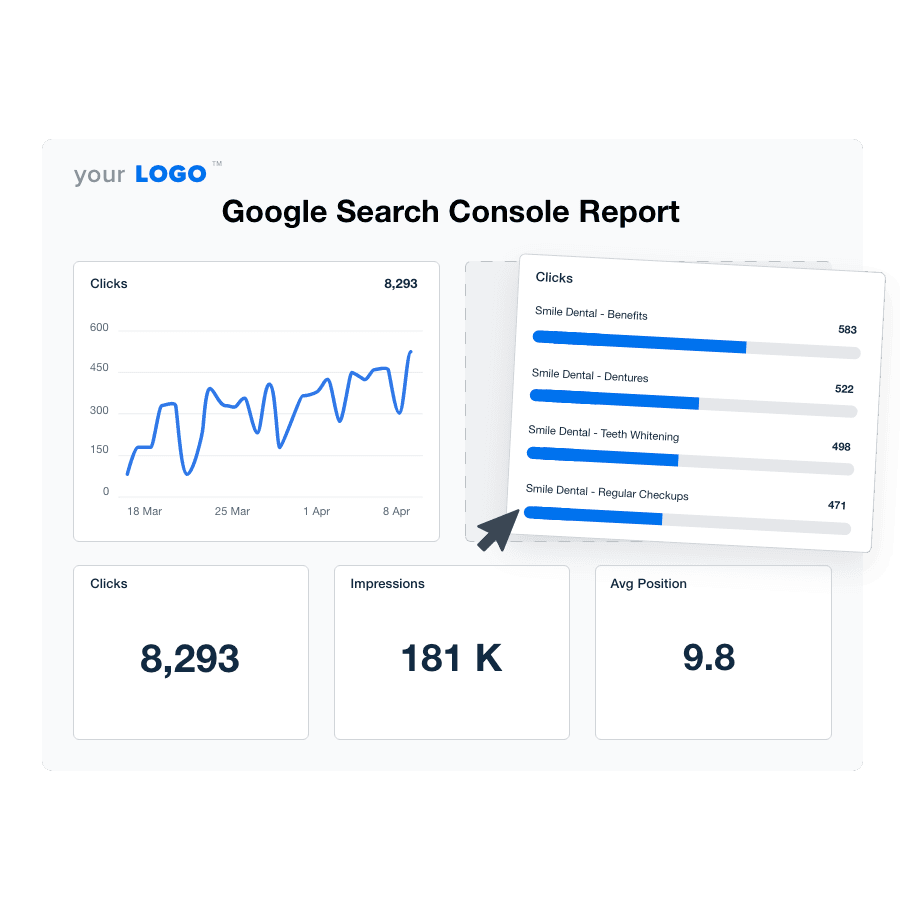
Use the Google Search Console integration to assess the full impact of unpaid search engine results. Monitor search queries, changes to SERP positions, and more–try it in AgencyAnalytics, free for 14 days.
15. Backlinks
Backlinks refer to links from other websites that direct users to your client’s site. Search engines treat these external references as signals of authority and trust, which may positively influence organic search rankings.
Backlinks can be compared to votes, but there’s a catch–the votes are not equal. The more relevant a website is to the target site, the more authority it has, which leads to the vote getting more weight.
Andy Hill, Managing Director, Distribute Digital
A steady flow of high-quality backlinks—especially from relevant or reputable sources— may improve organic visibility over time. A sudden decline, however, may signal lost links, declining trust signals, or a need to ramp up link-building efforts.
Conversion metrics
These insights focus on how content contributes to specific actions, such as filling out contact forms, requesting product demos, or completing online purchases. Here are the most important conversion metrics agencies know about.
16. Leads generated
This metric measures how many users complete a desired action after arriving on your client’s website via organic search. This includes filling out a form, requesting a demo, or signing up for a newsletter. It’s one of the clearest indicators of how well SEO efforts contribute to business goals.
If organic traffic is high but leads are low, it could mean that visitors aren’t finding what they need or your client’s site lacks clear CTAs. In that case, review landing pages and conversion elements to determine whether there are any bottlenecks.
17. Key event completions
Key event completions measure how often users complete high-value actions, such as filling out a form submission or signing up for a free trial. These actions must be manually assigned and configured in Google Analytics, since they’re unique to your client’s goals.
A high number of key event completions shows that users are taking meaningful steps and the content is effectively guiding them toward conversion. On the other hand, low completion rates may indicate barriers in the user journey, such as unclear CTAs or a mismatch between content and user intent.
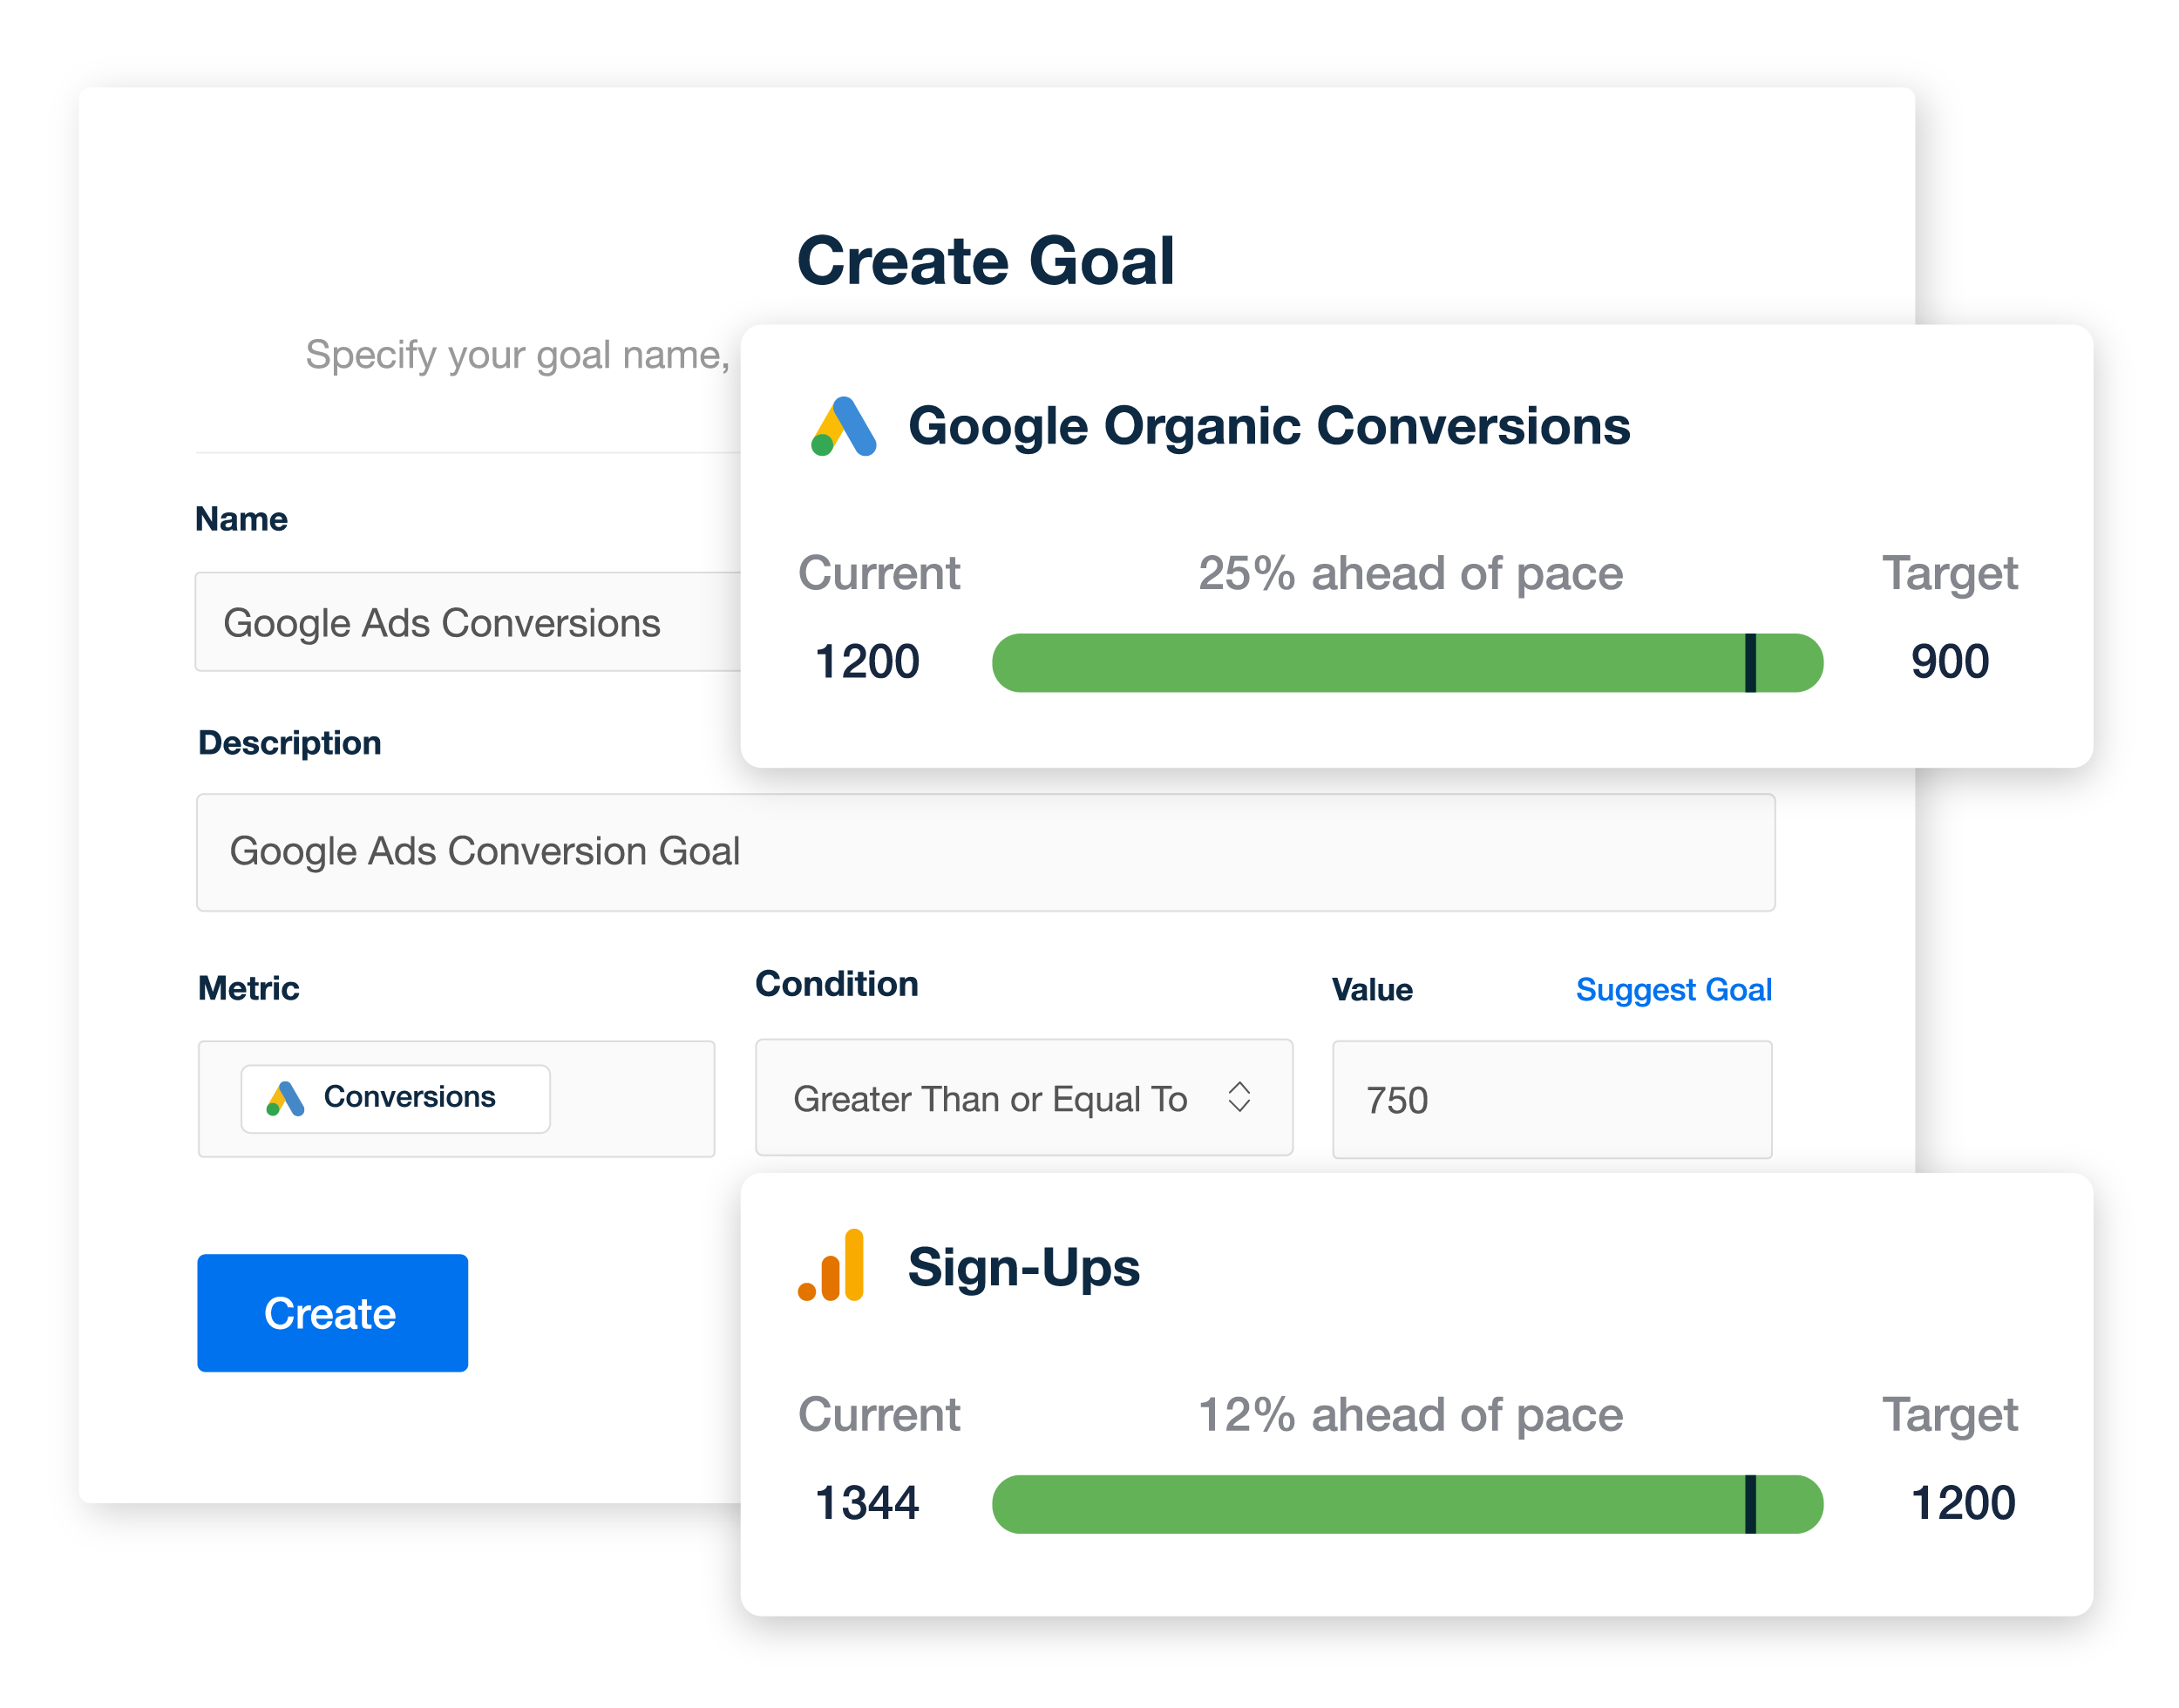
Create goals as unique as your clients. Provide valuable insights that go beyond standard reporting–try this feature in AgencyAnalytics, free for 14 days.
18. Conversion rate
Conversion rate measures the percentage of users who complete a desired action compared to the total number of visitors. It’s often a top-prioritized metric, since clients want to know whether their content drives results.
A high conversion rate means the site is doing a good job guiding visitors toward action. On the other hand, a low rate may signal issues with messaging, design, user experience, or content relevance.
19. Conversion value
Conversion value refers to the monetary figure assigned to specific user actions on your client’s site. It’s useful for estimating financial impact, measuring content marketing ROI, and prioritizing strategies that drive high-value engagement.
For example, a lead generation form might be assigned an approximate value based on average deal size or historical close rate. Tracking this value helps determine which content drives the most business impact and supports informed planning.
20. Page value
Page value estimates how much each page contributes to conversions based on user actions during their visit. It highlights which pages play a key role in the path to conversion, even if they aren’t the final step.
If a specific webpage has a high value, determine why it’s performing well and use it as an opportunity to optimize other pages. For pages with lower values, focus on adding CTAs at strategic points and ensuring an optimal user experience.
21. Sales attribution
Sales attribution identifies which pieces of content contribute to an actual sale or conversion. It helps determine how credit is assigned across the customer journey (e.g., a user may convert after reading a blog post).
By analyzing attribution data, you’ll pinpoint which content types or topics are most influential in driving conversion. This insight supports better planning and leads to a more data-informed content marketing strategy.
Content production & efficiency metrics
These metrics show how much content is being created, whether it’s efficiently produced, and what kind of return it’s delivering. Track these numbers to ensure content efforts stay aligned with budget, resources, and overall marketing goals.
22. Content velocity
Content velocity tracks how frequently new content is published, usually weekly or monthly. For agencies, this metric highlights whether content production is meeting agreed-upon timelines and the client’s expectations.
Maintaining a steady publishing pace is essential for building SEO momentum and keeping audiences engaged. If content velocity slows, it may point to workflow issues, missed deadlines, or resourcing shortages.
23. Cost per content piece
Cost per content piece measures the average expense of producing a single asset, including team hours, tools, and outsourced work. It’s a key metric for assessing agency pricing and whether it’s aligned with actual production costs.
Monitor trends over time to spot rising costs, inefficiencies, or shifts in scope that may not be reflected in your agency’s current pricing. Reviewing it regularly—such as quarterly or when workflows change—ensures your rates stay accurate.
24. ROI per content asset
ROI per content asset measures the return each piece generates relative to what it cost to produce. It helps agencies determine which types of content drive the most value for clients and where future efforts should be focused.
To calculate it, assign a measurable value to each goal (e.g., a lead worth $200), track how many conversions each content piece generates, and compare that value to production costs. For example, if a blog post costs $500 to produce and generates five leads worth $200 each, the ROI is $1,000 profit (or 200%).
Tracking ROI at the asset level helps refine content strategies and show clients which pieces deliver the most results.
How to measure content marketing success
Publishing content is only part of the equation. Your agency must also demonstrate how that content performs, what’s gaining traction, and whether those efforts contribute to the client’s broader goals. A digital marketing analytics software is a fantastic tool for this.
While it’s relatively straightforward to track content performance across a handful of clients, it becomes more challenging as your roster grows. Without the right system in place, you’ll be stuck switching between tools, taking screenshots, or relying on lightweight platforms that glitch as data volume grows.
Instead of settling for something that’s just “good enough”, invest in a solid reporting solution like AgencyAnalytics. No more data crashes or frozen screens! Instead, you’ll have a robust tool that automatically consolidates data across 80+ channels. Easily view content performance from Google Analytics, Matomo, Facebook, Mailchimp, and more!
When you start to layer on 7 to 10 different marketing activities and channels, it becomes very complex to track everything accurately. AgencyAnalytics has been extremely valuable to our company because it allows us to easily report on our results to clients.
Kevin Szypula, COO, Ferocious Media
Summary: Leverage the full potential of content marketing metrics
As we’ve explored, content marketing is more than just publishing a few blog posts and hoping for the best.
It requires mutually agreed-upon goals, a well-defined strategy, and understanding the impact of each piece of content. And without tracking the right metrics, it’s difficult to replicate what’s working or prove value to clients.
To recap, be sure to:
Start with a clear goal: Define what success looks like, whether it’s lead generation, brand awareness, or conversions. Then, build your client’s content strategy around it.
Track performance across the funnel: Monitor a mix of visibility, engagement, and conversion metrics to get a complete picture of what’s working. Then, use this data to replicate engaging content and drive better results.
Evaluate efficiency: Track marketing metrics like content velocity, cost per piece, and ROI per asset to ensure efficient production.
Have a system in place to monitor results: Use a dedicated content marketing dashboard to consolidate performance data from all key platforms. That way, it’s easier to measure impact at scale, save time, and clearly show clients the value of your work.
AgencyAnalytics helps with reporting that scales to any size. It’s simple and easy to add keywords and track progress, compare analytics to previous periods, and integrate email, social, PPC, and Google Analytics into one platform.

Ten Thousand Pots
Ready to stream your clients’ most critical metrics into one central hub? Take the gruntwork out of reporting and use a tool designed to grow with your agency. Explore everything AgencyAnalytics has to offer–it’s free for 14 days.

Written by
Faryal Khan is a multidisciplinary creative with 10+ years of experience in marketing and communications. Drawing on her background in statistics and psychology, she fuses storytelling with data to craft narratives that both inform and inspire.
Read more posts by Faryal KhanSee how 7,000+ marketing agencies help clients win
Free 14-day trial. No credit card required.


