Table of Contents
Table of Contents
- The Value of Social Media Industry Benchmarks
- What To Consider When Using Industry Benchmarks
- Why AgencyAnalytics Benchmarks Stand Out
- Facebook Social Media Engagement Benchmarks
- Instagram Social Media Engagement Benchmarks
- LinkedIn Social Media Engagement Benchmarks
- Pinterest Social Media Engagement Benchmarks
- How To Interpret These Social Media Industry Benchmarks
- 5 Tips for Using These Social Media Benchmarks in Your Client Reports
- Turn Social Media Benchmarks Into Actionable Insights
7,000+ agencies have ditched manual reports. You can too.
Free 14-Day TrialQUICK SUMMARY:
Social media benchmarks provide valuable insights into how content typically performs across major social media platforms. Measuring success against these industry standards helps agencies evaluate campaign success, optimize social media strategies, and set clear client expectations. Learn how to interpret social media benchmarks for metrics like impressions, engagement, reach, and followers to refine your social media strategy and drive better results for clients.
Social media is a core part of any marketing strategy, but to measure real success, agencies need more than just vanity metrics—they need benchmark data for context.
Simply saying, “Engagement looks good this month!” isn’t enough. To truly evaluate social media marketing efforts, you need to compare key metrics like engagement rate, follower growth, impressions, reach, and clicks against industry standards.
That’s where social media industry benchmarks come in. By analyzing averages across social platforms, you gain visibility into how clients' results stack up, see the bigger picture, and get the insight you need to fine-tune strategies for improved social media performance.
Curious if your campaigns are hitting the mark?
This post breaks down the most important social media engagement benchmarks across major social platforms to give you a snapshot of what top-performing marketing agencies are achieving.
With data from over 150,000 marketing agency campaigns, consider this your cheat sheet for measuring social media success.
The Value of Social Media Industry Benchmarks
Social media industry benchmarks serve as a critical reference point for evaluating social media performance across platforms. Without a clear understanding of industry standards, it’s difficult to determine whether engagement rates, follower growth rates, or other key metrics indicate success or underperformance.
Analyzing social media benchmarks equips your agency with the insights it needs to refine strategies, guide conversations with clients, and strengthen relationships.
Let’s explore the benefits of using social media benchmarks further:
The Role of Social Media Benchmarks in Measuring Progress
Social media benchmarks offer more than a performance snapshot—they provide a framework for long-term growth. By tracking benchmarks over time, agencies identify trends, spot areas for improvement, and refine strategies to ensure sustainable success.
Rather than relying on short-term campaign results, benchmarks help agencies measure real progress and adjust their approach to stay competitive. Using industry-specific data ensures that improvements align with broader industry trends rather than isolated fluctuations, allowing for more strategic decision-making.
How Social Media Benchmarks Strengthen Client Relationships
Clients need clear, data-backed insights to determine whether their investment in social media services is driving results. Without industry benchmarks, it’s challenging to demonstrate an agency’s value or provide meaningful context for performance metrics.
Integrating benchmarks into client reporting offers a direct comparison against competitors and industry leaders, reinforcing the effectiveness of an agency’s strategy. Setting realistic expectations ensures clients understand what’s achievable. This transparency builds trust and positions the agency as a strategic partner in the client’s long-term success.
How Social Media Benchmarks Drive Campaign Success
Social media benchmarks provide actionable insights that help refine strategy, optimize content, and improve overall campaign performance.
Here’s how leveraging social media benchmarks helps your agency shape more effective marketing strategies:
Identify High-Performing Content: Benchmark analysis highlights which types of content consistently drive a healthy social media engagement rate and conversions, allowing agencies to double down on what works.
Recognize Underperformance Early: Falling below key social media benchmarks signals the need for content adjustments, audience targeting refinements, or shifts in messaging strategy.
Refine Content and Posting Strategies: Benchmark data helps determine the best-performing content formats, optimal posting frequency, and platform-specific trends to enhance reach and interaction.
Improve Paid and Organic Strategies: Comparing organic engagement rates with industry norms reveals opportunities for paid amplification, while ad benchmarks help agencies optimize campaign budgets and maximize ROI.
Set Realistic, Industry-Aligned KPIs: Using social media industry benchmarks as a baseline ensures that performance goals are achievable, measurable, and aligned with industry expectations.
What To Consider When Using Industry Benchmarks
Now that we understand the value of industry benchmarks, what are some best practices for working with them effectively? Here are a few things to keep in mind:
Understanding Average vs. Median Social Media Benchmarks
When analyzing social media benchmarks, it’s important to distinguish between average and median values.
Average Benchmarks: These calculate the total sum of values divided by the number of data points. Averages sometimes get skewed by outliers, such as a viral post or a poorly performing campaign, leading to unrealistic expectations.
Median Benchmarks: These represent the middle value. Medians provide a more accurate reflection of typical performance, eliminating the impact of extreme highs or lows.
Common Misconceptions About Social Media Industry Benchmarks
It’s helpful to consider these common myths before making any decisions based on benchmarks:
Industry Benchmarks Define Success: Benchmarks provide context, but success is determined by a brand’s specific social media goals, audience, and strategy. A campaign might easily exceed benchmarks but fail to achieve its intended outcome.
One-Size-Fits-All: Engagement rates, follower growth, and ad performance vary significantly by platform, industry, and audience type. A strong benchmark for one sector might be below average in another.
Benchmarking Once is Enough: Social media trends evolve rapidly. Regular marketing benchmarking ensures strategies stay relevant and adapt to user behavior and market changes.
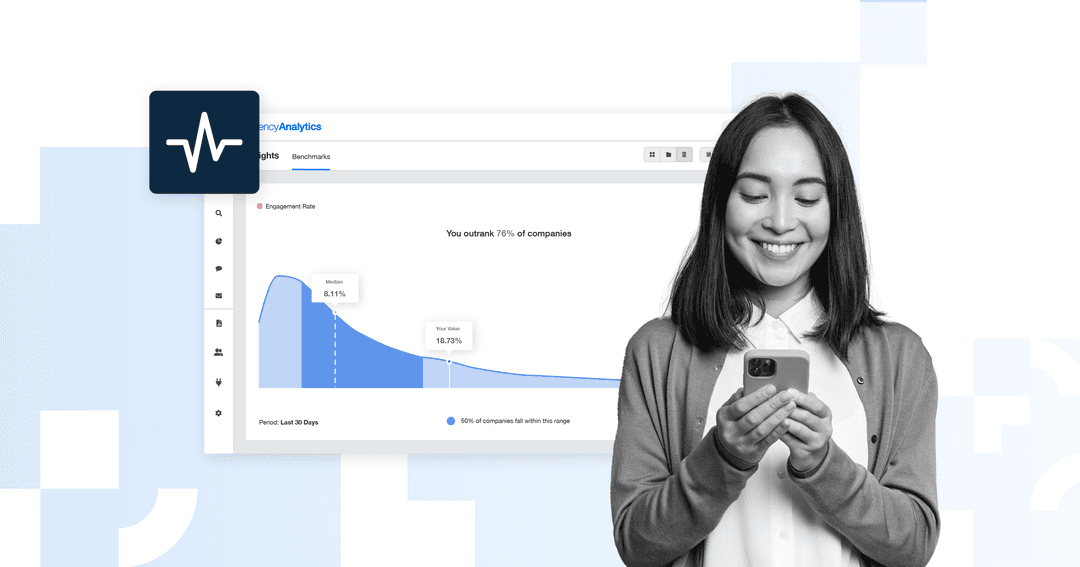
AgencyAnalytics uses median values in benchmark reporting to give you a more accurate reflection of real campaign performance.
Why AgencyAnalytics Benchmarks Stand Out
Many reports pull from broad, general industry trends, making it difficult for agencies to find benchmarks that truly reflect their needs.
AgencyAnalytics benchmarks are derived from thousands of professional marketing agency campaigns, ensuring the data represents real-world performance from businesses actively managing client accounts.
Unlike generic benchmarks that blend data from influencers, individual brands, or inconsistent sources, AgencyAnalytics provides benchmarks that:
Reflect Actual Agency-Managed Campaigns: Not skewed by individual brand anomalies.
Offer Platform-Specific Insights: Ensuring accurate comparisons across social networks.
Prioritize Real-World Marketing Strategies: helping agencies make informed, actionable decisions.
Leveraging industry benchmarks helps you ensure that your strategies are based on data that represents professional performance standards, not just broad industry trends.
Facebook Social Media Engagement Benchmarks
Facebook remains the largest social media platform, with nearly 3 billion monthly active users. Despite competition from visual-first platforms like Instagram and Pinterest, Facebook continues to drive high engagement and reach, particularly through video content and community-driven interactions.
Unlike Instagram, where engagement rates tend to be higher due to its visual appeal, Facebook often sees stronger audience growth and post impressions, thanks to its diverse content formats and robust ad capabilities.
The following benchmarks provide a realistic snapshot of how marketing agencies are performing on Facebook.
Average Facebook Followers
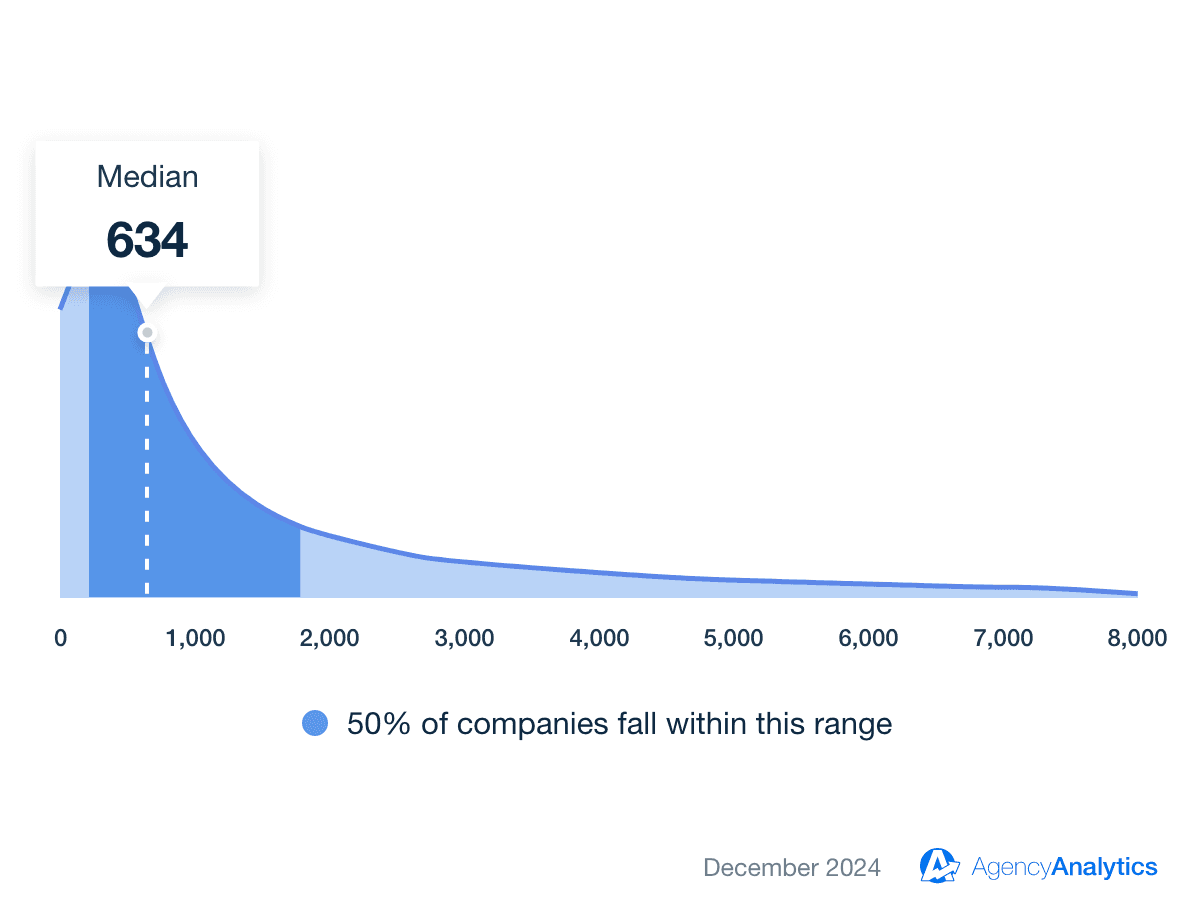
The median number of followers for Facebook pages is 634 followers.
Facebook followers represent the number of users who have chosen to receive updates from a page in their feed. Unlike page likes, followers specifically opt into seeing future content.
A median of 634 followers suggests that most Facebook pages have a modest but engaged audience. Growing a following on Facebook often requires a mix of organic content, paid promotions, and consistent engagement strategies.
If follower count is low, prioritize community-building efforts such as engaging with comments, running interactive posts (polls, Q&As), and encouraging existing followers to invite others. Consider running targeted Facebook ads to attract the right audience.
Average Facebook Likes
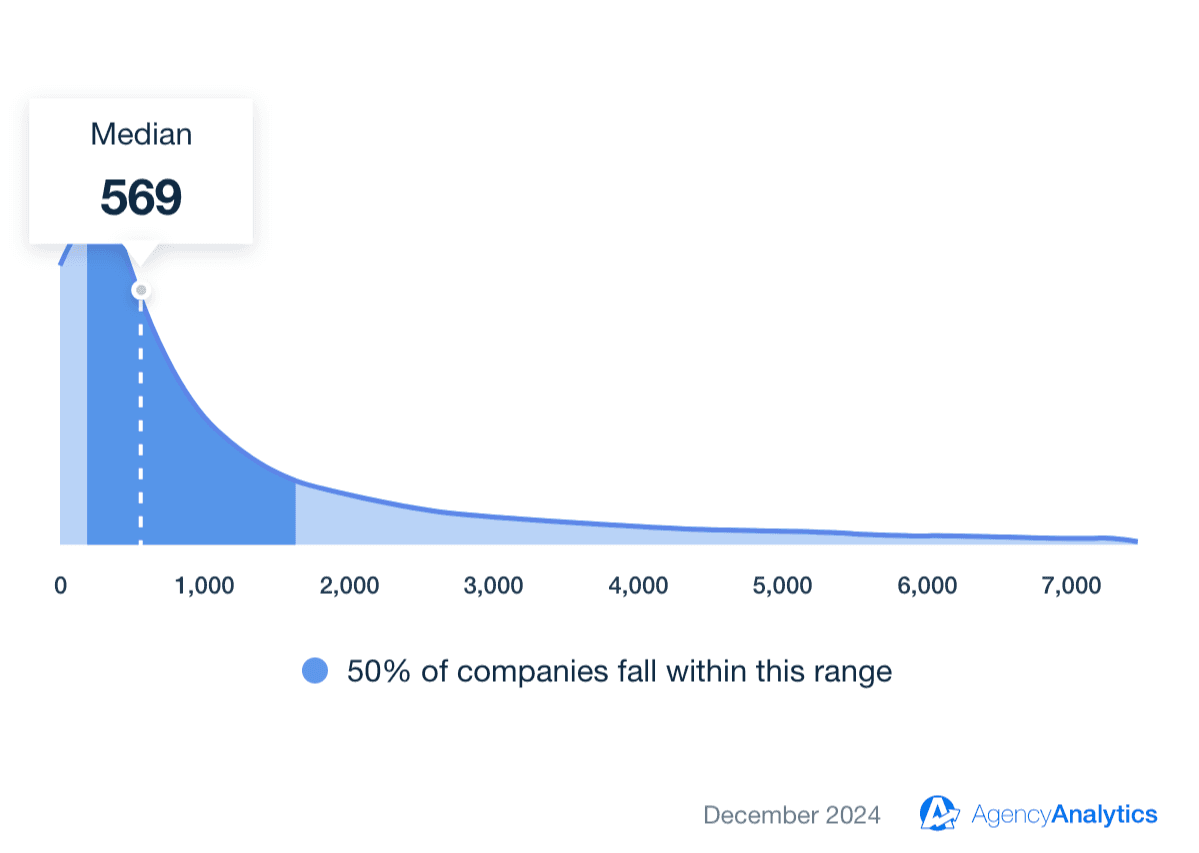
The median number of Facebook likes on posts is 569.
Facebook post likes indicate how many users have reacted positively to a post by clicking the "Like" button or using other reactions (such as love, wow, or haha). With a median of 569 likes per post, strong content engagement is achievable. Posts with high likes typically include engaging visuals, relatable content, and interactive elements such as polls or questions.
Low post likes may indicate that content isn’t resonating. Test different formats, such as carousel posts, behind-the-scenes content, or relatable memes. Analyze which types of posts get the most engagement and double down on what works.
Average Facebook Post Engagement Rate
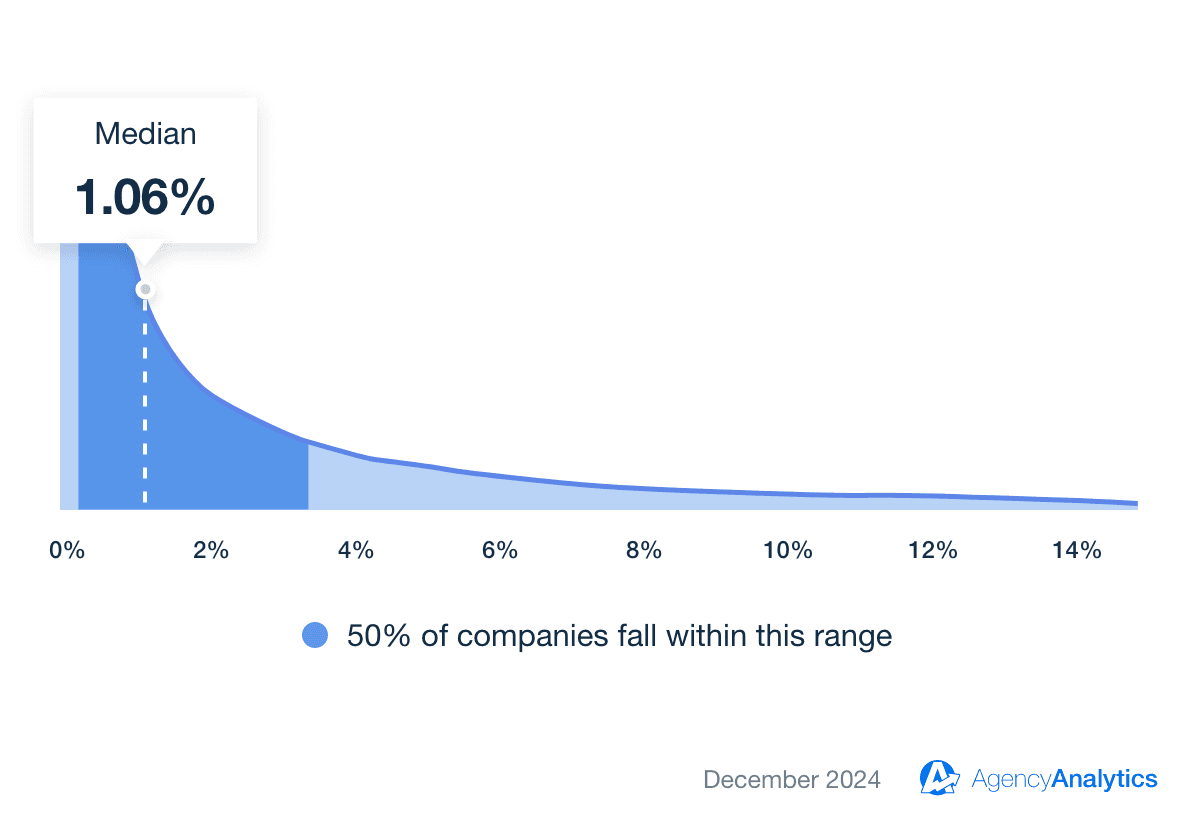
The median engagement rate for Facebook posts is 1.06%.
Engagement rate measures interactions (likes, comments, shares, clicks) divided by total reach or impressions. At 1.06%, Facebook's engagement rate is lower than Instagram's, reflecting Facebook's algorithm prioritization and content saturation. Interactive posts like polls, videos, and live streams boost engagement.
If engagement is low, focus on conversation-driven posts—ask direct questions, run contests, or use interactive elements like live videos. Posting at optimal times and encouraging user-generated content also helps improve engagement.
Average Facebook Post Impressions
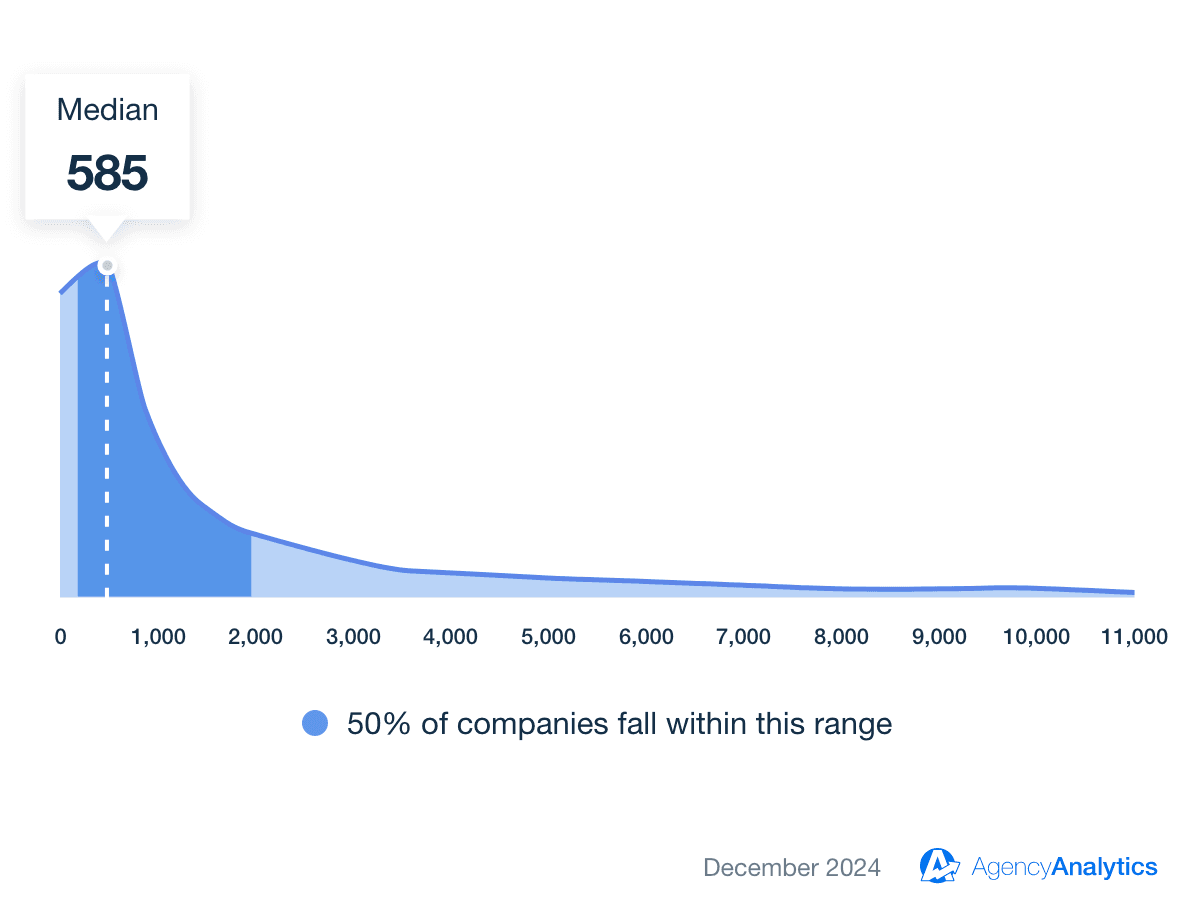
The median number of impressions for Facebook posts is 585.
Post impressions refer to the total number of times a post appears in users’ feeds, regardless of whether they interact with it. Due to algorithm changes, organic reach on Facebook is sometimes challenging. Agencies often use boosted posts and targeted ads to increase visibility.
Low impressions indicate that the content isn’t appearing in feeds. To expand reach, try repurposing high-performing posts, optimizing post timing, and experimenting with boosted posts.
Average Facebook Post Engagement
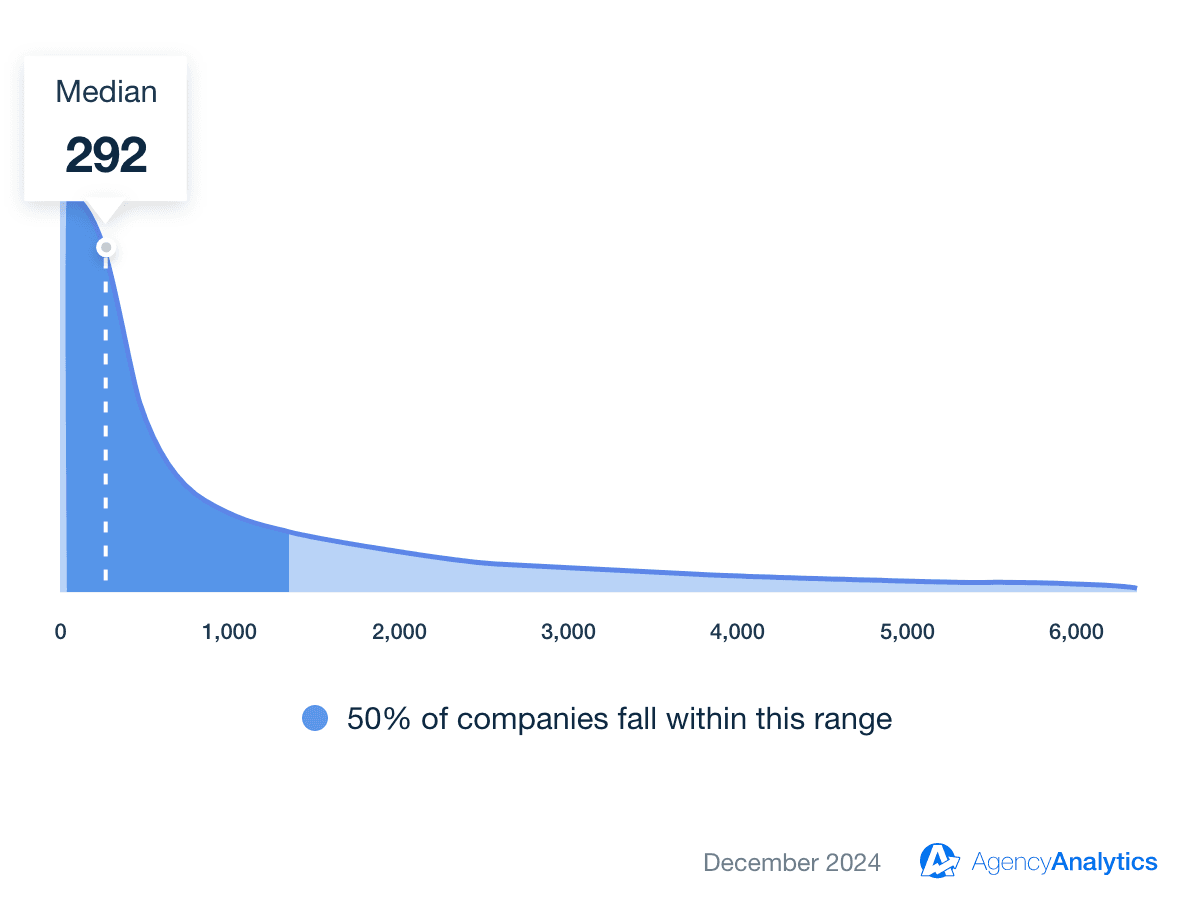
The median number of Facebook post engagements is 292.
Engagements include likes, shares, comments, and clicks on a post. A median of 292 engagements per post highlights the importance of compelling, shareable content. Posts that invite conversation (e.g., asking for opinions or using CTAs) tend to increase engagement.
Add strong calls to action (CTAs) in captions to encourage deeper engagement. Experiment with longer-form storytelling and behind-the-scenes content to spark conversations.
Average Facebook Video Views
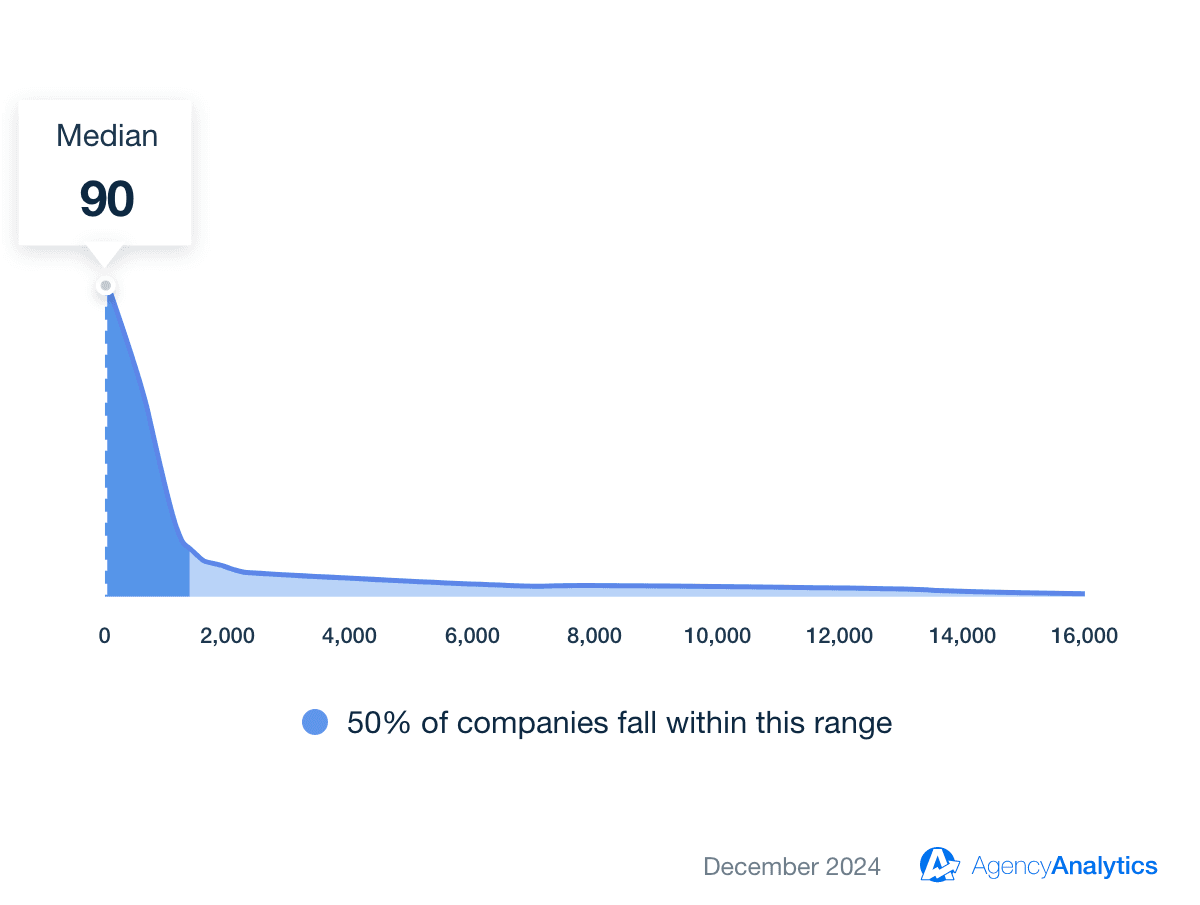
The median number of Facebook video views is 90.
Facebook counts a video view after a user watches at least three seconds of a video. While Facebook’s algorithm favors video content, capturing audience attention is key to driving views and engagement.
If video views are low, optimize the first three seconds with compelling visuals and hooks. Add captions since many users watch without sound, and test shorter, more dynamic formats.
Instagram Social Media Engagement Benchmarks
Instagram boasts over 2 billion monthly active users, making it the third most popular social network globally, following Facebook and YouTube. Despite Facebook's larger user base, Instagram often delivers higher engagement rates. This higher engagement is attributed to Instagram's visual-centric platform and its younger, more active user demographic.
The following benchmarks provide a realistic snapshot of how marketing agencies are performing on Instagram.
Average Instagram Followers
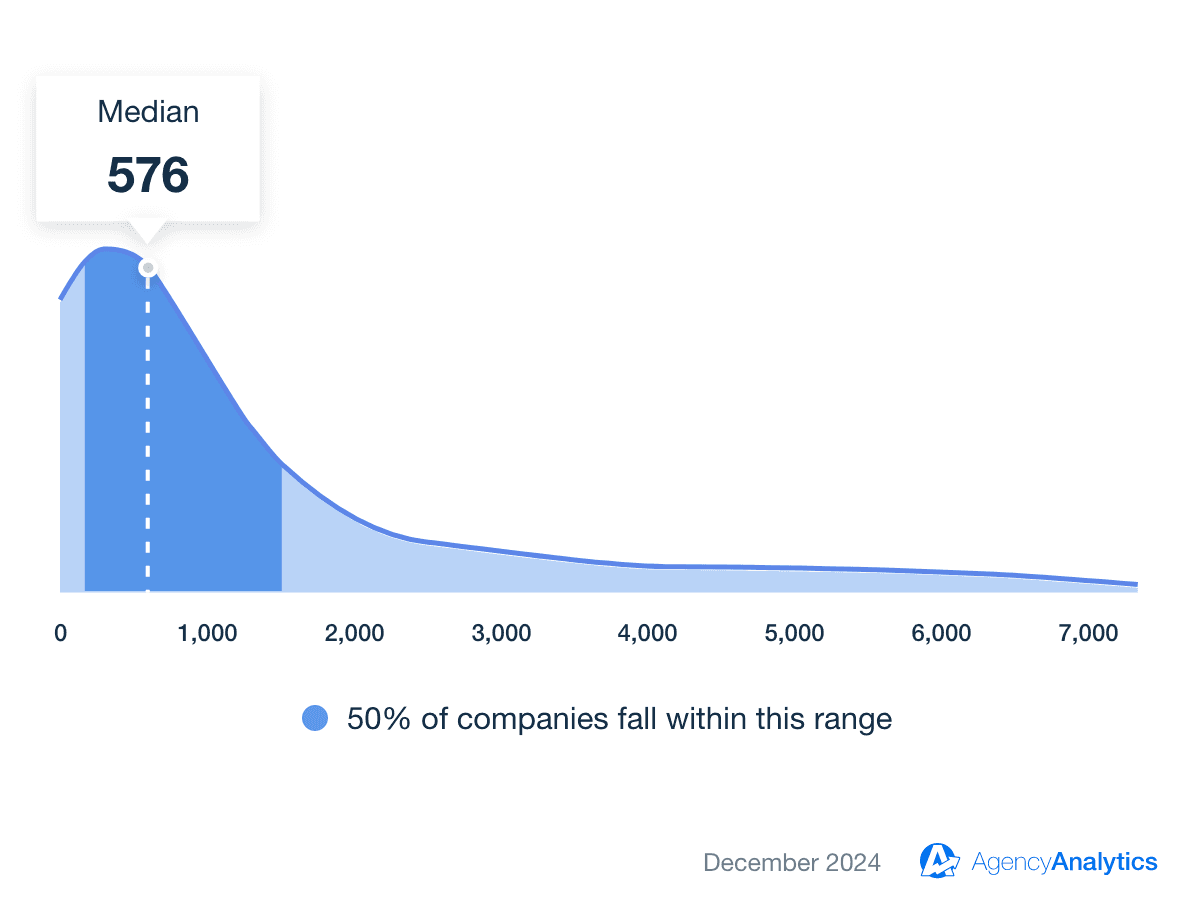
The median number of Instagram followers is 576.
Instagram followers are users who subscribe to an account’s updates and posts.
A median of 576 followers suggests that while organic growth is achievable, consistent engagement and content strategy are required to scale.
If follower count is below the benchmark, post more Reels and Stories, as Instagram’s algorithm prioritizes these formats. Engage with followers through polls, Q&As, and interactive stickers to boost retention.
Average Instagram Engagement Rate
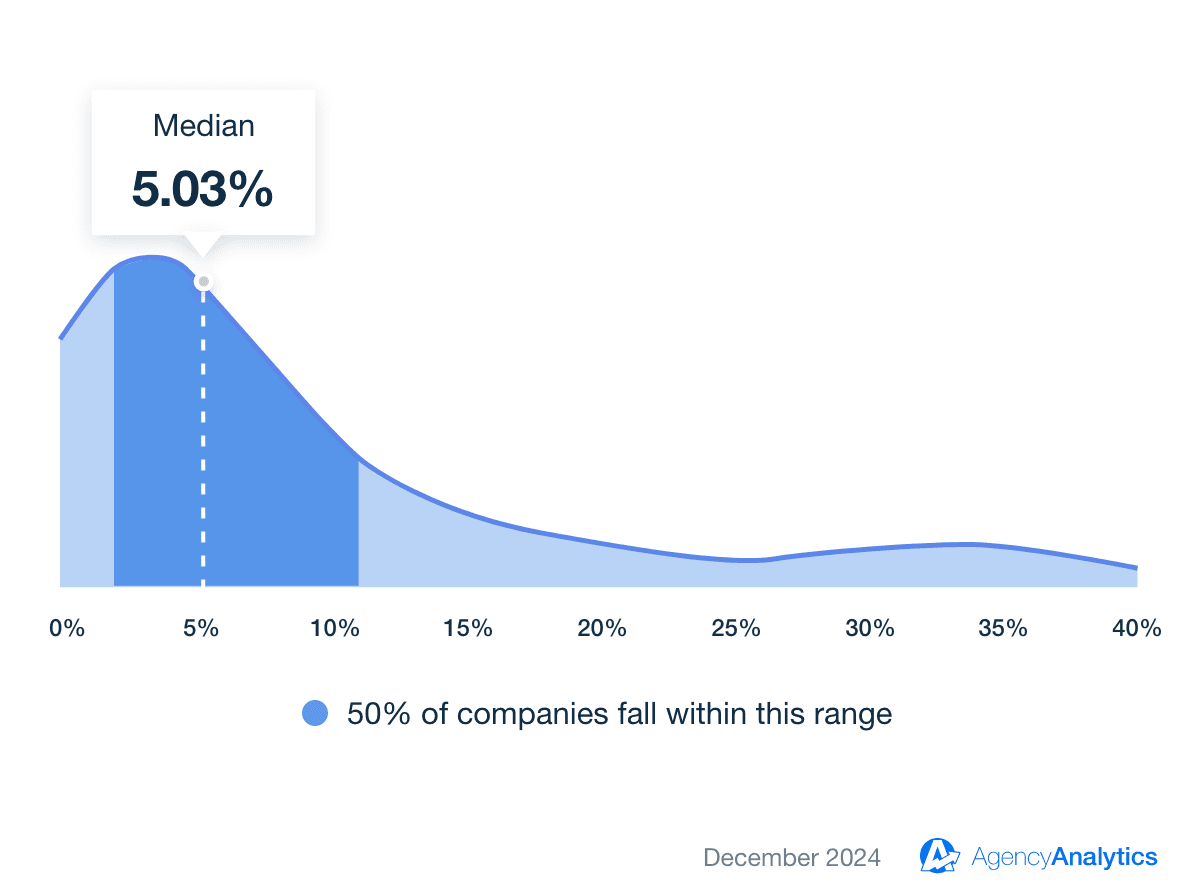
The median engagement rate for Instagram is 5.03%.
Engagement rate measures likes, comments, shares, and saves divided by total reach.
At 5.03%, Instagram's engagement rate is significantly higher than Facebook's, making it an ideal platform for audience interaction and brand storytelling.
If engagement is low, improve caption storytelling and focus on high-quality visuals. To encourage more interactions, try leveraging carousel posts and “saveable” educational content.
Average Instagram Post Impressions
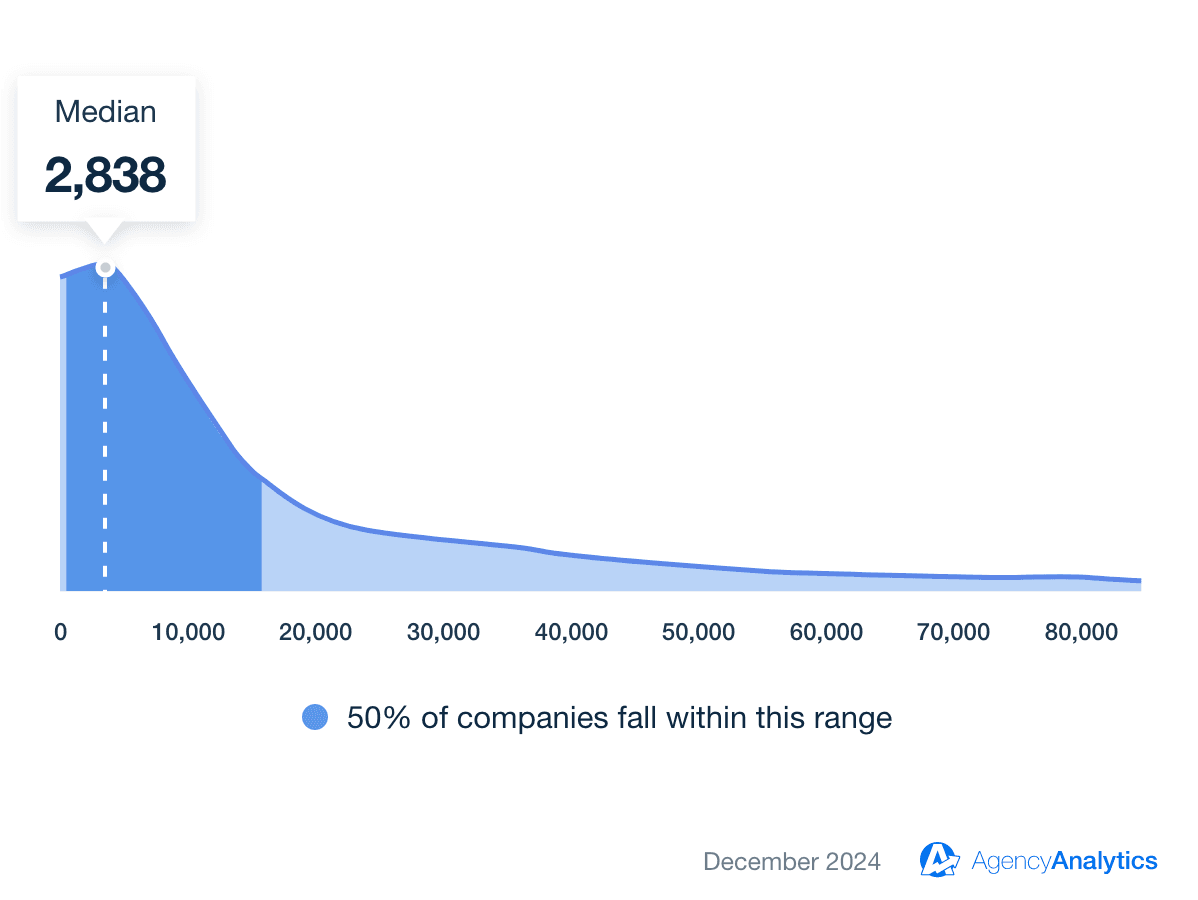
The median number of Instagram post impressions is 2,838.
Impressions track how often a post appears in users’ feeds. With a median of 2,838 impressions, Instagram’s algorithm prioritizes consistent posting, hashtag strategies, and high-quality visuals to maintain visibility.
To improve impressions, optimize hashtag strategies, ensure consistent posting, and leverage Instagram’s Explore and Reels features to maximize discoverability.
Average Instagram Post Reach
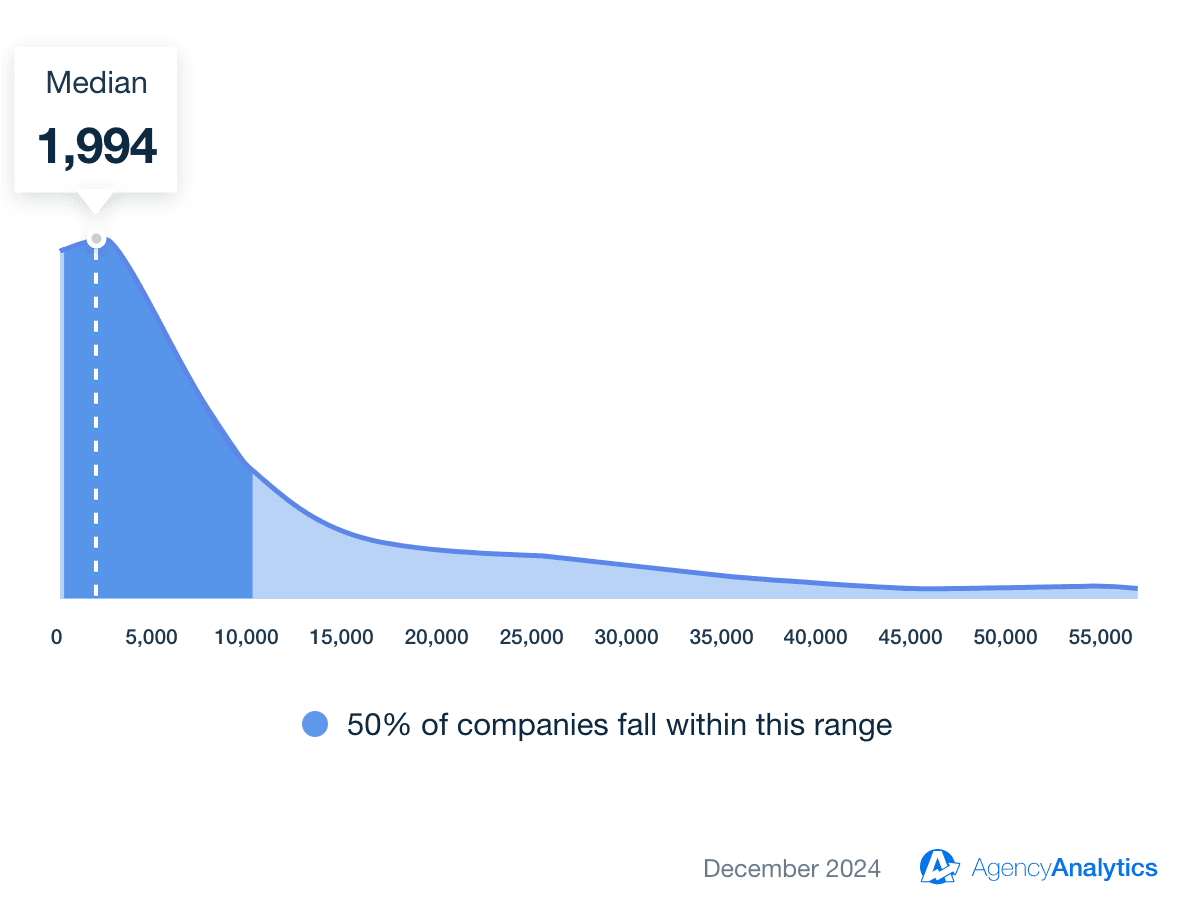
The median reach for Instagram posts is 1,994.
Reach measures the number of unique users who see a post. A reach of 1,994 users per post suggests that Instagram’s discoverability is strong, especially when leveraging trending hashtags and engaging content.
To expand reach, collaborate with other accounts in your niche, use location tags, and experiment with Instagram Live sessions to appear in followers’ notifications.
LinkedIn Social Media Engagement Benchmarks
LinkedIn, the premier professional networking platform, has experienced significant growth, boasting over 1.15 billion monthly active users worldwide as of 2024.
This positions LinkedIn as a vital channel for B2B marketers aiming to engage with a professional audience. While LinkedIn's engagement rates are generally lower than those on platforms like Facebook and Instagram, they surpass those on other platforms like Twitter, highlighting LinkedIn's unique role in professional networking.
The following benchmarks offer a realistic snapshot of how campaigns are performing on LinkedIn.
Average LinkedIn Followers
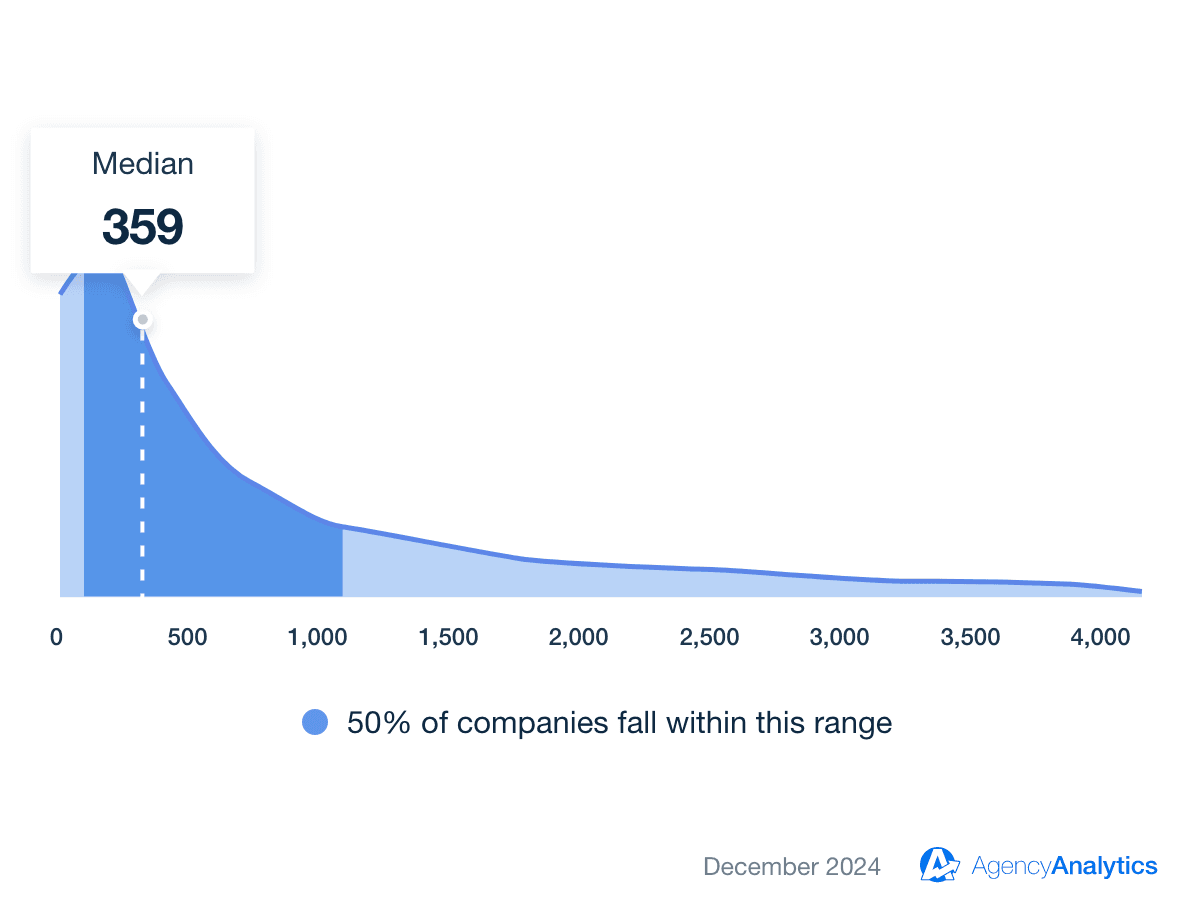
The median number of LinkedIn followers is 359.
LinkedIn followers represent professionals and companies following an account for updates. With a median of 359 followers, LinkedIn growth tends to be slower but more targeted, making content quality and thought leadership posts crucial.
If LinkedIn followers are below the benchmark, share thought leadership content, industry insights, and personal stories. Actively engage in LinkedIn groups and comment on industry leaders' posts.
Average LinkedIn Clicks
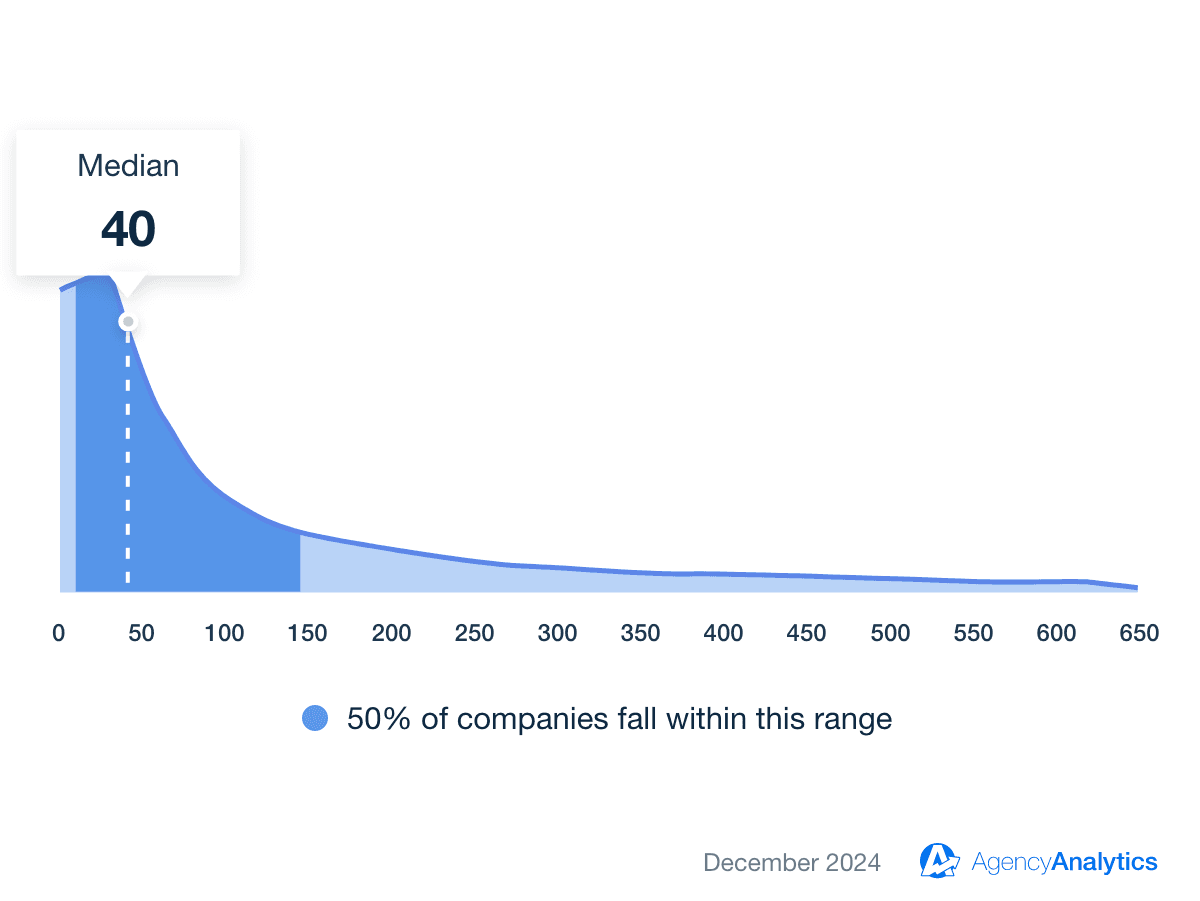
The median number of LinkedIn post clicks is 40.
Clicks measure how often users click on a post, link, or company page. With 40 clicks per post, LinkedIn’s audience is highly engaged with valuable, industry-specific content, making it ideal for B2B marketing.
If click-through rates are low, use attention-grabbing headlines and clear CTAs. Articles, case studies, and data-driven insights tend to drive more clicks.
Average LinkedIn Post Impressions
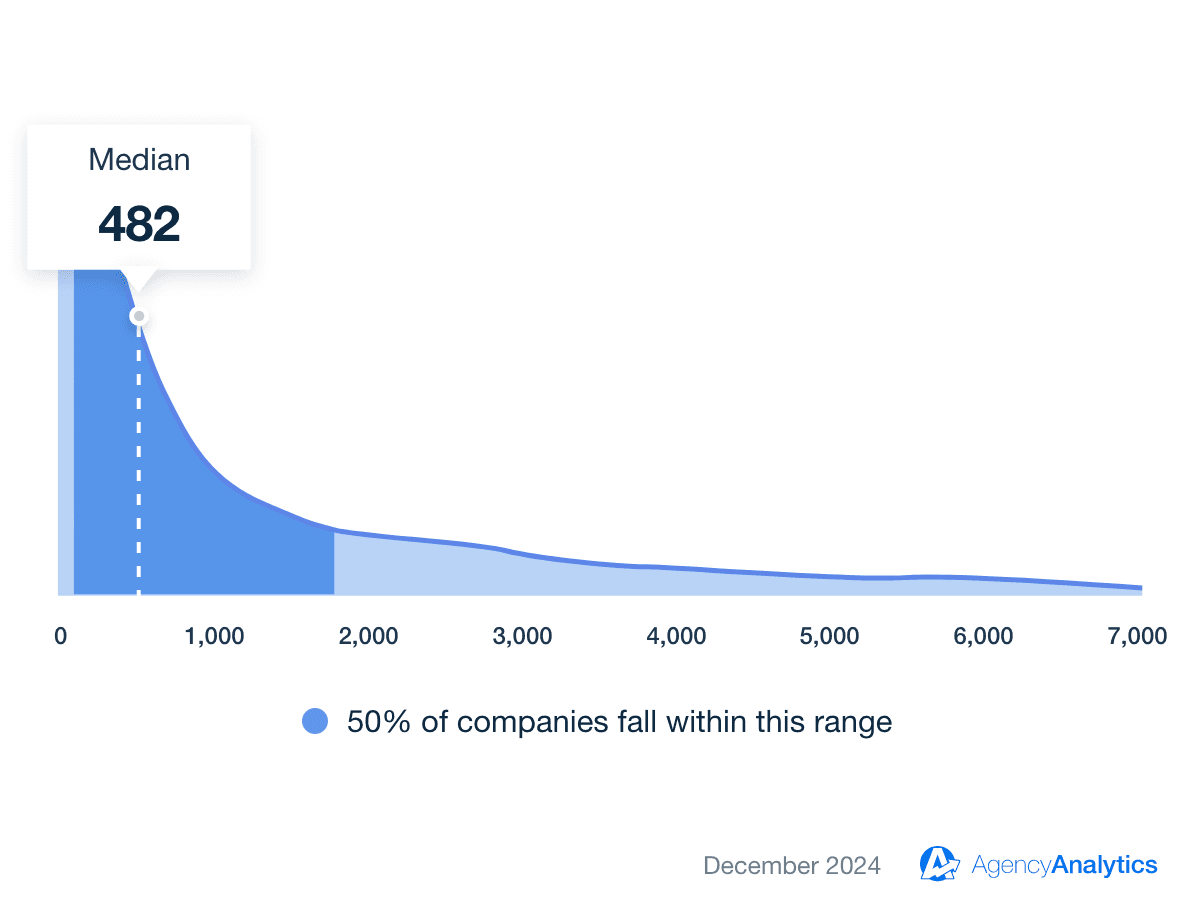
The median number of LinkedIn post impressions is 482.
Impressions track how many times a post appears in users’ feeds. At 482 impressions per post, LinkedIn’s organic reach rewards informative, shareable content that sparks discussion.
To improve impressions, post during peak engagement times, tag relevant people or brands, and experiment with LinkedIn Polls and Documents for higher visibility.
Average LinkedIn Social Actions
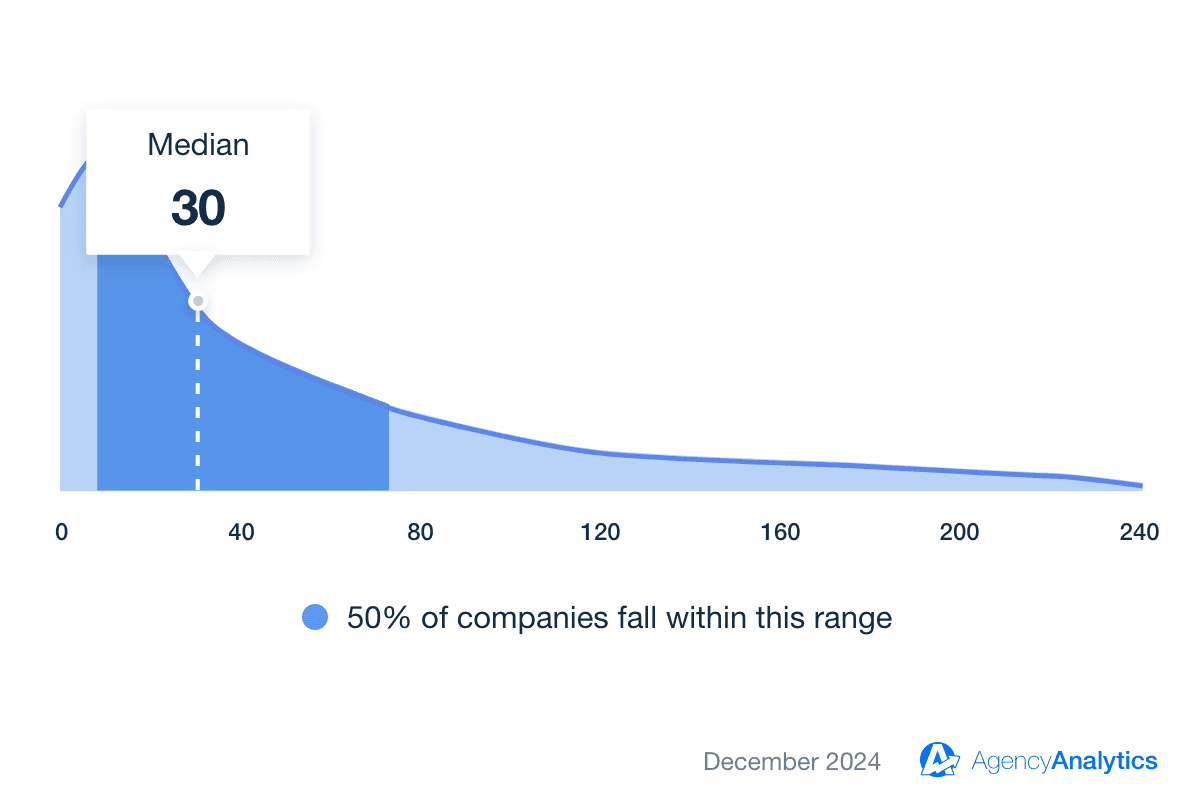
The median number of LinkedIn social actions on a post is 30.
Social actions include likes, shares, and comments on LinkedIn posts. A median of 30 interactions per post highlights the value of professional engagement, with insightful content driving stronger networking.
If posts aren’t getting enough likes or shares, encourage engagement by posing industry questions, participating in trending conversations, and using carousel-style content to increase interactions.
Pinterest Social Media Engagement Benchmarks
Pinterest, the visual discovery platform, reached 537 million monthly active users. in the third quarter of 2024, marking a steady growth trajectory. While its user base is smaller than Facebook's and Instagram's, Pinterest distinguishes itself with a unique audience seeking inspiration and ideas, leading to higher intent engagement. Notably, Pinterest trends gain traction 20% faster (Upbeat) than on other platforms during their initial six months, indicating a highly engaged user base.
The following benchmarks provide a realistic snapshot of how marketing agencies are performing on Pinterest.
Average Pinterest Followers
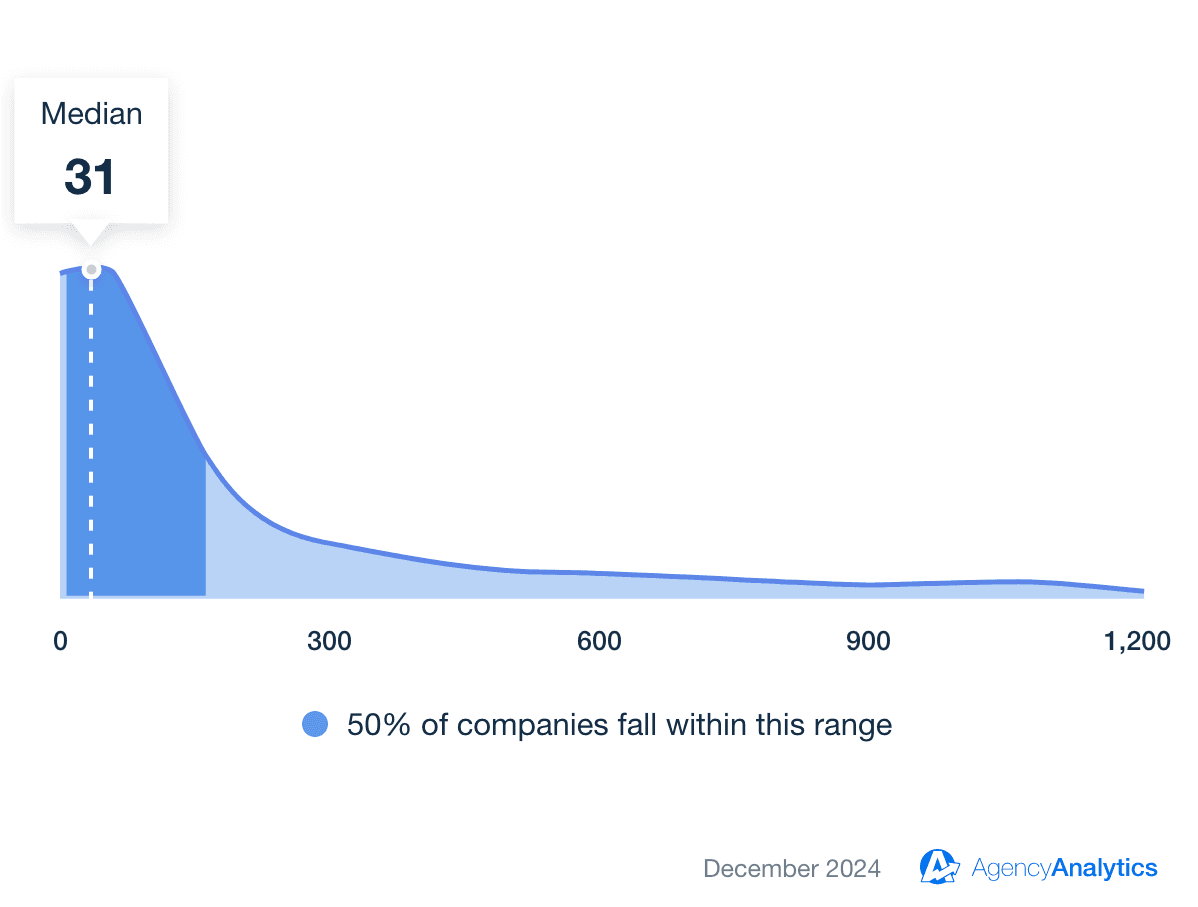
The median number of Pinterest followers is 31.
Pinterest followers are users who subscribe to an account’s Pins and boards. With a median of 31 followers, Pinterest’s success is less dependent on follower count and more on content discoverability through search and recommendations.
If follower count is low, create high-quality, keyword-rich Pins and engage with similar boards. Focus on evergreen, visually appealing content that remains relevant over time.
Average Pinterest Engagements
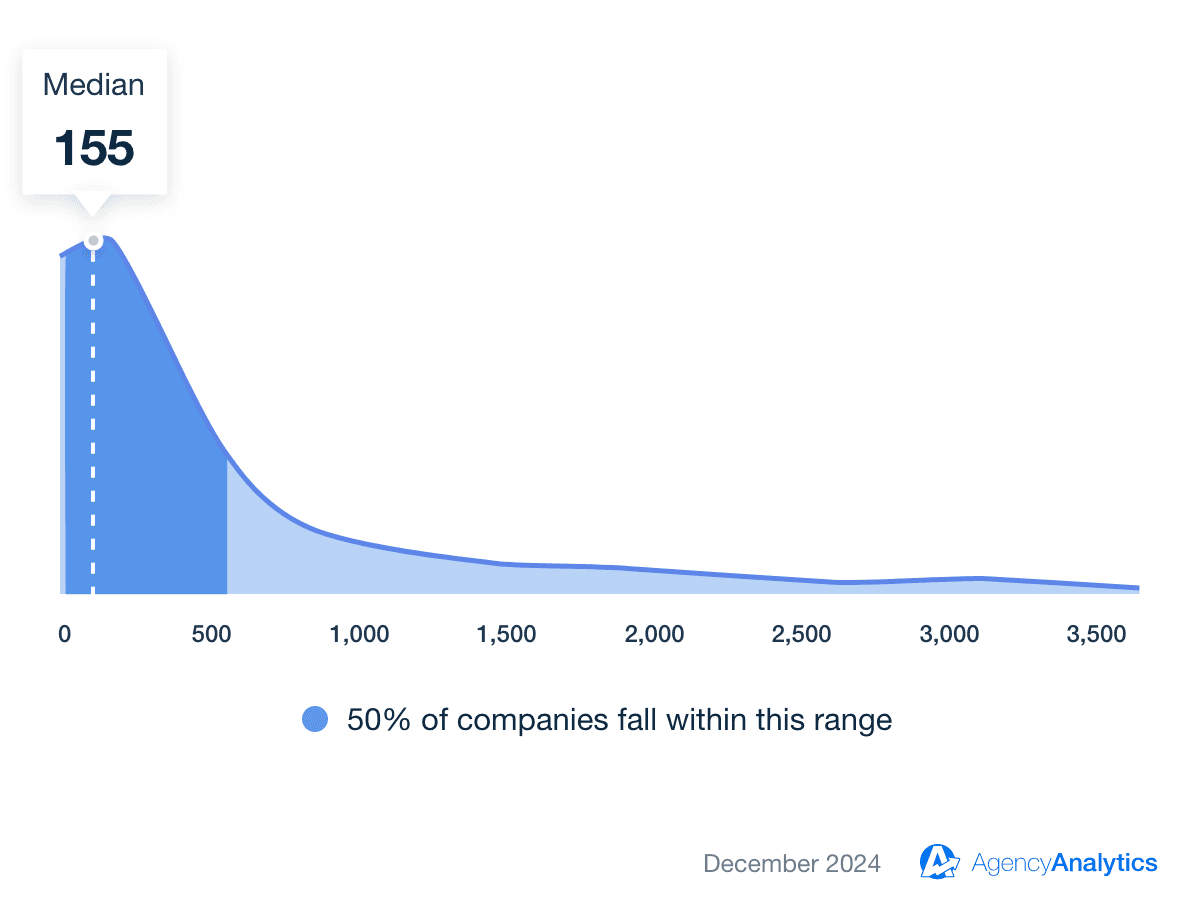
The median number of Pinterest engagements is 155.
Engagements on Pinterest include saves, clicks, and reactions to a Pin. With 155 engagements per Pin, high-quality visuals and keyword optimization are essential to maximizing visibility and interaction.
To boost engagement, use text overlays on images, optimize Pins for Pinterest SEO, and link Pins to valuable resources like blog posts or lead magnets.
Average Pinterest Impressions
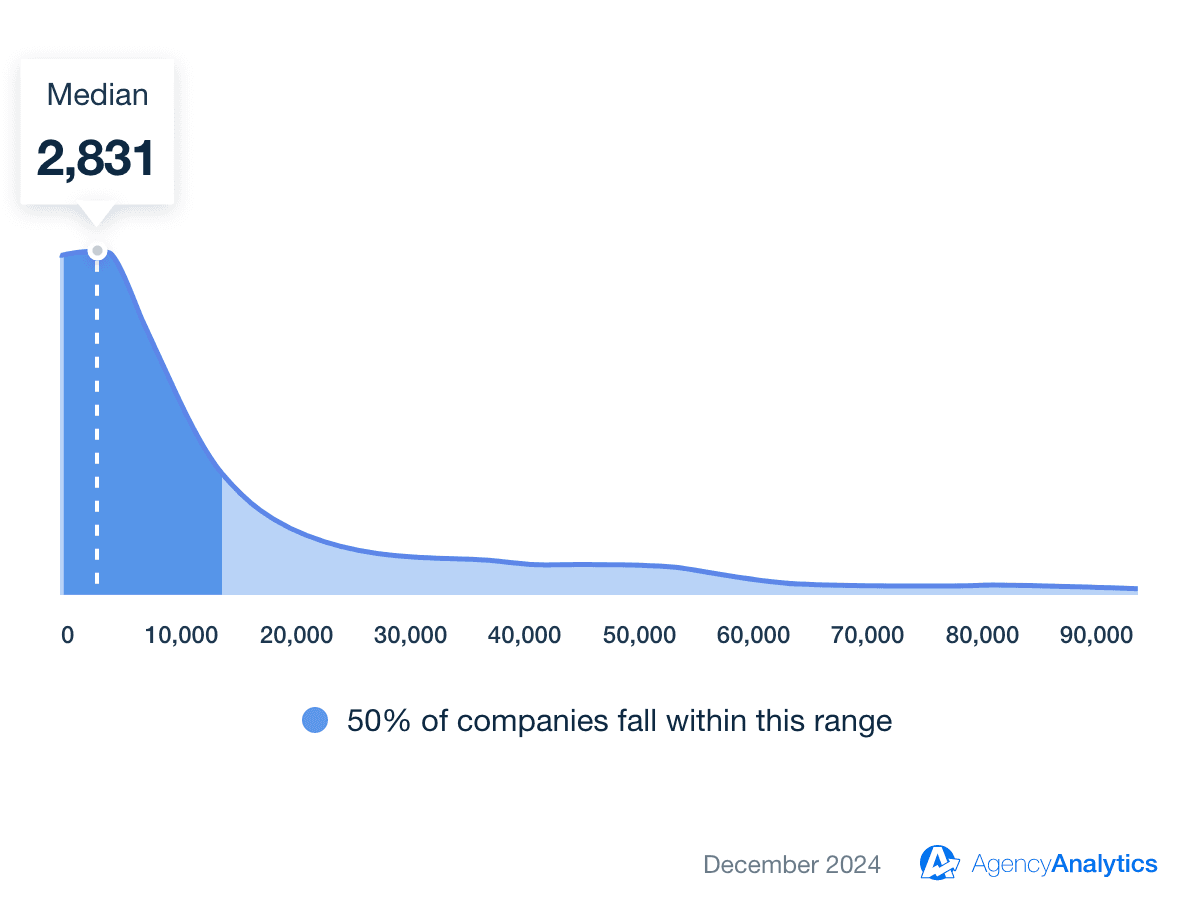
The median number of Pinterest impressions is 2,831.
Impressions measure how often Pins appear in users’ feeds or search results. A median of 2,831 impressions per Pin reflects Pinterest’s strong search-based discoverability, making it an excellent platform for evergreen content.
If impressions are below average, pin content consistently (multiple times per week) and use rich Pins that provide additional details directly in search results.
Average Pinterest Saves
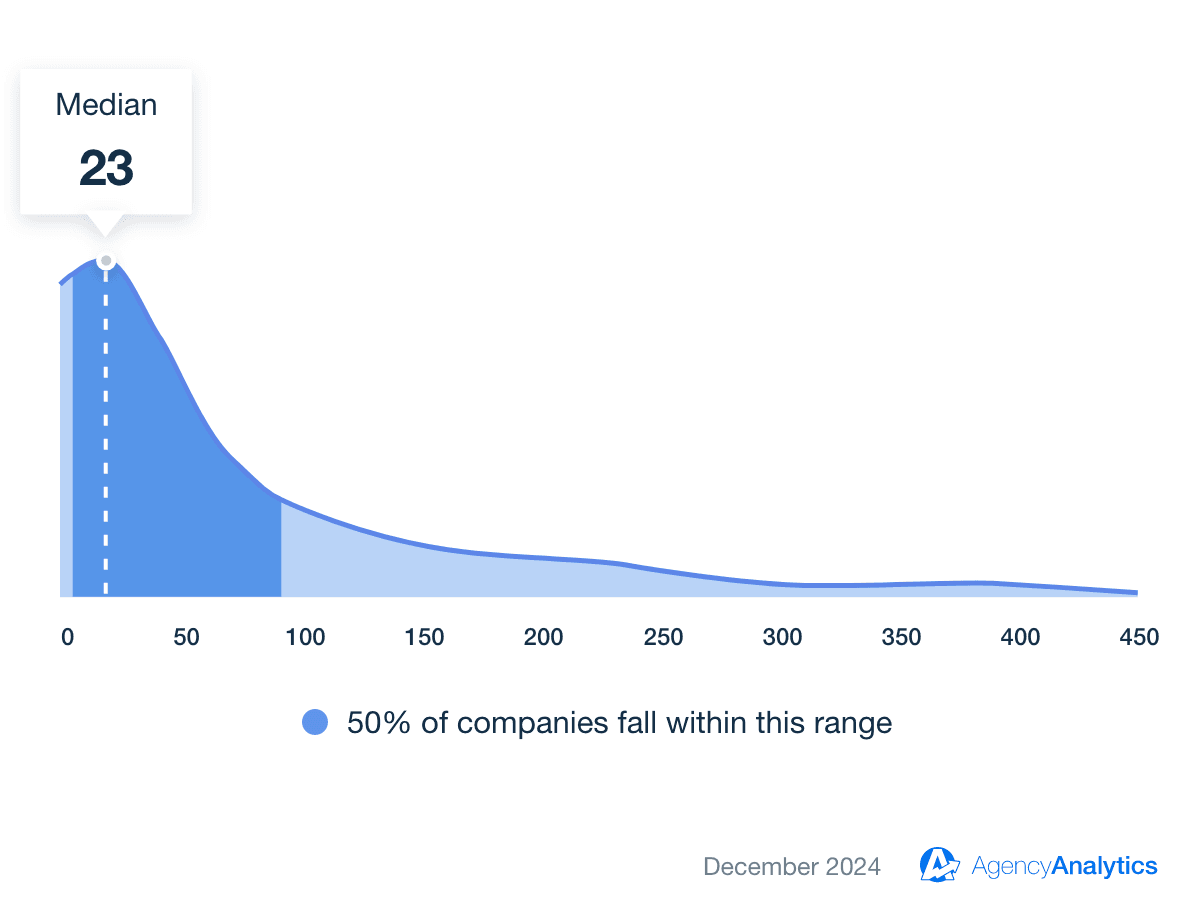
The median number of Pinterest saves is 23.
Saves track how many times users add a Pin to their own boards. With 23 saves per Pin, Pinterest content has a longer lifespan than posts on most other platforms, remaining discoverable months after posting.
If save rates are low, design Pins with eye-catching, easy-to-read fonts and test different Pin styles to see what resonates with users.
Impress clients and save hours with custom, automated reporting.
Join 7,000+ agencies that create reports in minutes instead of hours using AgencyAnalytics. Get started for free. No credit card required.
How To Interpret These Social Media Industry Benchmarks
Social media industry benchmarks provide context but shouldn’t be viewed as rigid success indicators. Evaluating social media performance depends on factors like the industry, the target audience, and your client’s specific business goals.
Rather than reacting to raw numbers at face value, understanding the nuances behind industry-specific data helps agencies make strategic, data-driven decisions that drive meaningful improvements.
For example, let’s examine when a low social media engagement rate isn’t necessarily alarming and when a high engagement rate could signal other potential issues.
When Falling Below An Industry Benchmark Isn’t A Bad Thing
A lower-than-average engagement rate might seem like a red flag, but it’s not always a sign of poor performance. Some industries, like the education industry, naturally experience lower engagement due to the type of social media posts they publish.
For example, higher education institutions often use social media as an informational tool rather than an engagement driver. Their educational content might include application deadlines, academic resources, or alumni news, which users read without necessarily liking, commenting, or sharing. While engagement rates might be lower than those in retail or entertainment, the content is still valuable to the target audience and fulfills its purpose.
Rather than looking at engagement rate in isolation, consider how it aligns with platform objectives. A university’s success might be better measured by link clicks or event sign-ups, which indicate that prospective students are taking action rather than simply engaging passively.
When Outperforming An Industry Benchmark Isn’t Always A Good Thing
On the flip side, a high engagement rate isn’t always a sign of success. The travel industry naturally attracts higher-than-average engagement due to its highly visual and aspirational content.
For instance, a travel brand featuring scenic destinations or luxury resorts might see above-average engagement, but if those interactions don’t translate into bookings or inquiries, the engagement may not contribute to business goals.
Similarly, viral content or a sudden spike in social media engagement could stem from negative press or controversy rather than positive audience interactions. Suppose a post’s comment section is filled with customer complaints or backlash. In that case, a high engagement rate may indicate a reputational issue that needs to be addressed rather than a successful campaign.
Facebook Engagement Rate By Industry
Industry | Post Engagement Rate |
|---|---|
Advertising & Marketing | 0.27% |
Animals & Pets | 1.25% |
Apparel & Fashion | 1.06% |
Arts & Entertainment | 0.91% |
Attorneys & Legal Services | 0.69% |
Automotive Parts & Services | 0.71% |
Beauty & Personal Care | 1.33% |
Business Services | 0.63% |
Career & Employment | 0.53% |
Dental Services | 0.87% |
Education | 1.69% |
Environment & Sustainability | 0.99% |
Event & Entertainment | 0.94% |
Finance & Insurance | 0.56% |
Food & Beverage | 0.77% |
Furniture | 1.58% |
Health & Fitness | 1.98% |
Home Improvement | 1.32% |
Industrial & Commercial | 0.53% |
Manufacturing & Industrial | 0.62% |
Non Profit | 0.78% |
Real Estate | 2.12% |
Restaurants | 1.25% |
Sports & Recreation | 1.23% |
Travel | 1.37% |
5 Tips for Using These Social Media Benchmarks in Your Client Reports
Industry benchmarks are a powerful tool for reinforcing your agency’s value and making helpful recommendations.
Here’s how to integrate social media benchmarks into your client reports in a way that’s insightful, strategic, and actionable.
Set the Right Narrative From the Start: Before launching a campaign, use benchmarks to align expectations. If a client is in an industry with historically lower engagement rates, address this upfront to avoid unrealistic goals. Similarly, if an industry naturally experiences higher audience growth, use that as a benchmark for evaluating success. Related: Data Storytelling: How To Tell a Powerful Story With Client Data
Turn Benchmarks Into a Story, Not Just a Number: Raw data often feels impersonal. Instead of just showing metrics, frame benchmarks within a compelling narrative. For example, rather than saying, “Your engagement rate is 1.8%,” highlight how it compares to industry norms, explain any fluctuations, and outline the next steps for continued success.
Use Above-Benchmark Performance to Demonstrate Your Success: When a client’s performance exceeds industry benchmarks, use this as a proof point of your agency’s impact. Highlight specific areas where your strategy outperformed competitors, reinforcing the value of your services.
Spotlight Areas for Growth With Data-Backed Insights: If a client is falling behind industry benchmarks, don’t just present the numbers—explain why it matters and how to fix it. For example, instead of saying, “Your reach is below the industry average,” provide actionable insights such as increasing post frequency, testing new content formats, or optimizing ad spend.
Use Benchmarks to Upsell Your Solutions: When benchmarks reveal gaps or growth opportunities, use them as a foundation for proposing additional services. For example, if a client’s organic reach is lower than the industry average, suggest a paid strategy to amplify content. If engagement lags, introduce interactive content formats like polls or live videos.
Ultimately, it’s not just about having the benchmarks—it’s about how you use them!
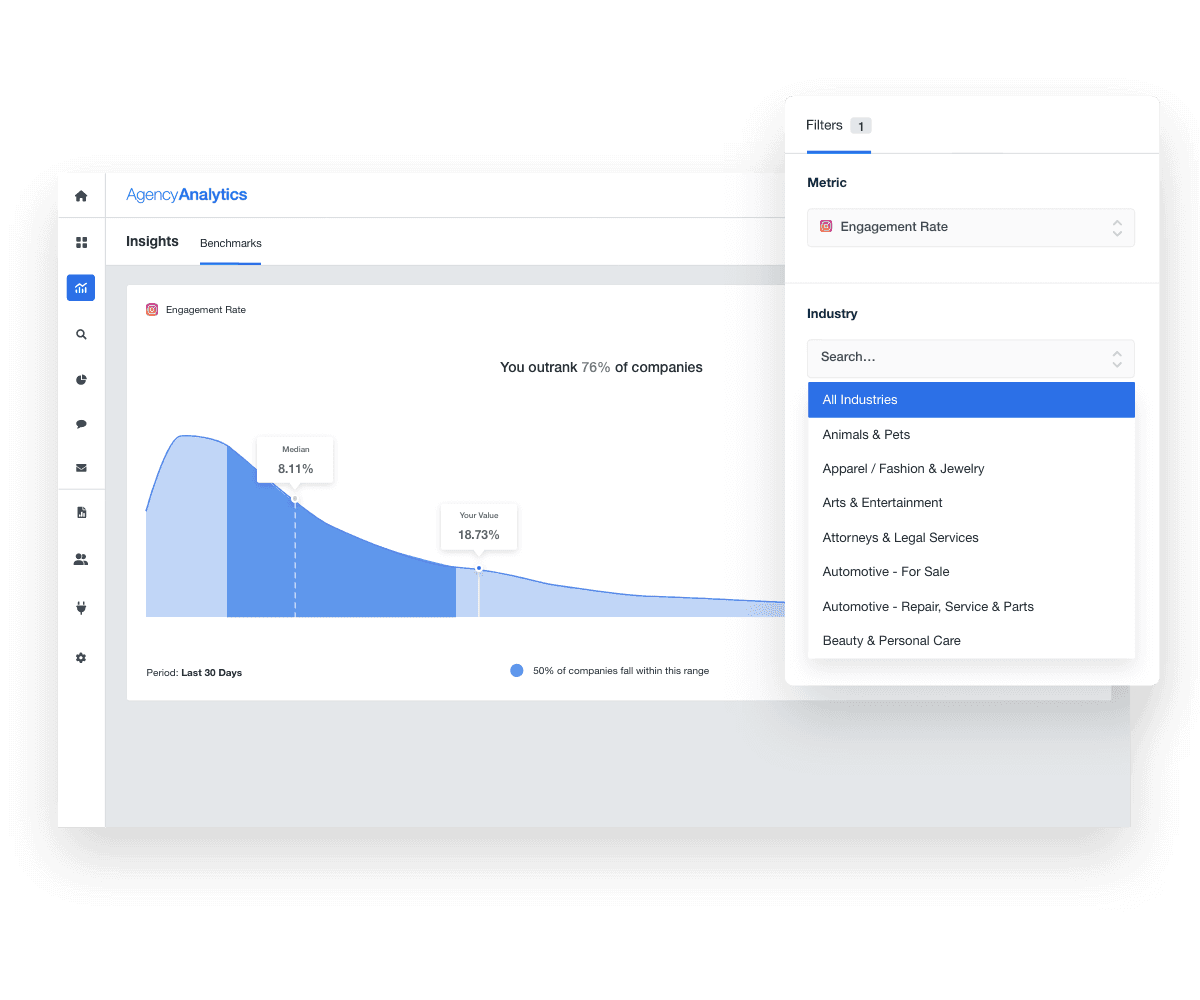
Turn Social Media Benchmarks Into Actionable Insights
Social media benchmarks provide clarity, context, and direction for strategy.
The key is using benchmarks wisely. Instead of chasing arbitrary numbers, focus on how they align with client goals. Use them to guide decisions, refine tactics, and measure progress in a way that drives real business impact.
Tracking the right metrics and applying insights strategically turns data into stronger campaigns, better client relationships, and measurable success.

Written by
Sylva is an expert content writer with over 10 years of experience in tech and SaaS, offering first-hand insight into agency needs from her background in advertising.
Read more posts by Sylva SivzattianSee how 7,000+ marketing agencies help clients win
Free 14-day trial. No credit card required.


