Table of Contents
Table of Contents
- What Are Social Media Metrics?
- Why Is Measuring Social Media Metrics Important?
- Measuring Social Media Campaign Success: Vanity Metrics Vs. Actionable Metrics
- Defining the Social Media Sales Funnel
- The 13 Most Important Social Media Metrics You Need To Track
- Choosing the Right Social Media Metrics and How to Track Them
- Why Do I Need a Social Media Metrics and KPIs Dashboard for Clients?
- Use Industry Benchmarks To Showcase Agency Success
- Summary: Tracking Key Metrics on Social Media
7,000+ agencies have ditched manual reports. You can too.
Free 14-Day TrialQUICK SUMMARY:
Social media metrics are used to measure performance, understand audience behavior, and optimize campaign strategy. Picking the right ones isn’t always straightforward, though. To make things clearer, this article explores 13 must-track metrics, including audience growth, engagement rates, and conversions. Learn how to separate vanity stats from actionable insights, tie data to client goals, and build reports that drive growth across every stage of the funnel.
You’re running high-effort social media campaigns—testing creatives, managing spend, and optimizing for conversions. But when it’s time to report, the same question always pops up: “What do all these metrics mean?”
There’s no shortage of data. In fact, every social media platform offers dozens of numbers, like impressions, reach, follower count… you name it. The real challenge is knowing which ones actually contribute to client goals and which ones are just noise. Easier said than done, right? No need to guess which social metrics tie into ROI while drowning in irrelevant data–we’re here to break it down for you.
This guide explores the 13 most important social media marketing metrics to track, along with tips for optimal results. We’ll also cover the various stages of the social media funnel, how to choose the right data points, and the best ways to report results to clients.
What Are Social Media Metrics?
Social media metrics are data points that show how a client’s content is performing. They include numbers like impressions, clicks, shares, and conversions, offering a real-time snapshot of what’s working and what needs adjustment.
More importantly, these metrics answer the questions clients care about, like:
Is our strategy actually working?
Are we reaching the right audience?
What’s driving engagement or conversions?
Is our budget being used effectively?
Whether the goal is to increase brand awareness or boost conversions, social media metrics turn campaign activity into something measurable. This makes it easier to show progress, optimize strategy, and build trust with clients.
Why Is Measuring Social Media Metrics Important?
Social media metrics provide clarity on which campaigns are effective, what requires improvement, and what type of content to invest in next.
More specifically, here are a few practical use cases.
Use Case | Why It Matters |
|---|---|
Spot and Solve Performance Issues | Social media metrics highlight sudden drops in engagement or spikes in bounce rate, which may point to issues with targeting, creative, or platform fit. This allows your team to adjust quickly and run data-informed tests. |
Back Up Strategy With Proof | These metrics turn day-to-day activity into clear outcomes, such as leads, conversions, and brand growth. This makes it easier to demonstrate ROI and build client trust. |
Fuel Smarter Content Decisions | Discover which topics, formats, and messaging styles resonate most. Then, use this data to guide creative decisions based on relevant audience behavior. |
Tie Reporting to Business Goals | Aligning metrics with goals like ROI, retention, or reach ensures reporting stays focused on impact. That way, clients see the real value behind the numbers. |
By monitoring these metrics, you’ll uncover what content performs best and fine-tune social media strategies to improve outcomes.
Measuring Social Media Campaign Success: Vanity Metrics Vs. Actionable Metrics
Vanity metrics are surface-level numbers that look impressive but don’t necessarily contribute to tangible business outcomes. A classic example? The total number of followers. Having a large audience might look good on paper (or in a competitive analysis), but it doesn’t automatically mean better engagement, more sales, or stronger brand loyalty.
On the flip side, actionable metrics are tied to specific business objectives and offer clear insights to act on. These are the numbers that show whether a campaign is moving in the right direction, needs a pivot, or requires a total overhaul. Click-through rates, conversion rates, and customer acquisition costs are prime examples of actionable metrics that align with ROI.
Vanity metrics are superficial numbers that fuel the ego. Actionable metrics are valuable numbers that fuel marketing and can be associated with clearly defined and measurable outcomes.
Cheryl Ingram, Managing Director, The Digital Media Collective
The line between vanity and actionable metrics isn’t always clear–it really depends on the campaign’s goals. As a general rule, though: If a metric supports a clear business objective, it’s actionable. If it looks good but doesn’t lead to informed decisions or significant impact, it’s likely vanity.
By focusing on metrics that connect to real outcomes, you’ll make smarter decisions, justify ad spend, and drive more meaningful results.
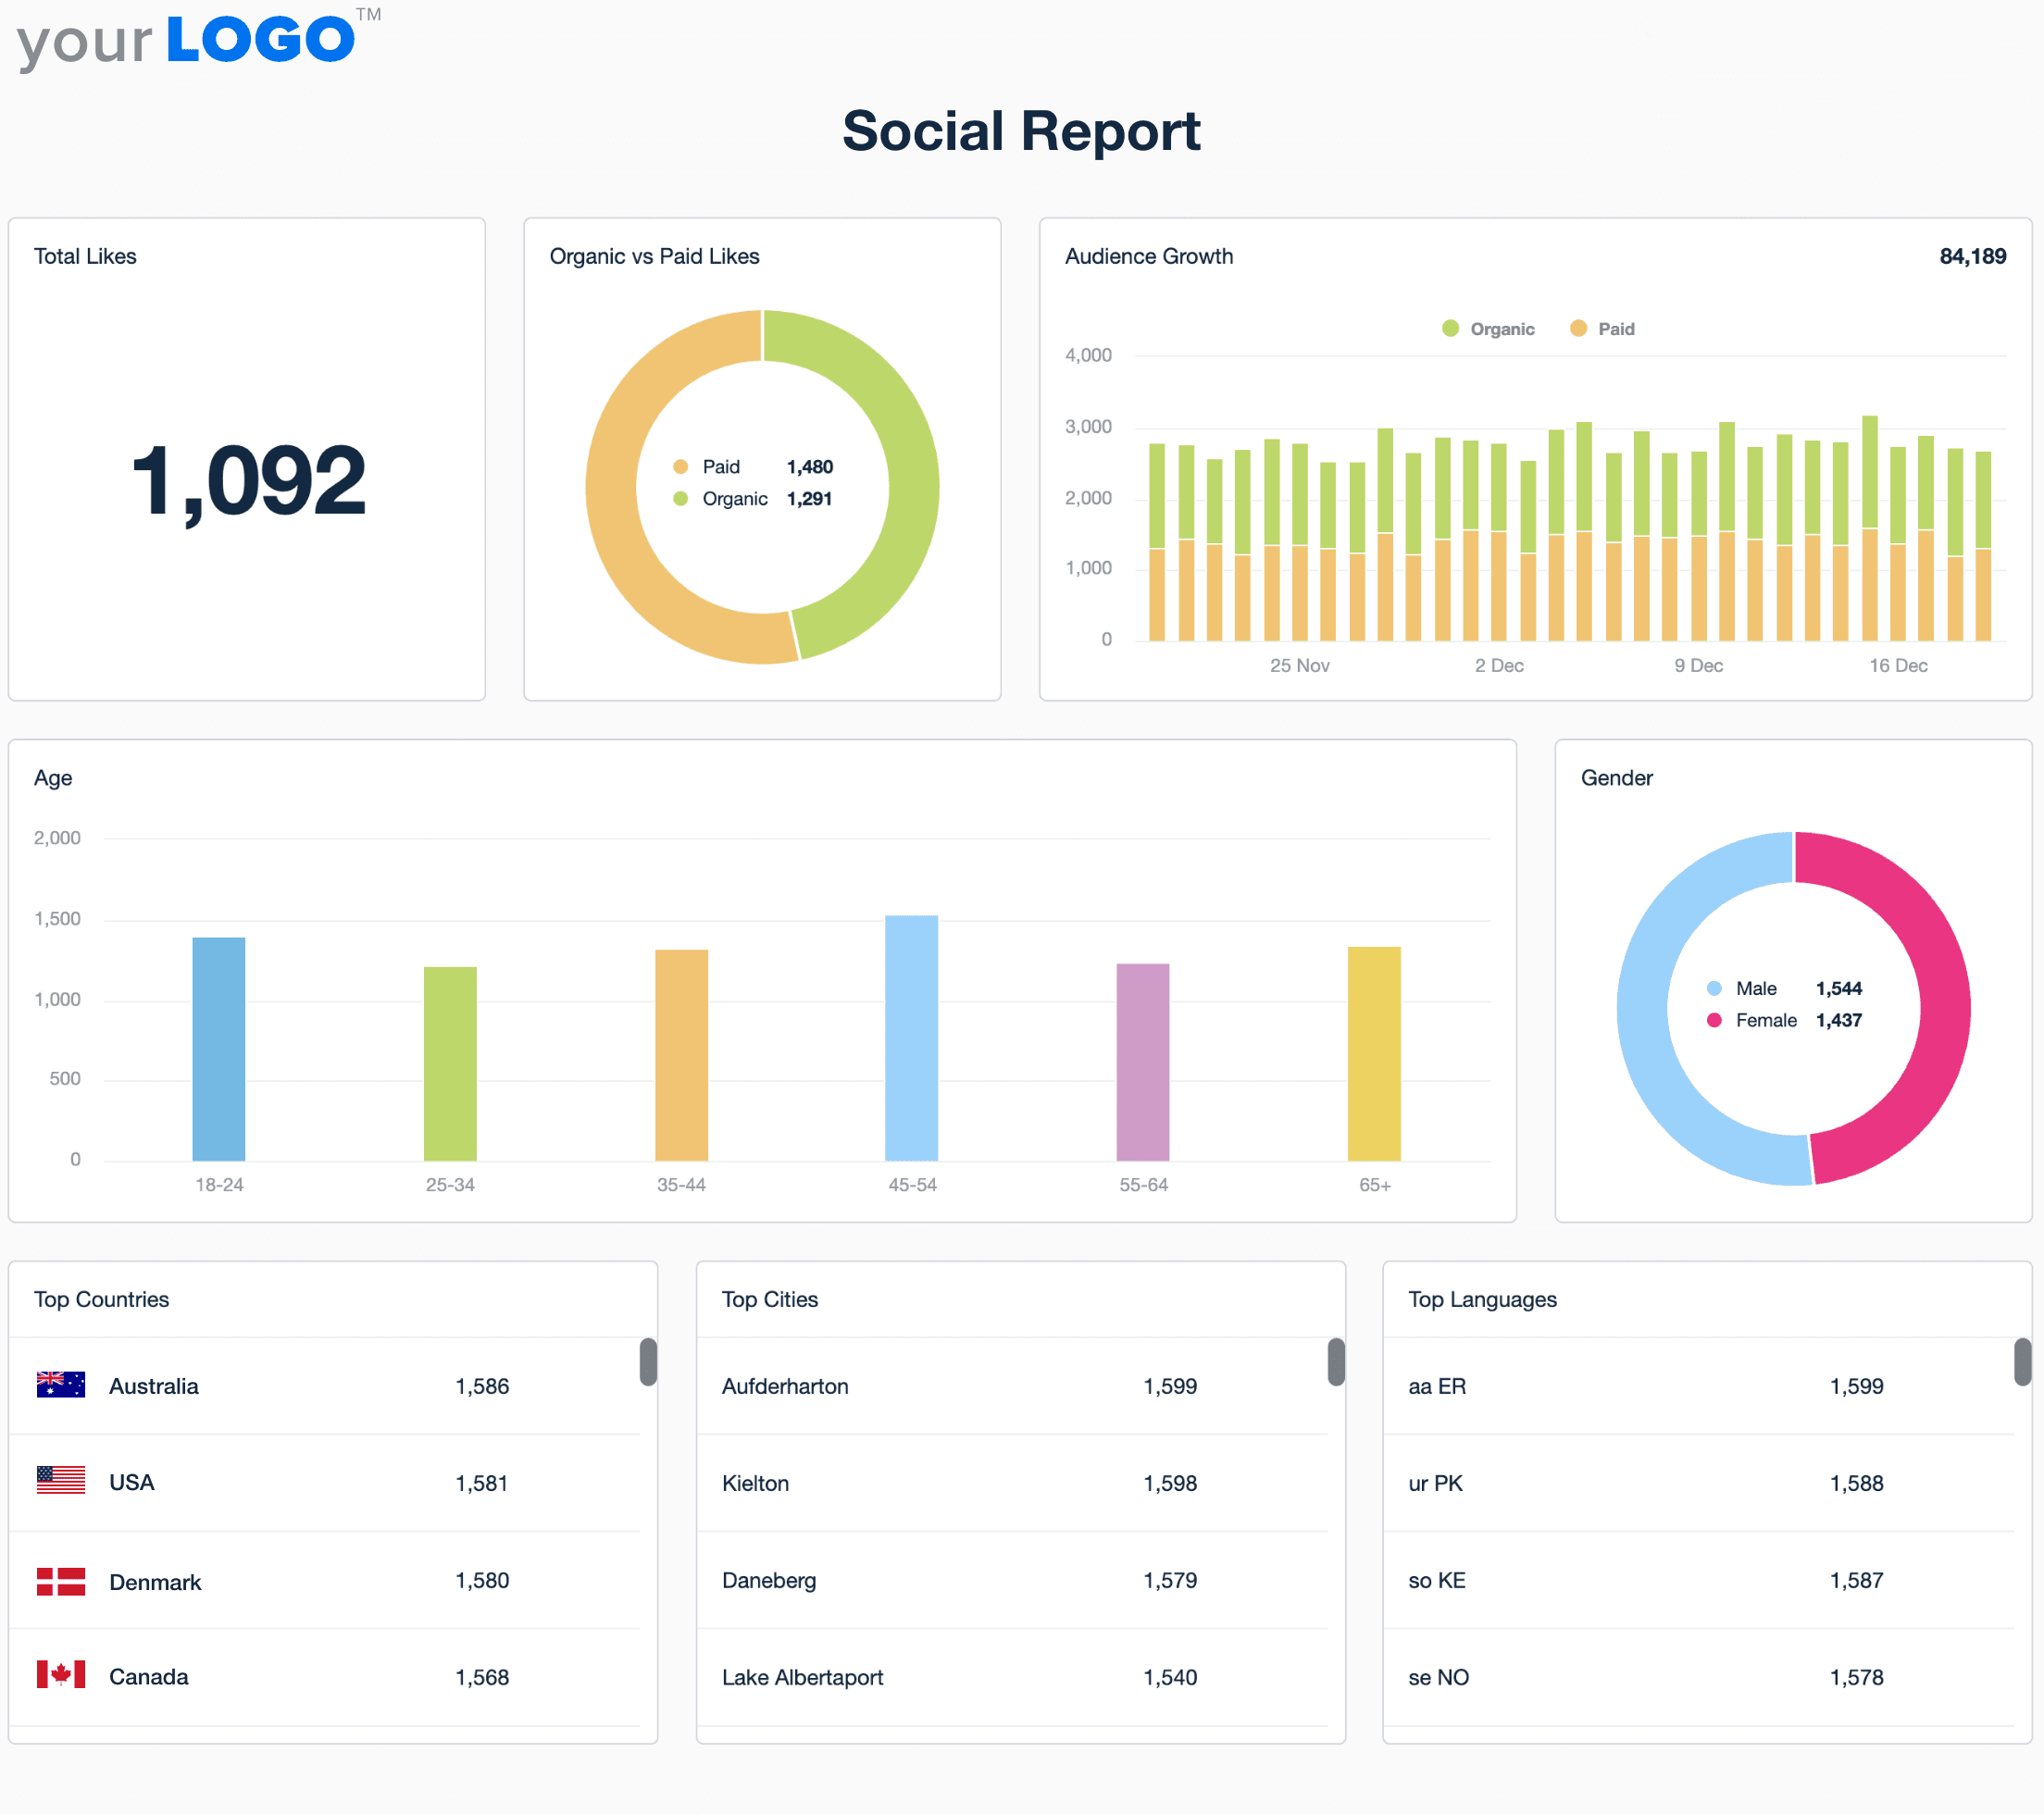
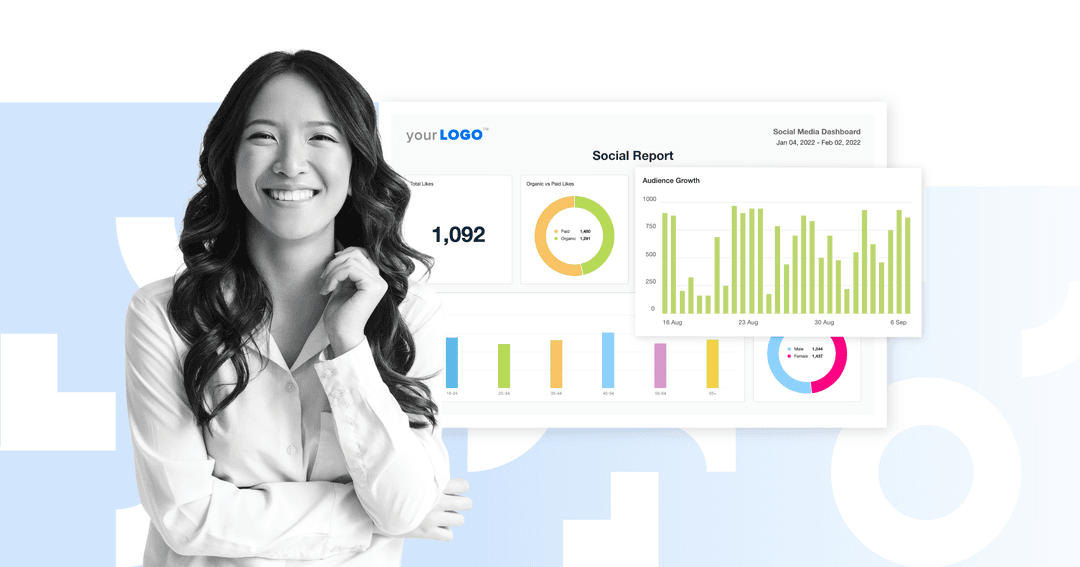
Optimize your workflow by using this exact social media report template or a pre-built dashboard. Even build your own from scratch! Try AgencyAnalytics today–it’s free for 14 days.
Defining the Social Media Sales Funnel
Before diving into the specific metrics to track, it’s important to understand the social media sales funnel. That way, you’ll be better equipped to focus on the right goals at the right time.
At a high level, the funnel is divided into four distinct stages:
Awareness: This is where it all starts—expanding visibility, capturing attention, and ensuring your client’s brand is discovered by new audiences. At this top-of-funnel stage, the priority is reaching as many relevant people as possible and sparking initial recognition.
Consideration: In the middle of the funnel, the main objective shifts to engagement. It’s about understanding whether your client’s content is driving interest and encouraging potential customers to learn more.
Conversion: This stage is all about measurable outcomes. Whether it’s an event sign-up, purchase, or booked consultation, the focus is on actions that directly impact the bottom line. These are often the most ROI-centric metrics (and the ones clients pay closest attention to in reports).
Advocacy: Once a conversion happens, the focus shifts to long-term value. This means building loyalty and driving repeat engagement. It’s also about nurturing brand advocates who share their experiences and refer others.
Understanding each stage of the funnel helps clarify which metrics matter and why. It also connects social efforts to meaningful business outcomes.
The 13 Most Important Social Media Metrics You Need To Track
Now that we’ve explored the social media funnel, here are the key metrics to monitor at each stage (plus tips on optimizing them for better results).
Awareness Metrics
At the awareness stage, the goal is simple: Get your client’s brand in front of as many relevant people as possible. These metrics show whether their campaigns are gaining traction and being seen by the right audience.
1. Reach
Reach measures how many unique social media users saw your client’s content. Strong reach means your client’s content is being noticed by a broad audience, which is especially valuable for new campaigns or brand launches.
If numbers are low, improve visibility by testing different post formats, adjusting timing, or using ads that target high-intent audiences.
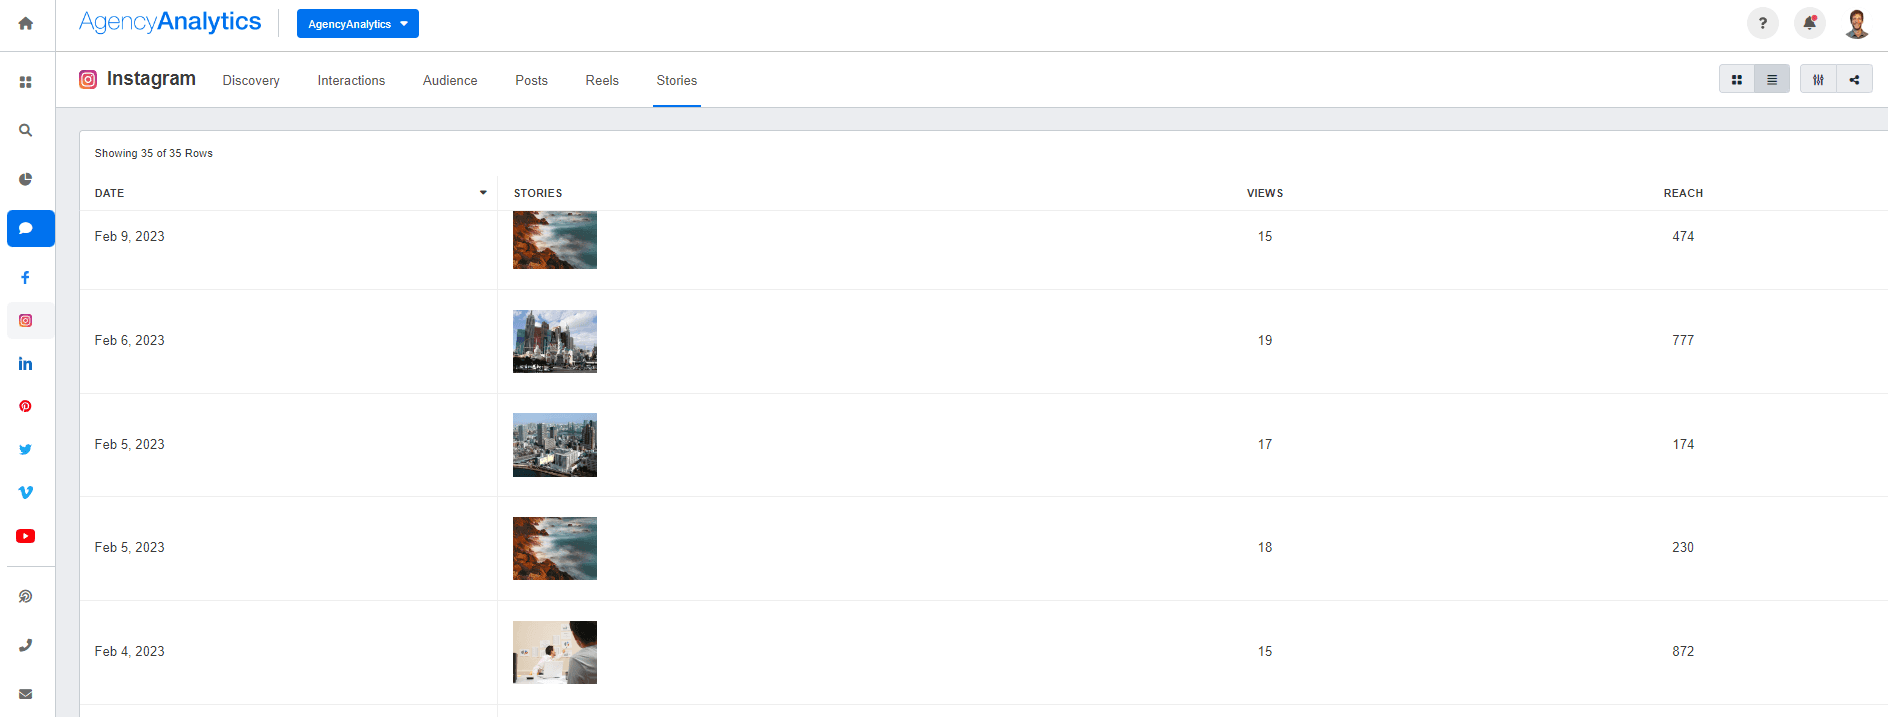
Access multiple social media reporting metrics in one place. Monitor reach, referral traffic, leads generated, and other key insights–explore AgencyAnalytics, free for 14 days.
2. Follower Growth Rate
Follower growth rate tracks how fast your client’s audience is expanding. Healthy growth varies by industry, but even a steady 2 to 5% monthly increase shows that their content is effective.
Sluggish growth often means the content isn’t compelling enough to earn a follow. In these scenarios, try spotlighting thought leadership, behind-the-scenes content, or influencer partnerships to attract new followers.
Consideration Metrics
Once people know your client’s brand, the next step is getting them to interact. These social media engagement metrics show whether their content is gaining interest and encouraging actions.
3. Audience Engagement
Audience engagement reflects how users interact with your client’s content. This includes actions such as likes, shares, brand mentions, comments, and saves.
The only way to assess how your message is perceived is by studying the reactions to your content. Clicks, shares, or replies are the “facial expressions” and “words” that tell you how well your conversation is going.
Seth Giammanco, Principal of Strategy & Technology, Minds On Design Lab
Strong engagement shows that your client’s social media post or ad is resonating in some way, enough to spark a response, start a conversation, or encourage sharing. If engagement is low, focus on creating more relatable, shareable posts–think questions, polls, or content that invites a direct response. It’s also a good idea to explore optimal social media posting times, which could improve visibility.
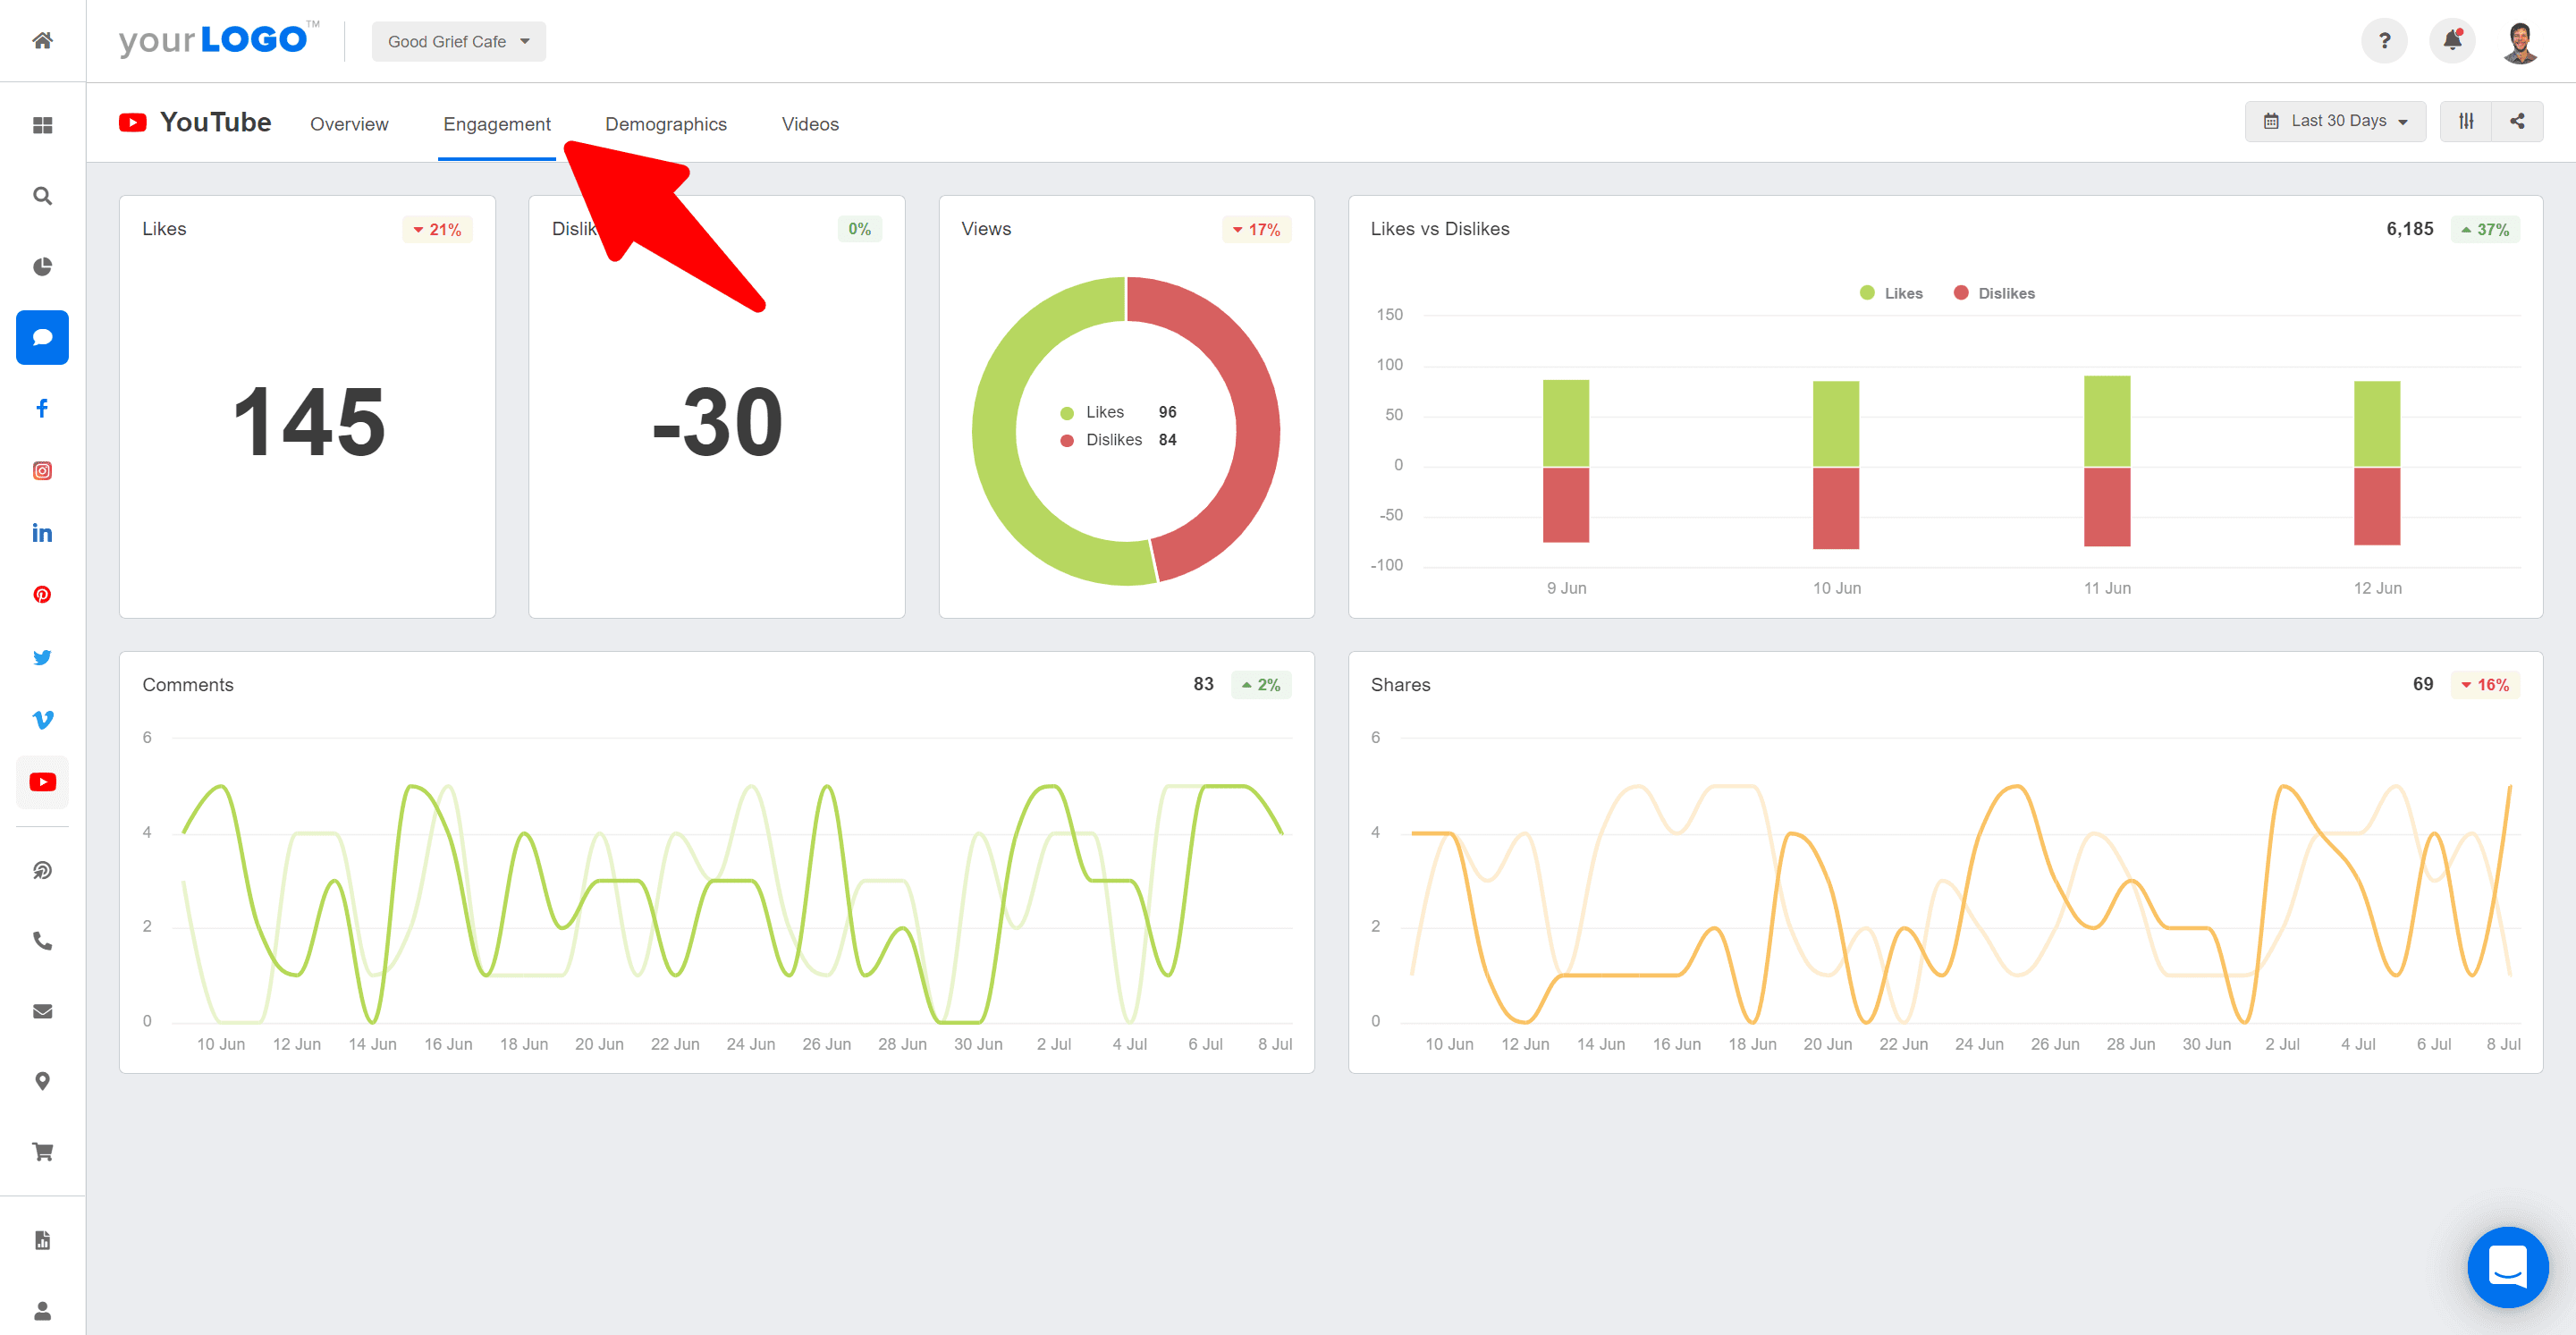
Invest in a tool with 80+ integrations across social media, paid ads, email marketing, and more. See what AgencyAnalytics has to offer–try it free for 14 days.
4. Click-Through Rate (CTR)
Click-through rate (CTR) measures the percentage of users who click on a link after seeing your client’s post or ad. To achieve a good CTR, ensure their content grabs attention quickly, clearly communicates value, and gives people a compelling reason to click.
A low CTR often signals that something’s off—maybe the message isn’t clear, the CTA is getting lost, or the creative doesn’t match the audience’s intent. Try testing more direct headlines and ensuring the landing page delivers on what the post or ad promises.
5. Social Share of Voice (SSoV)
Social Share of Voice (SSoV) tracks how often your client’s brand is mentioned compared to competitors. It’s a good indicator of visibility and relevance, showing how much space they’re occupying in social media conversations.
A low SSoV means your client’s presence is getting drowned out by other players in the market. To fix this, increase posting frequency, join trending conversations, or create highly shareable, brand-specific content.
Conversion Metrics
Once interest is established, the goal is to turn that attention into action. These conversion metrics reveal whether users are taking meaningful next steps after engaging with your client’s content.
6. Conversion Rate
Conversion rate shows the percentage of users who complete a desired action after clicking your client’s social media post or ad, like filling out a form or making a purchase.
A strong conversion rate varies by industry, but anything above 2 to 5% is typically solid. It means the content is attracting the right audience, the offer is compelling, and the post or ad is successfully guiding users to take the next step.
To address a low conversion rate, revisit the landing page experience. Ensure it aligns with the expectations set by the ad or post, removes unnecessary friction, and clearly guides users toward the next step.
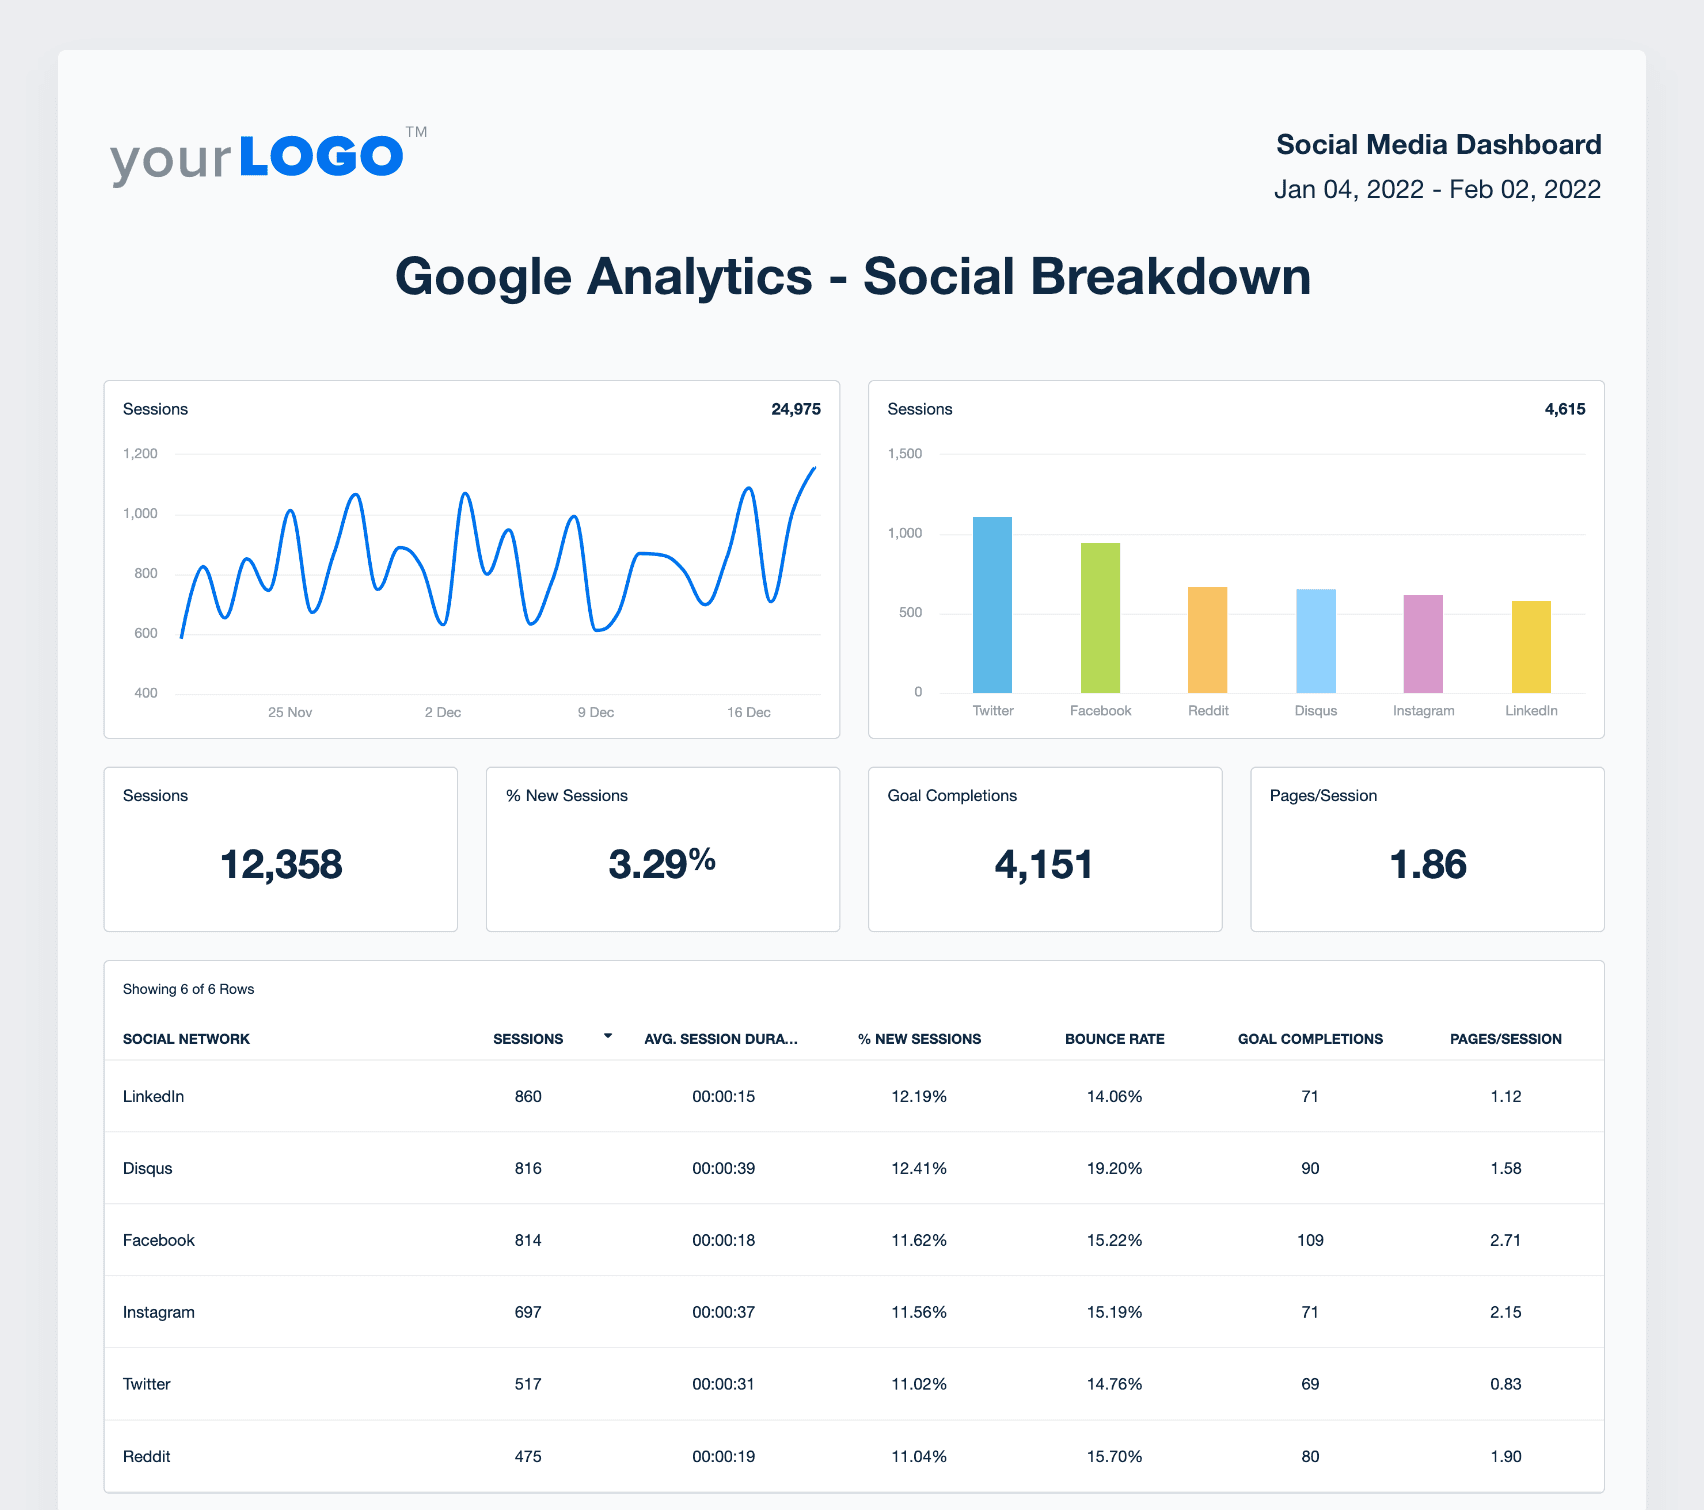
Monitor the full impact of your client’s social media efforts. Track referral traffic, audience demographics, and conversions in one place–try AgencyAnalytics, free for 14 days.
7. Cost Per Thousand Impressions (CPM)
Cost Per Thousand Impressions (CPM) measures how much your client is paying to get 1,000 views of their ad. In other words, it reflects how efficiently the campaign is generating visibility. A lower CPM typically indicates that the platform sees the ad as high-quality and relevant, making it cheaper to distribute at scale.
If CPM is higher than expected, consider broadening the target audience slightly, testing different formats (like Reels or Stories), or improving the creative to boost initial engagement. Since CPM influences how far a budget can go, small adjustments may have a big impact on total reach and brand exposure.
8. Cost Per Click (CPC)
Cost Per Click (CPC) measures how much your client pays each time someone clicks on their social media ad. It’s a key indicator of how efficiently their budget is being used to drive website traffic. A lower CPC generally means the ad is relevant, the audience targeting is dialed in, and the platform sees the content as valuable.
If CPC is higher than expected, try testing different creatives, adjusting targeting, or refining the messaging to better match audience intent. Even small changes may lead to more efficient spend and better results over time.
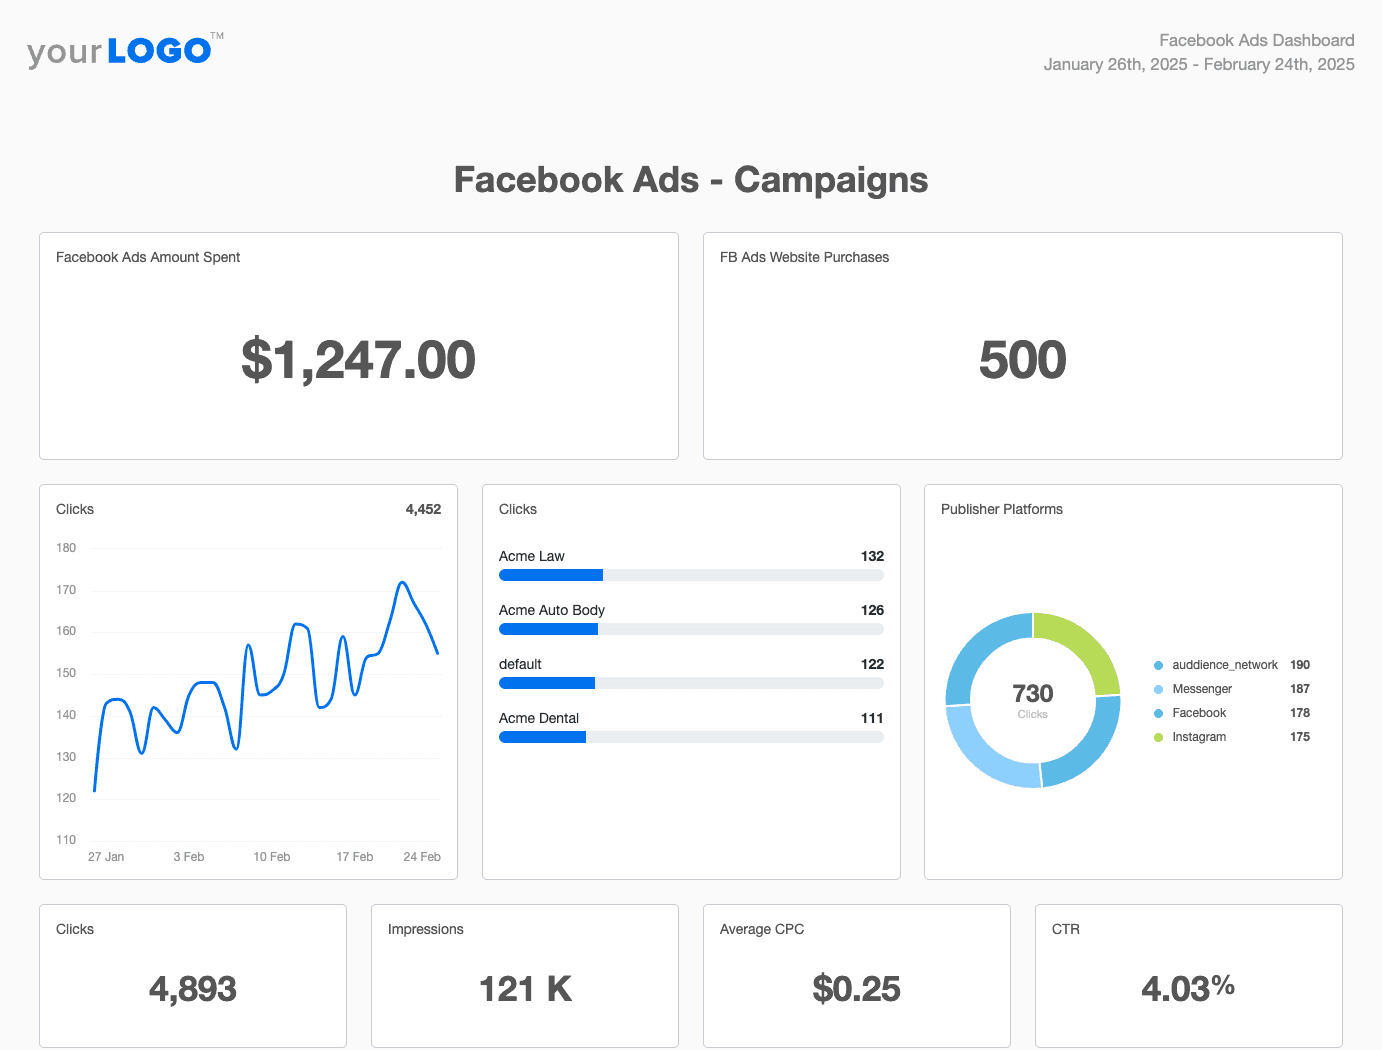
Take social performance reporting to the next level. Consolidate data across 80+ platforms and deliver results that matter–try AgencyAnalytics, free for 14 days.
9. Bounce Rate
Bounce rate measures the percentage of users who click through to your client’s landing page from a social media post or ad, but leave without taking any further action.
A high bounce rate could mean the landing page content doesn’t match the ad. It could also be caused by slow page load times or a not-so-friendly user experience.
To reduce bounce rate, ensure the landing page aligns with the ad's message and visuals. Keep the page clean, fast, and easy to navigate, with a clear next step that encourages users to stay longer.
Advocacy Metrics
After the conversion, a great social strategy keeps the ball rolling. These customer service metrics show how well your client is building loyalty, satisfaction, and long-term value.
10. Customer Testimonials
Customer testimonials are a powerful form of social proof. They show that real people have had positive experiences with your client’s product or service, and are willing to talk about it publicly.
To get more testimonials, monitor comments, tags, and mentions for positive feedback that could be reshared. Prompt happy customers to post about their experience (e.g., use a caption that asks them to share before and after photos). It’s also helpful to ask for reviews during 1:1 interactions.
11. Customer Satisfaction Score (CSAT)
Customer Satisfaction Score (CSAT) measures how happy customers are with a specific interaction, product, or experience. It’s gathered by asking users to rate their satisfaction on a scale (usually right after a purchase or support interaction). On social media, CSAT is often collected through quick polls, direct messages, or embedded surveys.
A high CSAT shows that the customer experience is meeting or exceeding expectations. A lower score could indicate gaps in service, unclear communication, or missed expectations. For best results, respond quickly to questions, provide helpful content, and make sure all social interactions are on-brand.
12. Net Promoter Score (NPS)
Net Promoter Score (NPS) tracks how likely your client’s audience is to recommend their brand to others, making it a strong indicator of loyalty and long-term brand health. On social media, NPS can be gathered using polls, direct messages, or linked surveys that ask followers: “How likely are you to recommend this brand to a friend?” with a scale from 0 to 10.
A high NPS means the audience sees real value and is willing to publicly endorse your client’s business (often through shares, tags, or recommendations). A low score may suggest disconnects in content, product perception, or overall brand experience.
To improve NPS, use social media to engage brand advocates, respond to customer concerns, and share useful content that deepens trust.
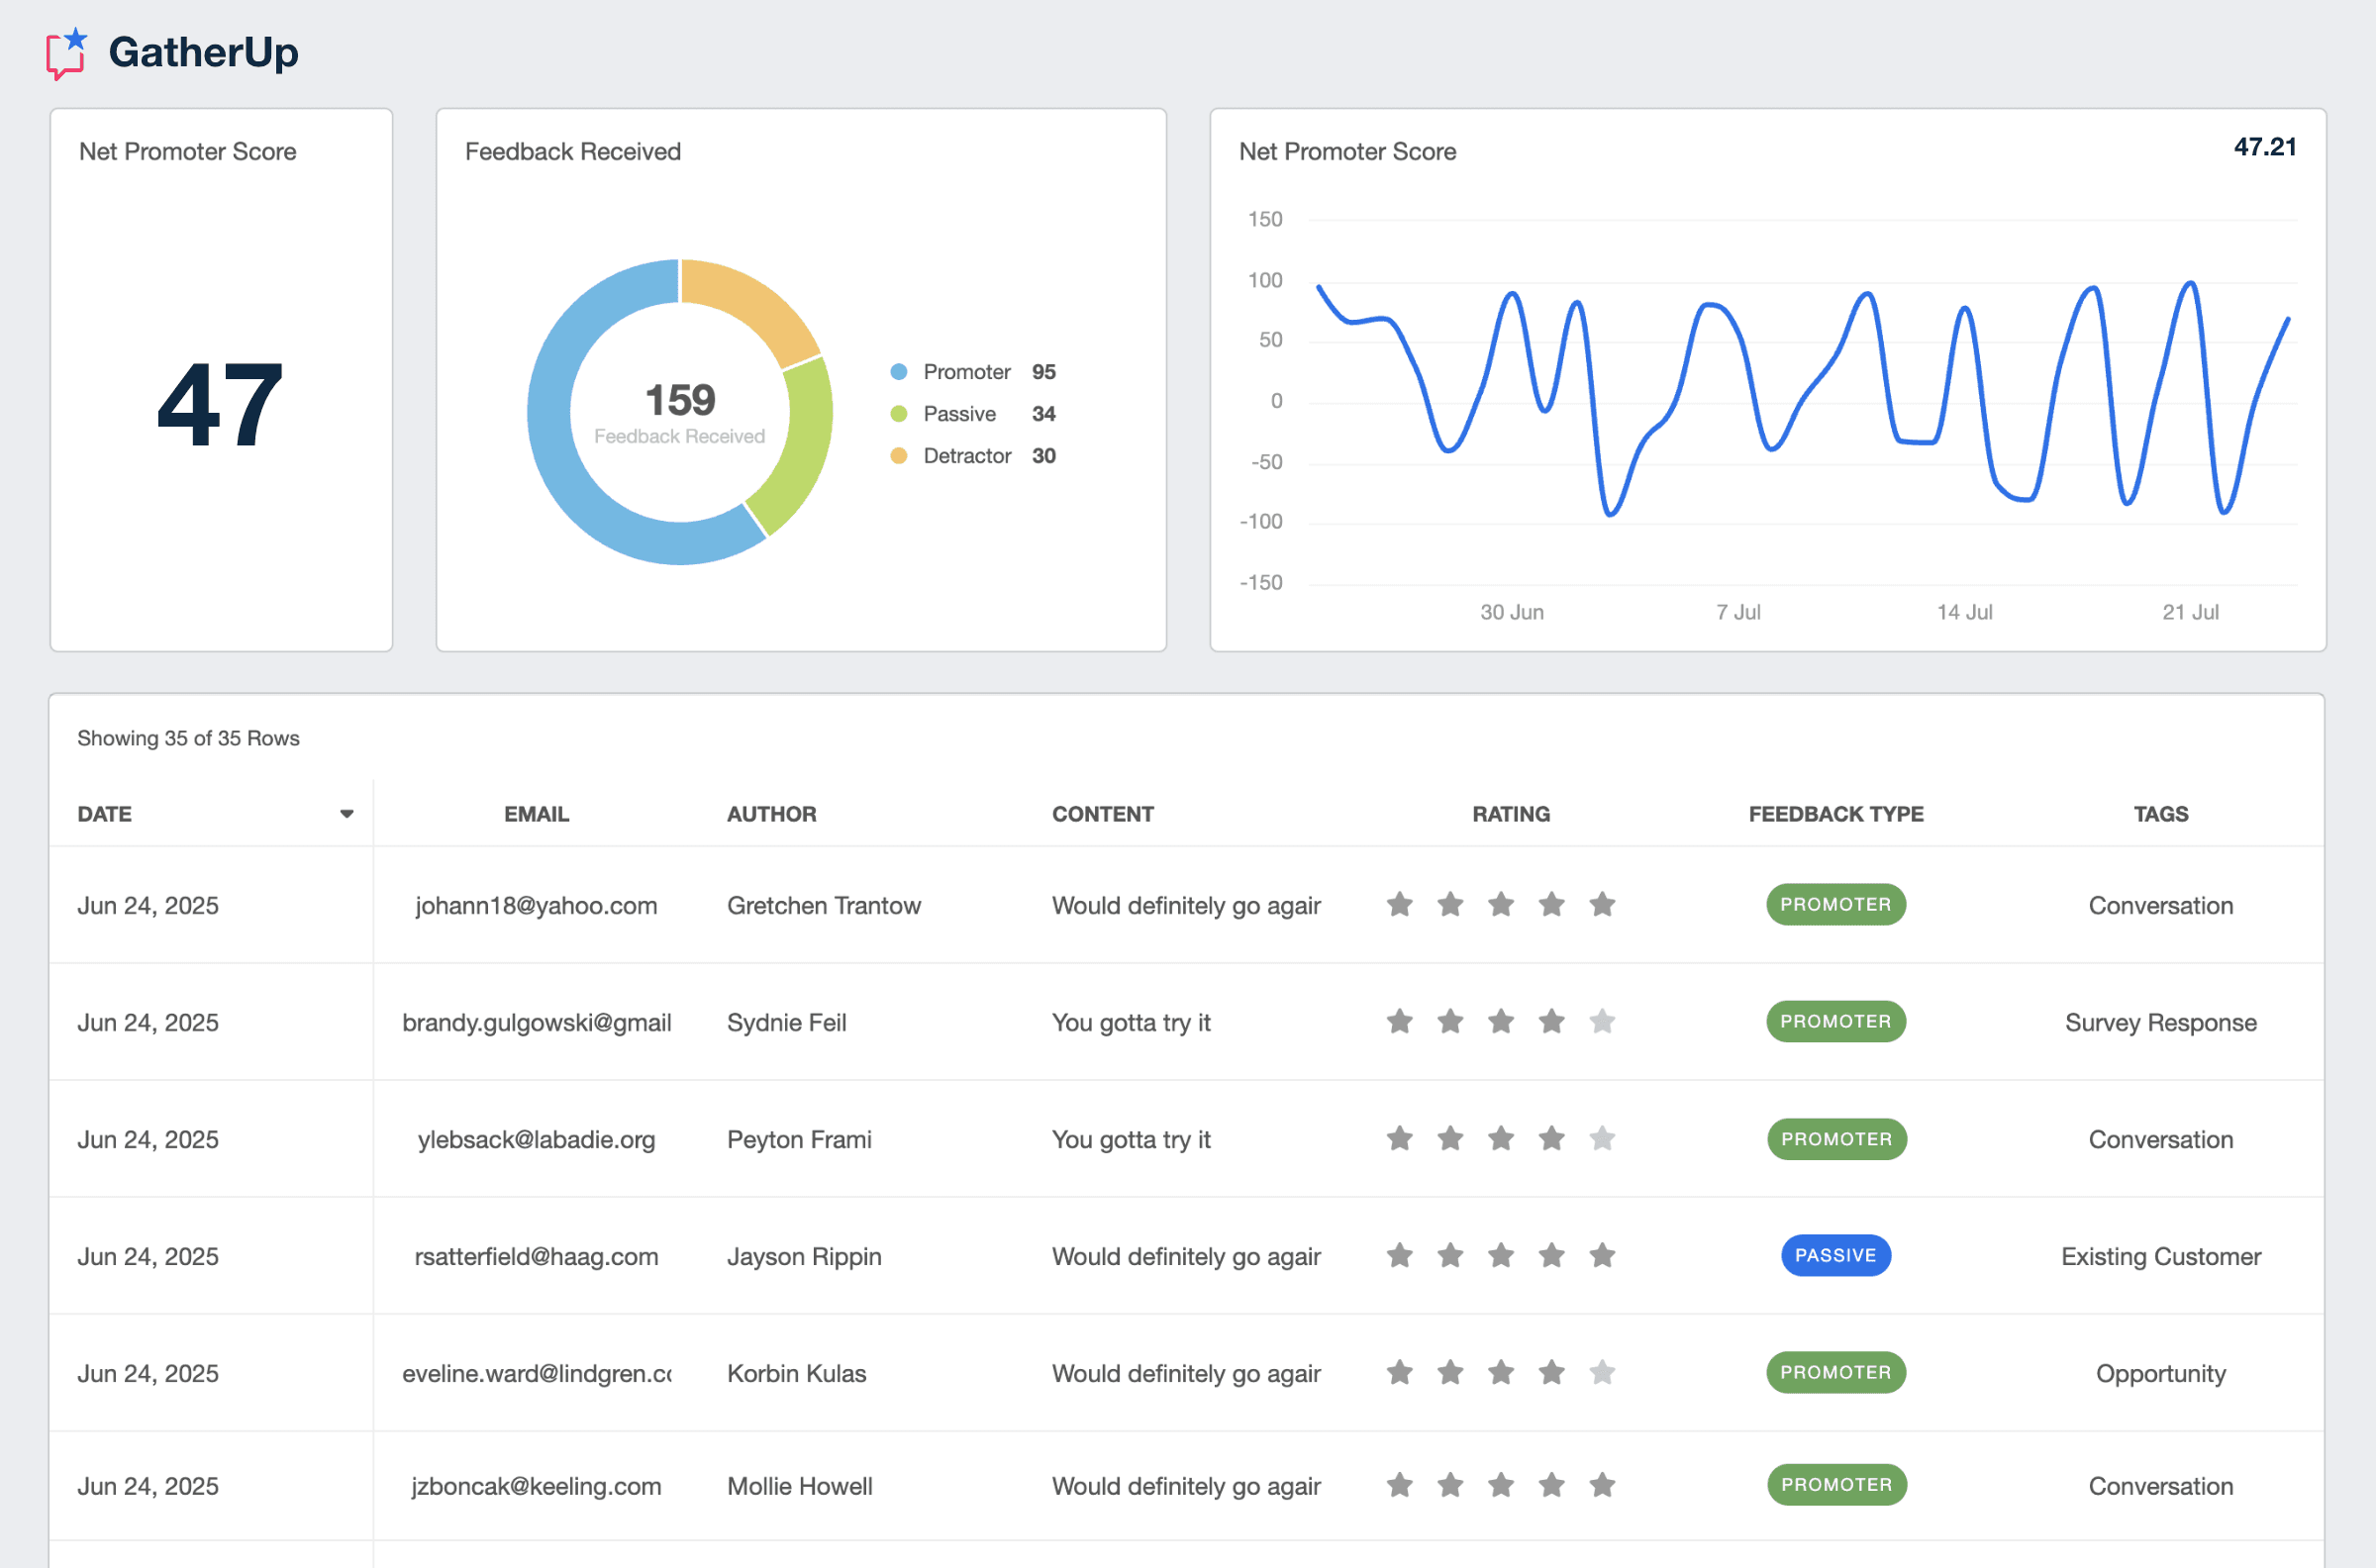
Use a sentiment analysis tool like GatherUp to keep an eye on your client’s online reputation. Explore this integration in AgencyAnalytics by signing up for a free 14-day trial today.
13. Customer Lifetime Value (CLV)
Customer Lifetime Value (CLV) estimates how much revenue a single customer brings in over the course of their relationship with your client’s business. It also offers insight into how effectively social media contributes to acquiring new customers and keeping them engaged over time.
A high CLV means customers are making repeat purchases and continuing to find value in your client’s brand over time. A low CLV may point to one-time buyers with little follow-up or retention.
To improve CLV, use social media to stay connected post-purchase. Share loyalty perks, resurface product benefits, and run re-engagement campaigns that keep customers coming back.
Choosing the Right Social Media Metrics and How to Track Them
Effective reporting starts with picking the right metrics–ones that directly tie into client goals.
It isn’t about tracking everything, though. Instead, focus on the social media analytics that show real progress. As a recap, be sure to:
Start With Your Client’s Goal: Whether the focus is brand awareness, lead generation, or sales, metrics should map directly to the outcomes the client cares about most.
Align Metrics to the Funnel Stage: Monitor different social media data for the awareness, consideration, conversion, and advocacy stages. Use this to identify which content drives discovery, what encourages engagement, and where users are dropping off.
Focus on What’s Actionable: Prioritize metrics that point to specific optimizations. If engagement drops, test new creative or posting times. If CTR is low, revisit headlines, target different audience demographics, or experiment with new CTAs. Every metric tracked should lead to a clear decision or adjustment.
Ensure Consistency Over Time: Evaluate the same metrics regularly to spot trends, measure progress, and avoid misinterpreting one-off spikes or dips.
Once the right metrics are identified, tracking them consistently is just as important.
Here’s the thing, though: Clients don’t want to dig through spreadsheets or look at scattered screenshots. They want a clear view of how their investment is performing, without too much of a lift.
Skip the manual effort—use a social media analytics tool that brings everything together in one place. It eliminates the need to stitch together data from multiple social media accounts, all while maximizing your billable time. The result? A more cohesive reporting experience, enhanced efficiency, and a solid process that supports agency growth.
We want to be totally transparent with our clients. AgencyAnalytics allows us to provide our clients with a live dashboard where they can have complete insight into what we're doing without needing full access to the platforms where they could potentially interfere with performance.
Michael Wisby, CEO, Two Trees PPC
Why Do I Need a Social Media Metrics and KPIs Dashboard for Clients?
At scale, reporting gets a little… messy. Just think about how many metrics are involved when you’re managing multiple clients and campaigns. Needless to say, it’s a lot (not to mention a complete headache). The solution to these woes? A social media metrics and KPIs dashboard. It’s a way to:
Save time by automating data collection across multiple social platforms.
Increase transparency by giving clients on-demand access to their real-time results.
Standardize reporting across clients through consistent layouts and dynamic visuals.
Highlight the social media metrics that align with your client’s priorities.
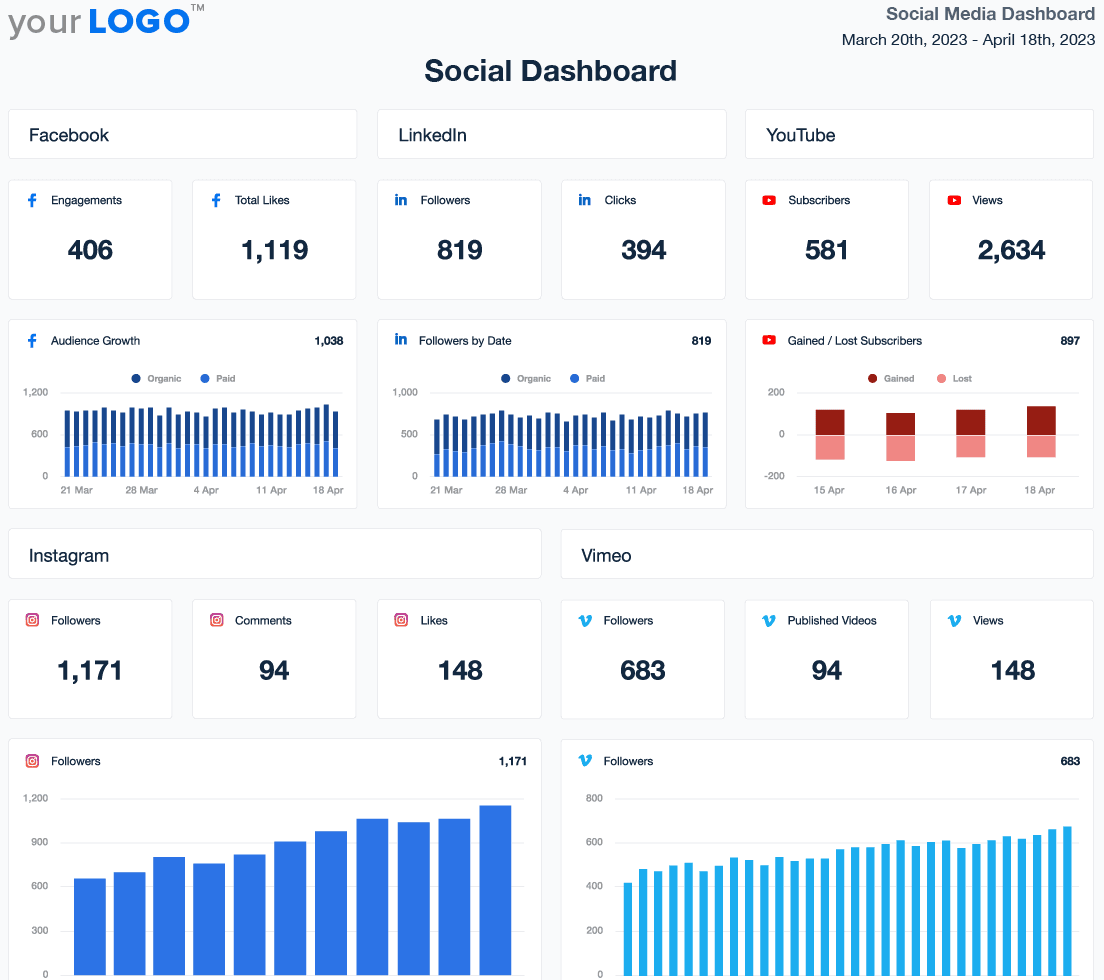
With this type of social media analytics software, reporting becomes much less of a time drain. Instead, it’s a handy way to keep teams focused, clients informed, and performance moving in the right direction.
Use Industry Benchmarks To Showcase Agency Success
What if there were a way to factor in macro-context within this dashboard? Luckily, there is!
With AgencyAnalytics, it’s easy to report on social media performance and industry benchmarks, all in one place. Wondering why this extra step matters?
Benchmarks give context to the numbers, helping clients understand what “good” looks like and how their social media efforts compare to others. They shift the conversation from isolated metrics to performance grounded in real-world standards.
More specifically, here’s how to put benchmarks to work, backed by data from over 150,000 campaigns run by 7,000+ agencies on the AgencyAnalytics platform.
Highlight Where Your Clients Stand
Benchmarks help clients understand whether their numbers are average, underperforming, or ahead of the curve. Without that context, even strong results can be overlooked or misunderstood.
For example, the median LinkedIn follower count for the Advertising & Marketing industry is 522 (according to our first-party data). If a client’s page has 860 followers, that’s more than 60% above the industry median. In this scenario, it’s a concrete indicator that their brand presence is stronger than most peers in the space. And that’s something worth mentioning.
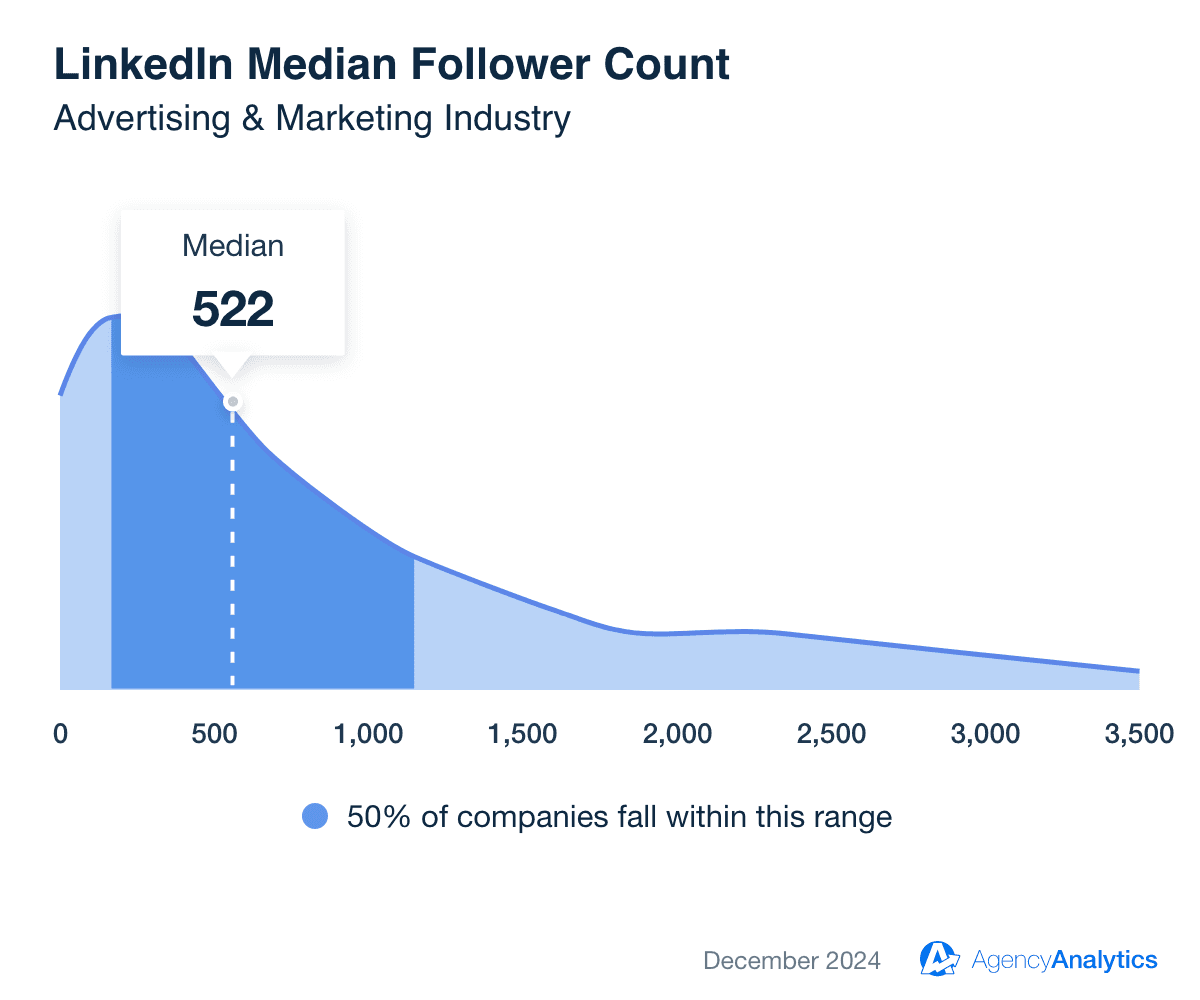
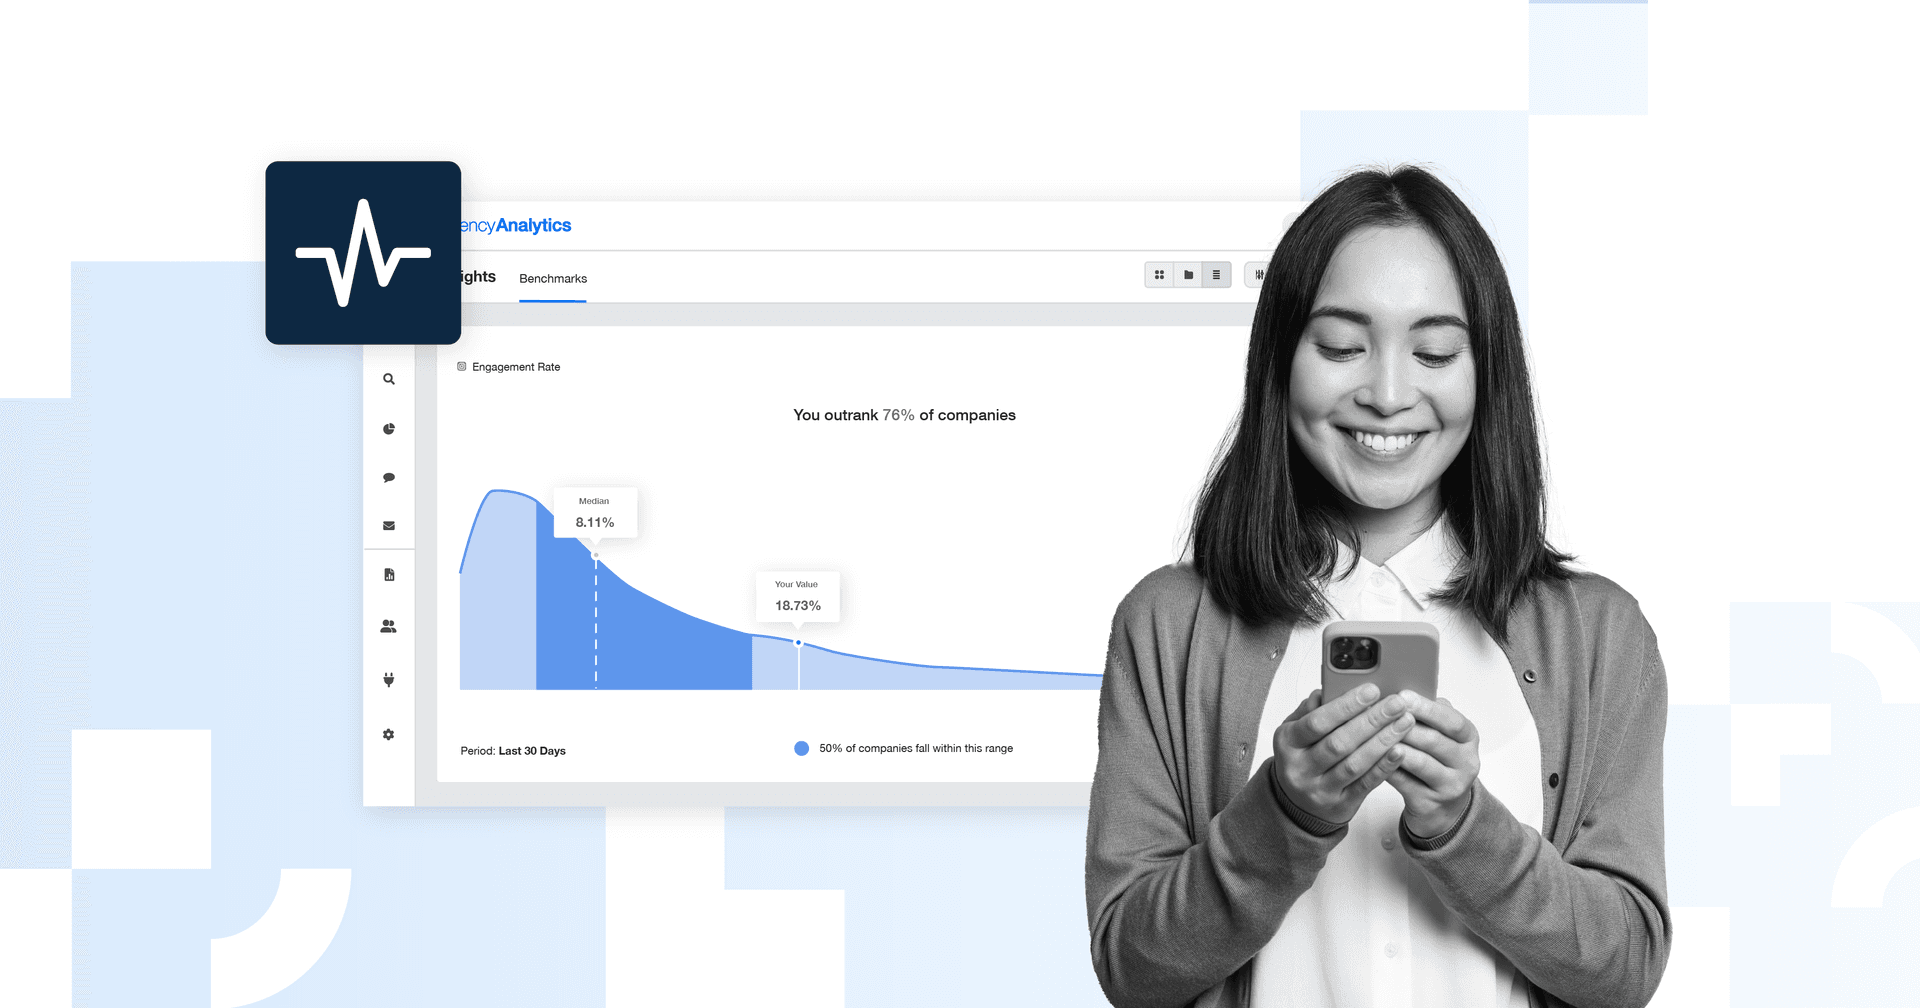
Easily report on performance metrics, both at the granular and macro-level. Access industry-specific benchmarks, forecasted metric trends, and more–try AgencyAnalytics, free for 14 days.
Set Realistic, Data-Driven Goals
Benchmarks are critical for setting goals that make sense within the broader market landscape.
When clients fall below the median, don’t think of it as a failure–it means there’s a clear opportunity for growth. Use benchmarks to back up your recommendations and show that your strategy is grounded in relevant data.
For example:
If audience growth is below the benchmark median, consider ramping up content frequency, refining messaging, or launching engagement-driven campaigns.
If engagement rates are underperforming, test new formats, creative angles, or timing to better connect with the target audience.
If conversion metrics fall short of industry medians, audit the funnel from click to action. Review landing page clarity, calls to action, and how well the content sets expectations.
That said, remember that benchmarks are a guide, not a hard rule. While exceeding them is a win, falling just shy may still indicate strong performance. For example, if a client’s engagement rate is slightly under the industry median but steadily improving month over month, that’s forward momentum. Similarly, a campaign might underperform on one metric but drive strong results in another area (e.g., website visits or conversions). Always balance data with context to tell a compelling story.
Summary: Tracking Key Metrics on Social Media
Clear, effective reporting starts with knowing which metrics actually matter and why.
Whether the goal is to boost engagement, increase conversions, or grow long-term brand visibility, the right metrics are tied to business outcomes. They give your team the ability to spot what’s working, catch what’s not, and show clients how their strategy is performing.
Instead of pulling data manually or jumping between social media channels, use a reporting tool like AgencyAnalytics to:
Automate data retrieval across 80+ platforms, including Facebook, Instagram, LinkedIn, YouTube, and more.
Monitor performance via real-time dashboards that are fully customizable, easy to understand, and beautifully designed.
Easily track key social media metrics across multiple channels, including engagement, follower growth, CTR, and conversions.
Generate white labeled social media analytics reports that reflect your agency’s branding and demonstrate professionalism.
With everything in one place, you’ll spend less time chasing data and more time driving results.
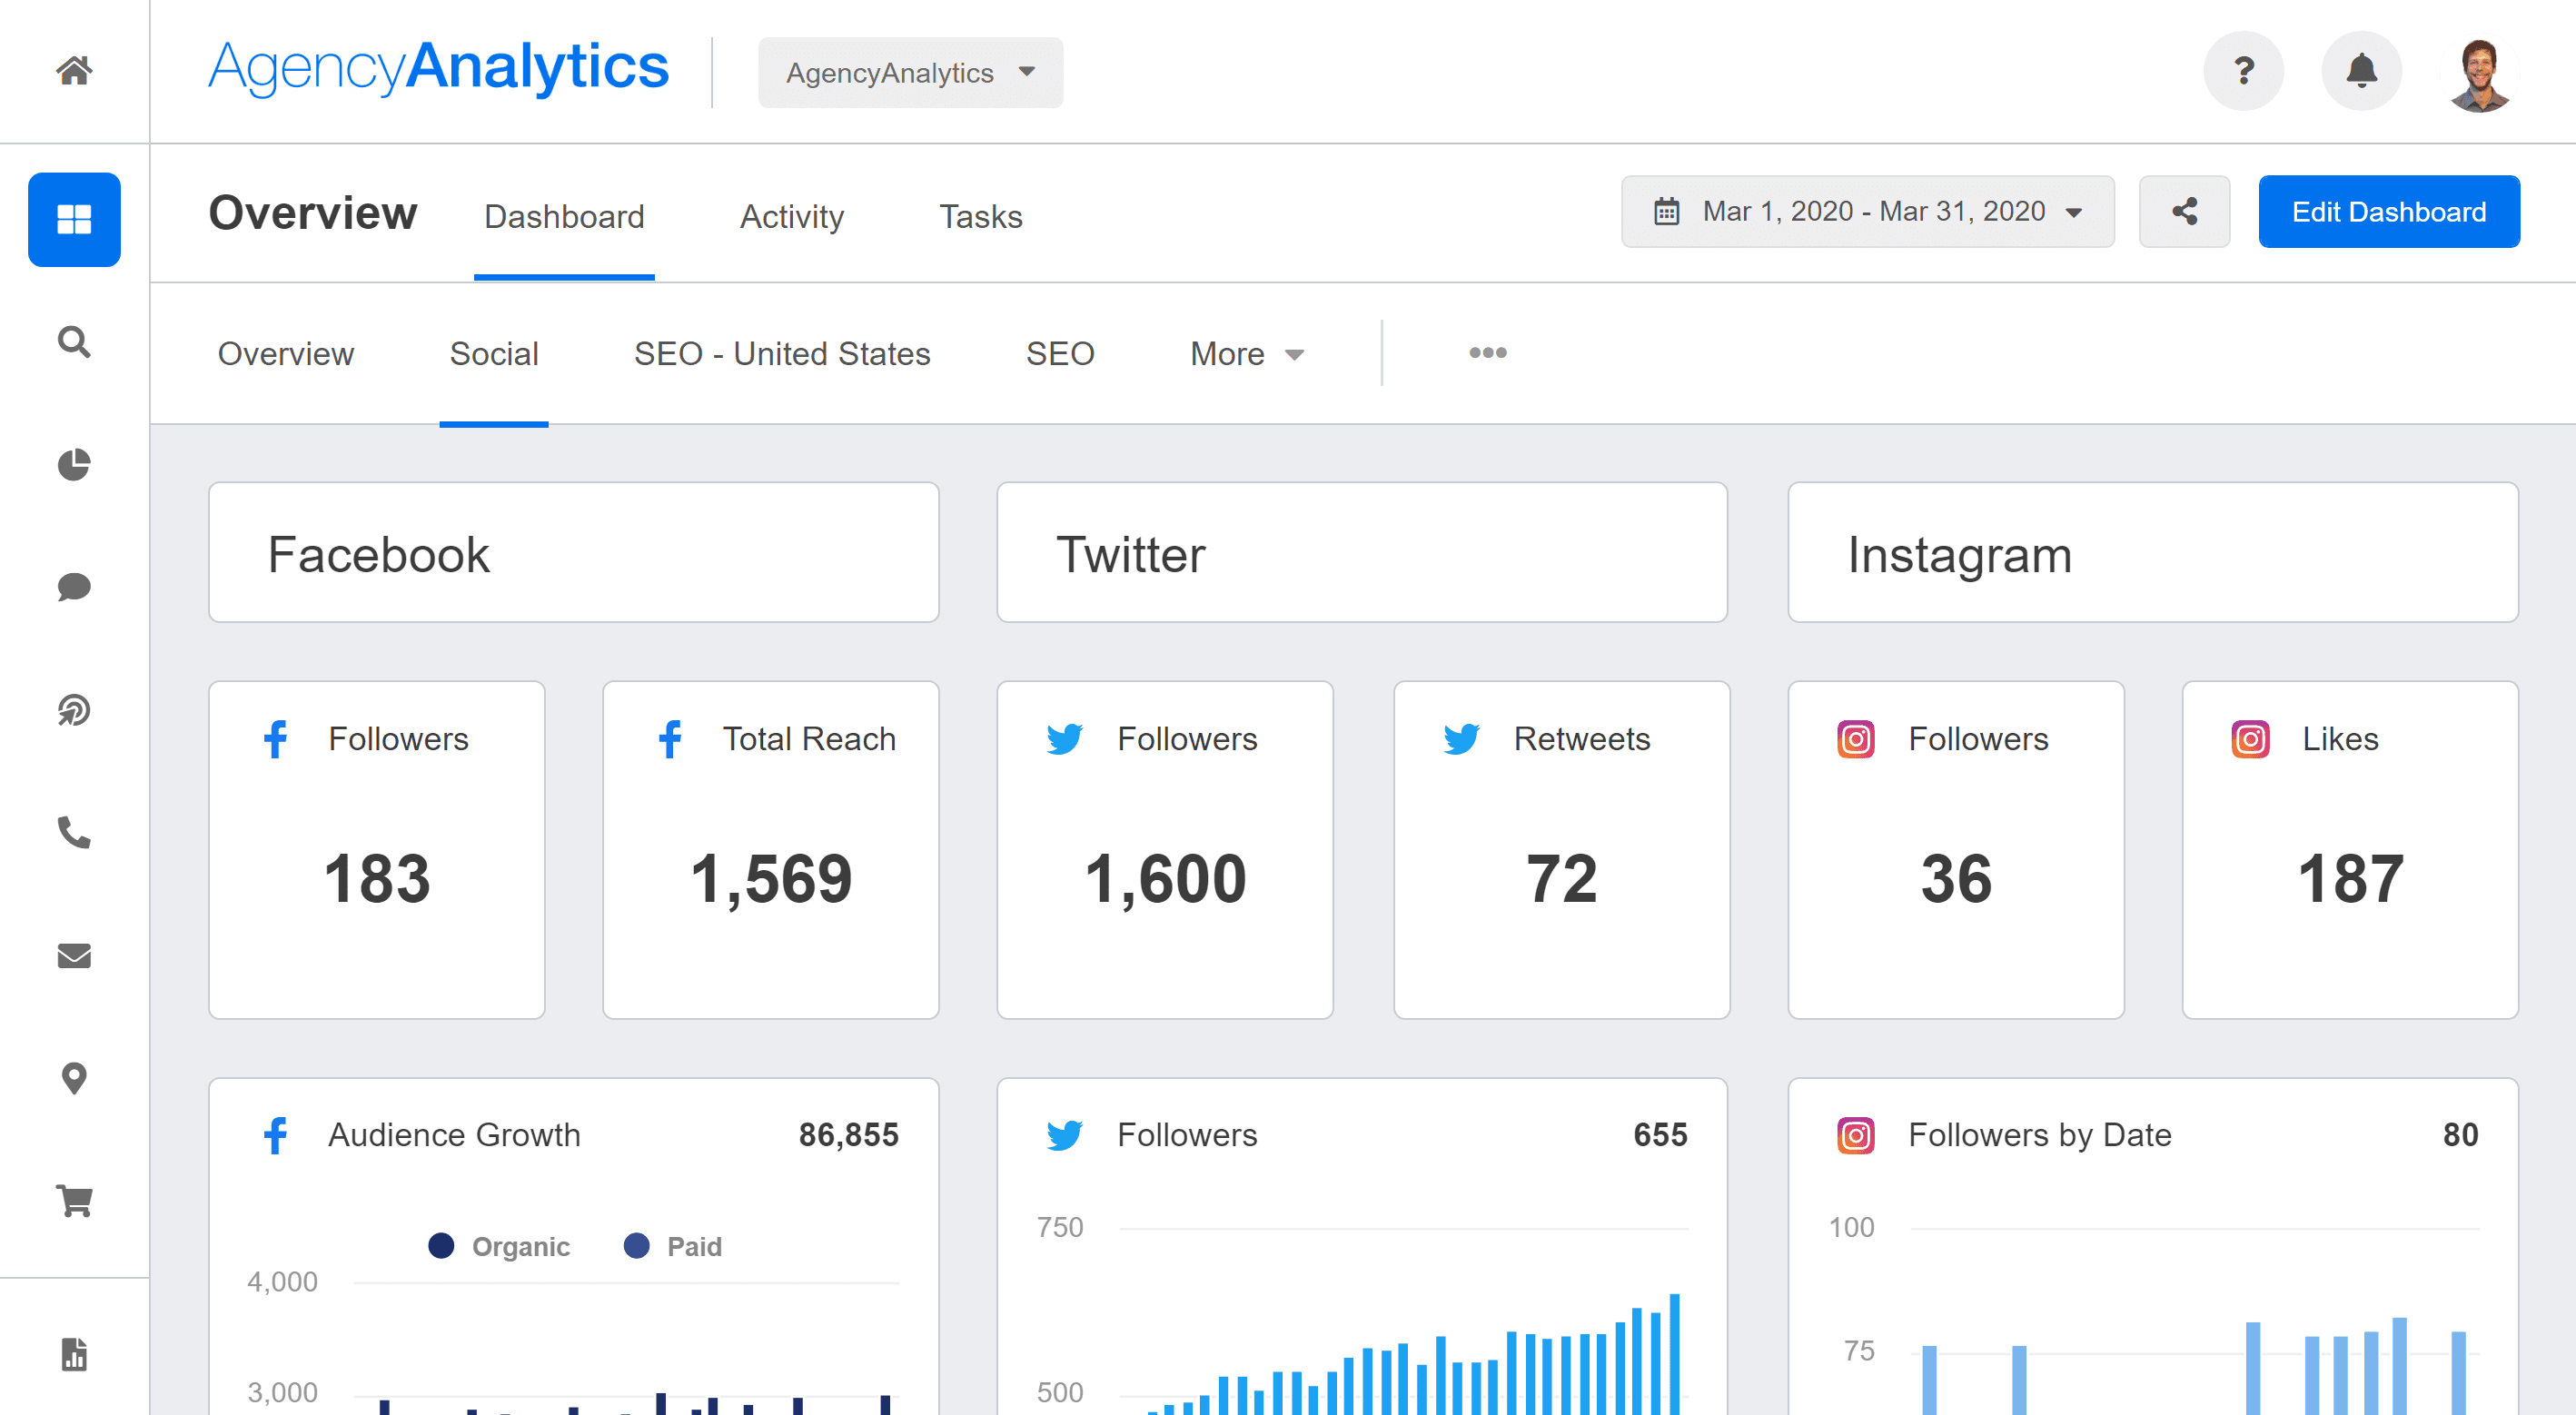
Use a dedicated social media dashboard to prove ROI and show why your agency is worth partnering with. Track social media impressions, CTR, and other key metrics with AgencyAnalytics–it’s free for 14 days.

Written by
Faryal Khan is a multidisciplinary creative with 10+ years of experience in marketing and communications. Drawing on her background in statistics and psychology, she fuses storytelling with data to craft narratives that both inform and inspire.
Read more posts by Faryal KhanSee how 7,000+ marketing agencies help clients win
Free 14-day trial. No credit card required.


