Table of Contents
QUICK SUMMARY:
A digital analytics dashboard is a reporting tool that’s used to track real-time performance, spot trends, and facilitate data-driven decisions. By having key metrics in one dashboard, agencies reduce manual work, improve reporting accuracy, and stay focused on client goals. This article explores the importance of digital analytics dashboards, top features to look for, and six dashboards worth using.
In the early days of running an agency, it’s possible to get by with screenshots, spreadsheets, or a starter tool like Google Data Studio. But as your client roster grows, the cracks start to show.
At some point, you’ll likely end up bouncing between platforms, hunting down numbers, and trying to piece things together by hand. Needless to say, it’s messy, time-consuming, and hard to scale. It’s a risk for your agency, too. Reporting the wrong numbers could become catastrophic, especially for clients with significant budgets or data governance requirements.
That’s where digital analytics dashboards come in. They pull key metrics into one place, update automatically, and provide instant access to the most important data. It’s a way to reduce the likelihood of human errors, ensure consistency, and strengthen reporting accuracy.
In this guide, we’ll cover what a digital analytics dashboard actually is, why it matters for agencies, and the key features to look for. We’ll also share six dashboards your team should use to save time, stay organized, and keep the focus where it should be—on performance.
What Is a Digital Analytics Dashboard?
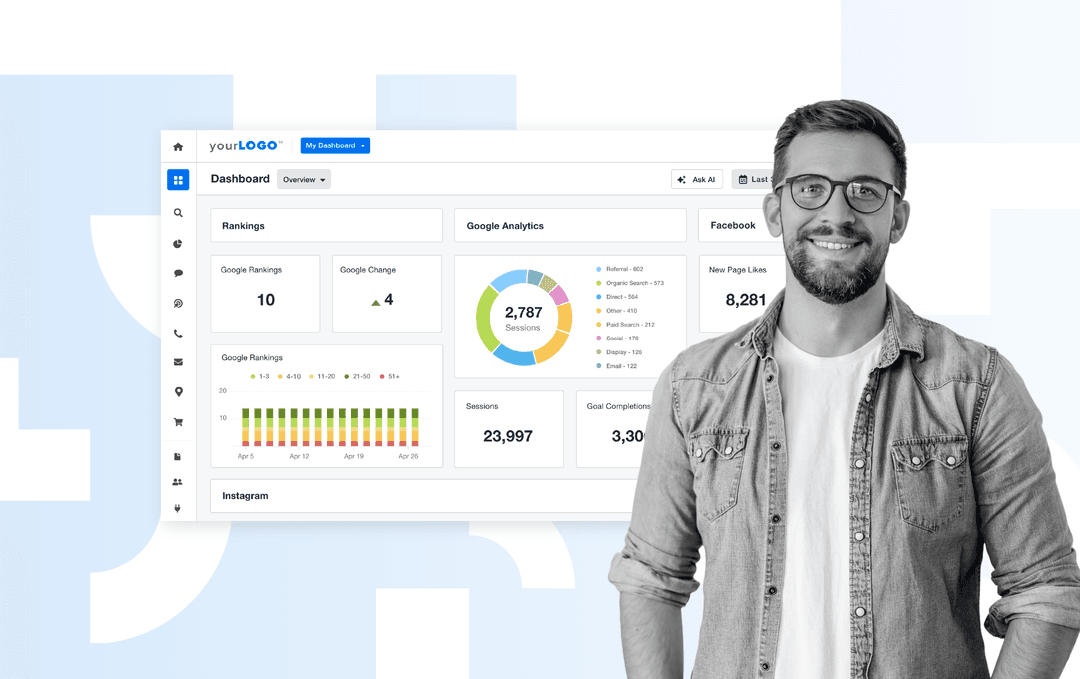
A digital analytics dashboard is a visual interface that centralizes data from various marketing channels into a unified marketing analytics view. It replaces the need for manual data compilation, giving instant access to real-time campaign performance.
For agencies, this tool streamlines reporting and surfaces opportunities (or issues) faster. It also presents data in a way that’s actionable for both internal marketing teams and clients.
More specifically, a digital marketing dashboard is used to:
Show Trends Clearly: Visual charts and graphs make it easier to spot patterns in performance across time, platforms, or channels.
Track Real-Time Performance: Metrics update automatically, so your team won’t have to refresh individual tools or wait for monthly data exports.
Flag Issues Early: Whether it’s a drop in conversions or a spike in bounce rate, dashboards bring problem areas to the surface right away.
Support Client Communication: Dashboards offer a shared source of truth for campaign performance. This makes check-ins and strategy reviews much more productive.
By using a real-time dashboard, your agency stays on top of performance, tracks goal progress, and makes timely adjustments when needed.
Why Digital Analytics Dashboards Matter for Marketers
Reporting is how progress becomes visible.
It should tell a data-backed story–one that reveals trends, highlights what’s working, and points to areas that need attention. This level of transparency gives clients confidence, too. They see exactly where their budget is going, whether it’s generating qualified leads from Google Ads, boosting organic traffic through SEO, or driving stronger engagement on social.
A client's active campaign dashboard and final report showcase our work. It's important that we present campaign metrics accurately in an easy-to-digest format. That way, we easily identify campaign optimizations, whether in real-time or as a takeaway for future campaigns.
Ashlee Brown, Campaign Performance Manager, i76 Solutions
Client needs aside, dashboards solve a common agency pain point: Tedious, time-consuming data collection.
Without them, digital marketers often get stuck toggling between platforms, triple-checking spreadsheets, and relying on outdated numbers. This approach is error-prone and simply not sustainable.
A dashboard keeps live, accurate data in one place—ready for internal reviews, client meetings, or last-minute requests. Everything’s organized, visual, and easy to understand, which significantly reduces reporting friction.
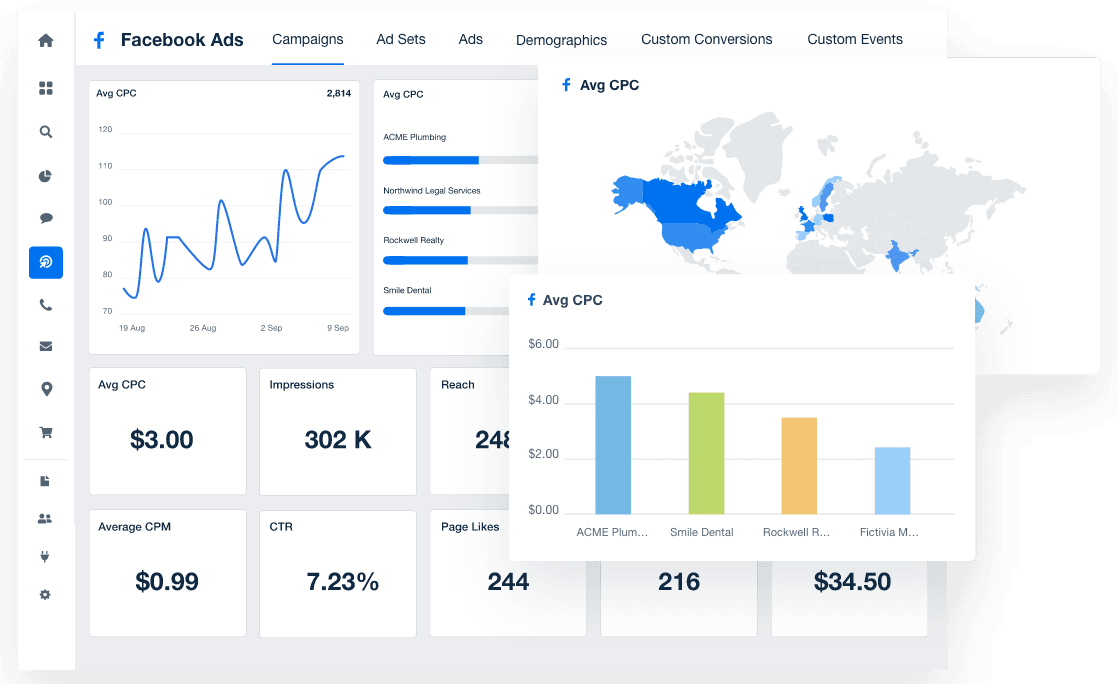
Consolidate insights across multiple analytics platforms with one tool. Create dashboards, visualize data, and easily connect integrations–explore AgencyAnalytics, free for 14 days.
Key Features To Look For
When it comes to dashboards, functionality matters just as much as aesthetics. After all, you don’t want to impress a client with a sleek layout, only to end up with missing metrics or clunky navigation. Not sure where to begin? Here are a few must-have dashboard features to look for.
Feature | What To Look For |
|---|---|
Multi-Platform Integrations | Your dashboard software should connect with the platforms your agency uses (e.g., Google Ads, Google Analytics, LinkedIn). This ensures data flows in automatically and reflects the full picture of performance. |
Real-Time Data Syncing | Choose a tool that updates automatically. That way, you’re always looking at the latest numbers, not outdated figures. |
White Labeling Capabilities | Reporting is also an extension of your agency’s brand. The ability to add your agency’s logo, colors, and custom domain keeps everything looking polished, professional, and consistent. |
Clients often want on-demand access to their own data. Invest in a tool that offers the option to create login profiles, which provides data transparency and a more comprehensive reporting experience. |
The right tool makes it easier to track performance, keep deliverables in check, and share insights clients actually care about.
Best Digital Analytics Dashboards for 2025
Client needs vary, and their dashboards should reflect that. Whether you're focused on SEO, paid media, or a full-funnel view, it's important to choose a dashboard that aligns with client goals.
Here are six high-impact digital analytics dashboards every agency should know about.
Social Media Analytics Dashboard
A good social media dashboard tracks performance across multiple analytics platforms, such as Facebook, Instagram, LinkedIn, and TikTok. It’s a fast way to compare results, monitor behavioral analytics, and identify top-performing content—all without switching between accounts.
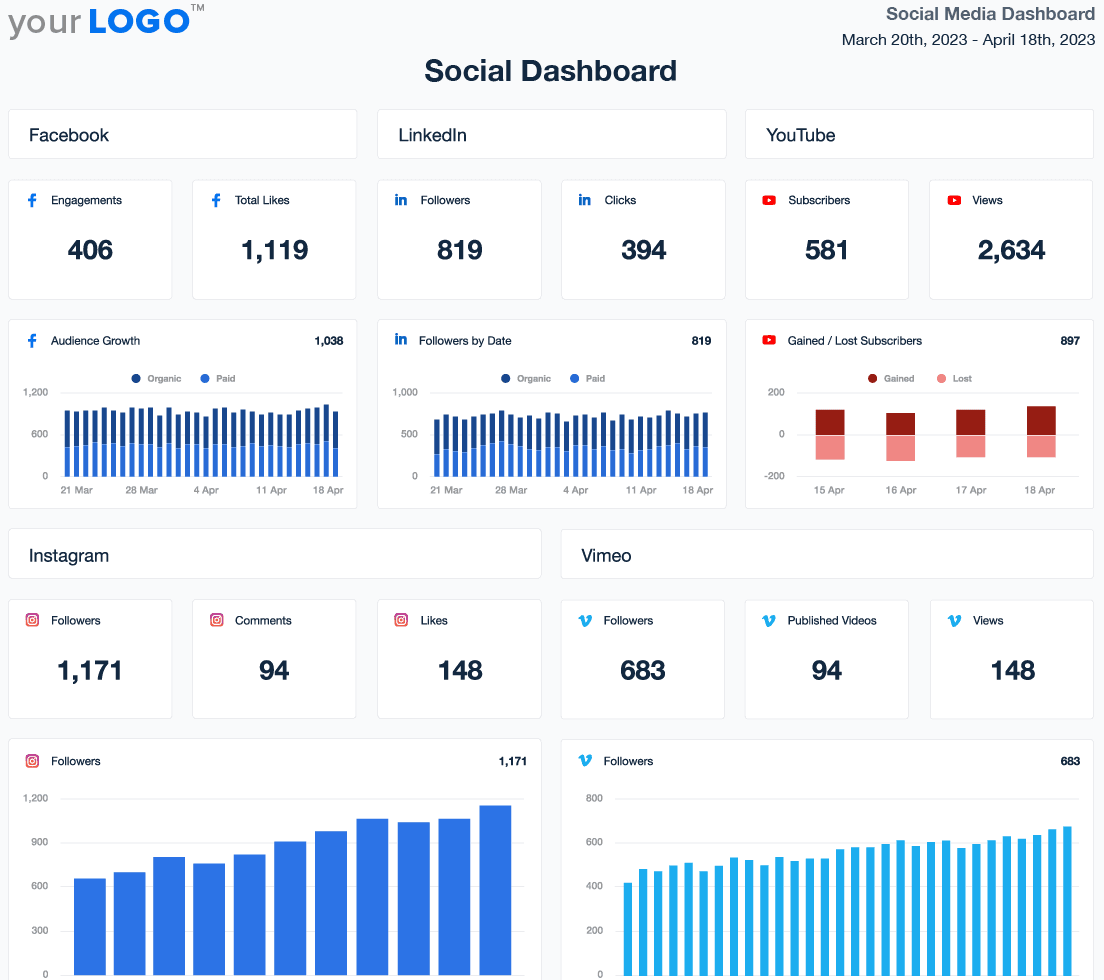
Use this dashboard to:
Track Organic and Paid Metrics Side by Side: Compare how boosted posts campaigns perform against organic content. Use this data to inform content strategy and ad spend decisions.
Highlight What’s Working and What Needs Tweaking: Spot top-performing posts, declining engagement, or overspending. Then, double down on what’s working or pivot quickly where needed.
Save Hours of Monthly Manual Reporting: Automate cross-platform reporting and spend less time compiling data. This gives your team more time to focus on strategy and content planning.
SEO Analytics Dashboard
SEO performance is a long game. However, it doesn’t mean reporting should be vague or hard to follow. An SEO analytics dashboard brings all key insights into one clear view. It pulls data from tools like Google Search Console, Ahrefs, and Semrush, giving clients a real-time look at their organic search performance.
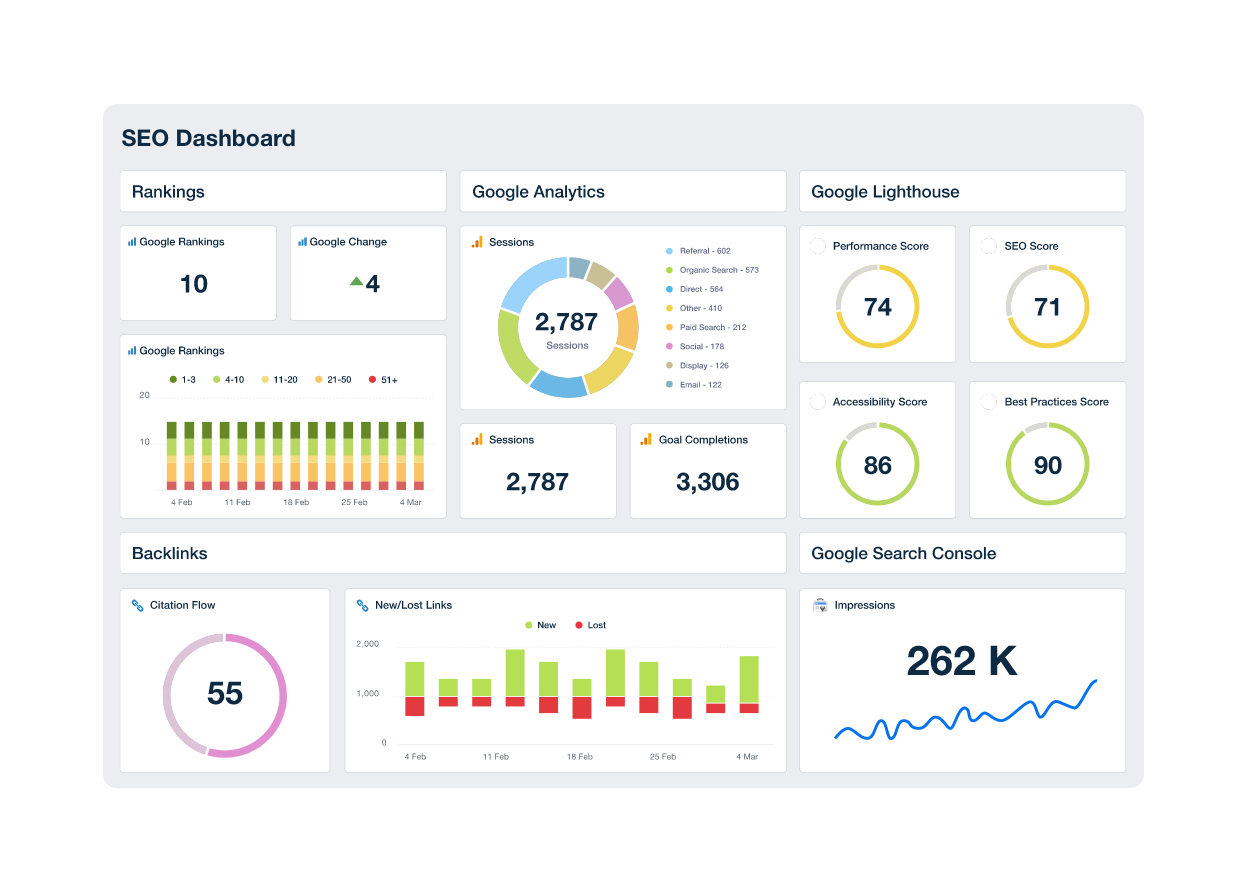
Use this SEO dashboard to monitor:
Keyword Rankings by Location and Device: Track how rankings change across specific keywords, geographic areas, and devices. This will show where visibility is increasing or slipping.
Organic Traffic and Conversion Trends: Showcase how organic sessions are translating into conversions. That way, clients will see how SEO efforts lead to real business results.
Technical SEO Issues: Quickly identify crawl issues, indexing errors, or page speed concerns before they affect search rankings.
Google Ads Dashboard
PPC clients want to know if their ad spend is paying off. And they want to see it without sorting through rows of data. A Google Ads dashboard provides an up-to-date overview of ad performance, spend, conversions, and ROI. It shows where budget is on point, which keywords are driving results, and when it’s time to adjust bidding or pacing.
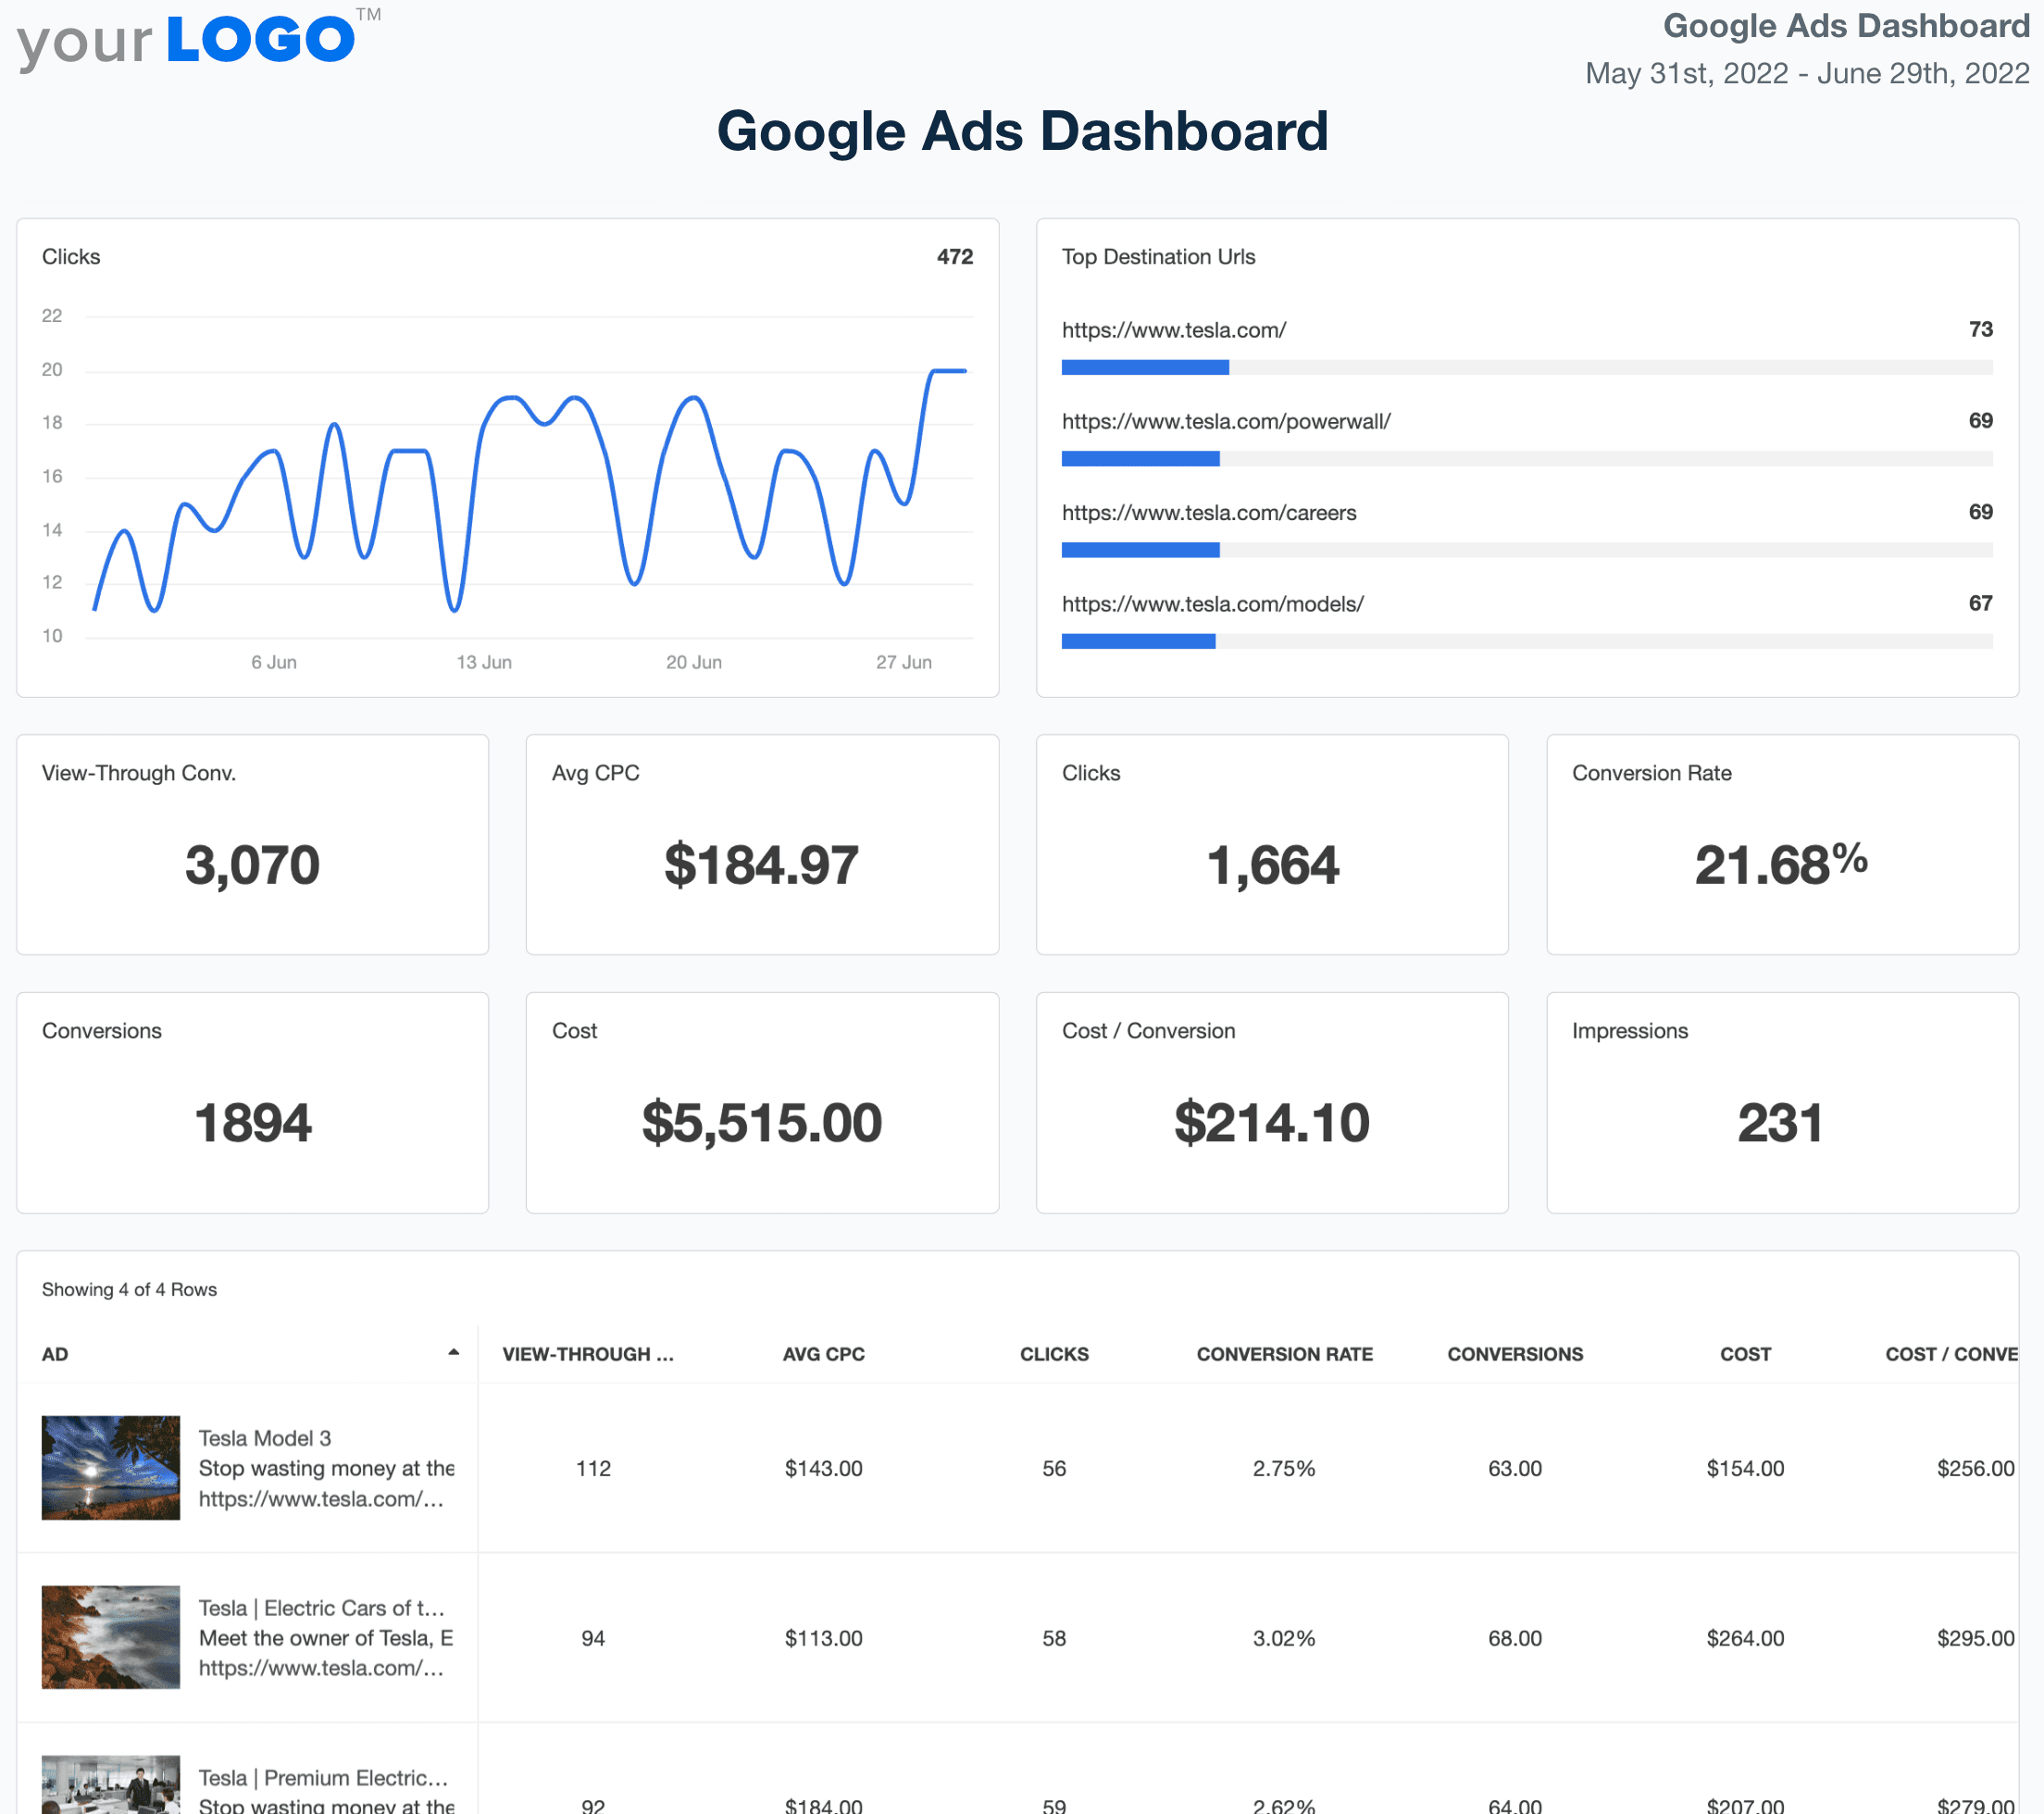
A Google Ads dashboard is handy for monitoring:
Key PPC Metrics: Quickly see key stats like impressions, clicks, CTR, conversions, ROAS, and cost per conversion.
Budget and Spend Tracking: Compare daily, weekly, or monthly spend against campaign budgets. This will avoid overspending and flag pacing issues early.
Keyword Performance: Identify which search queries and keywords are generating results, wasting spend, or triggering irrelevant clicks.
Web Analytics Dashboard
A client’s website is a critical step in the customer journey. Therefore, it’s important to understand how visitors are interacting with it.
A web analytics dashboard shows where traffic comes from, what pages users visit, and where they drop off. Spot top-performing pages, identify potential issues, and import data from top website tools (e.g., Google Analytics, Matomo).
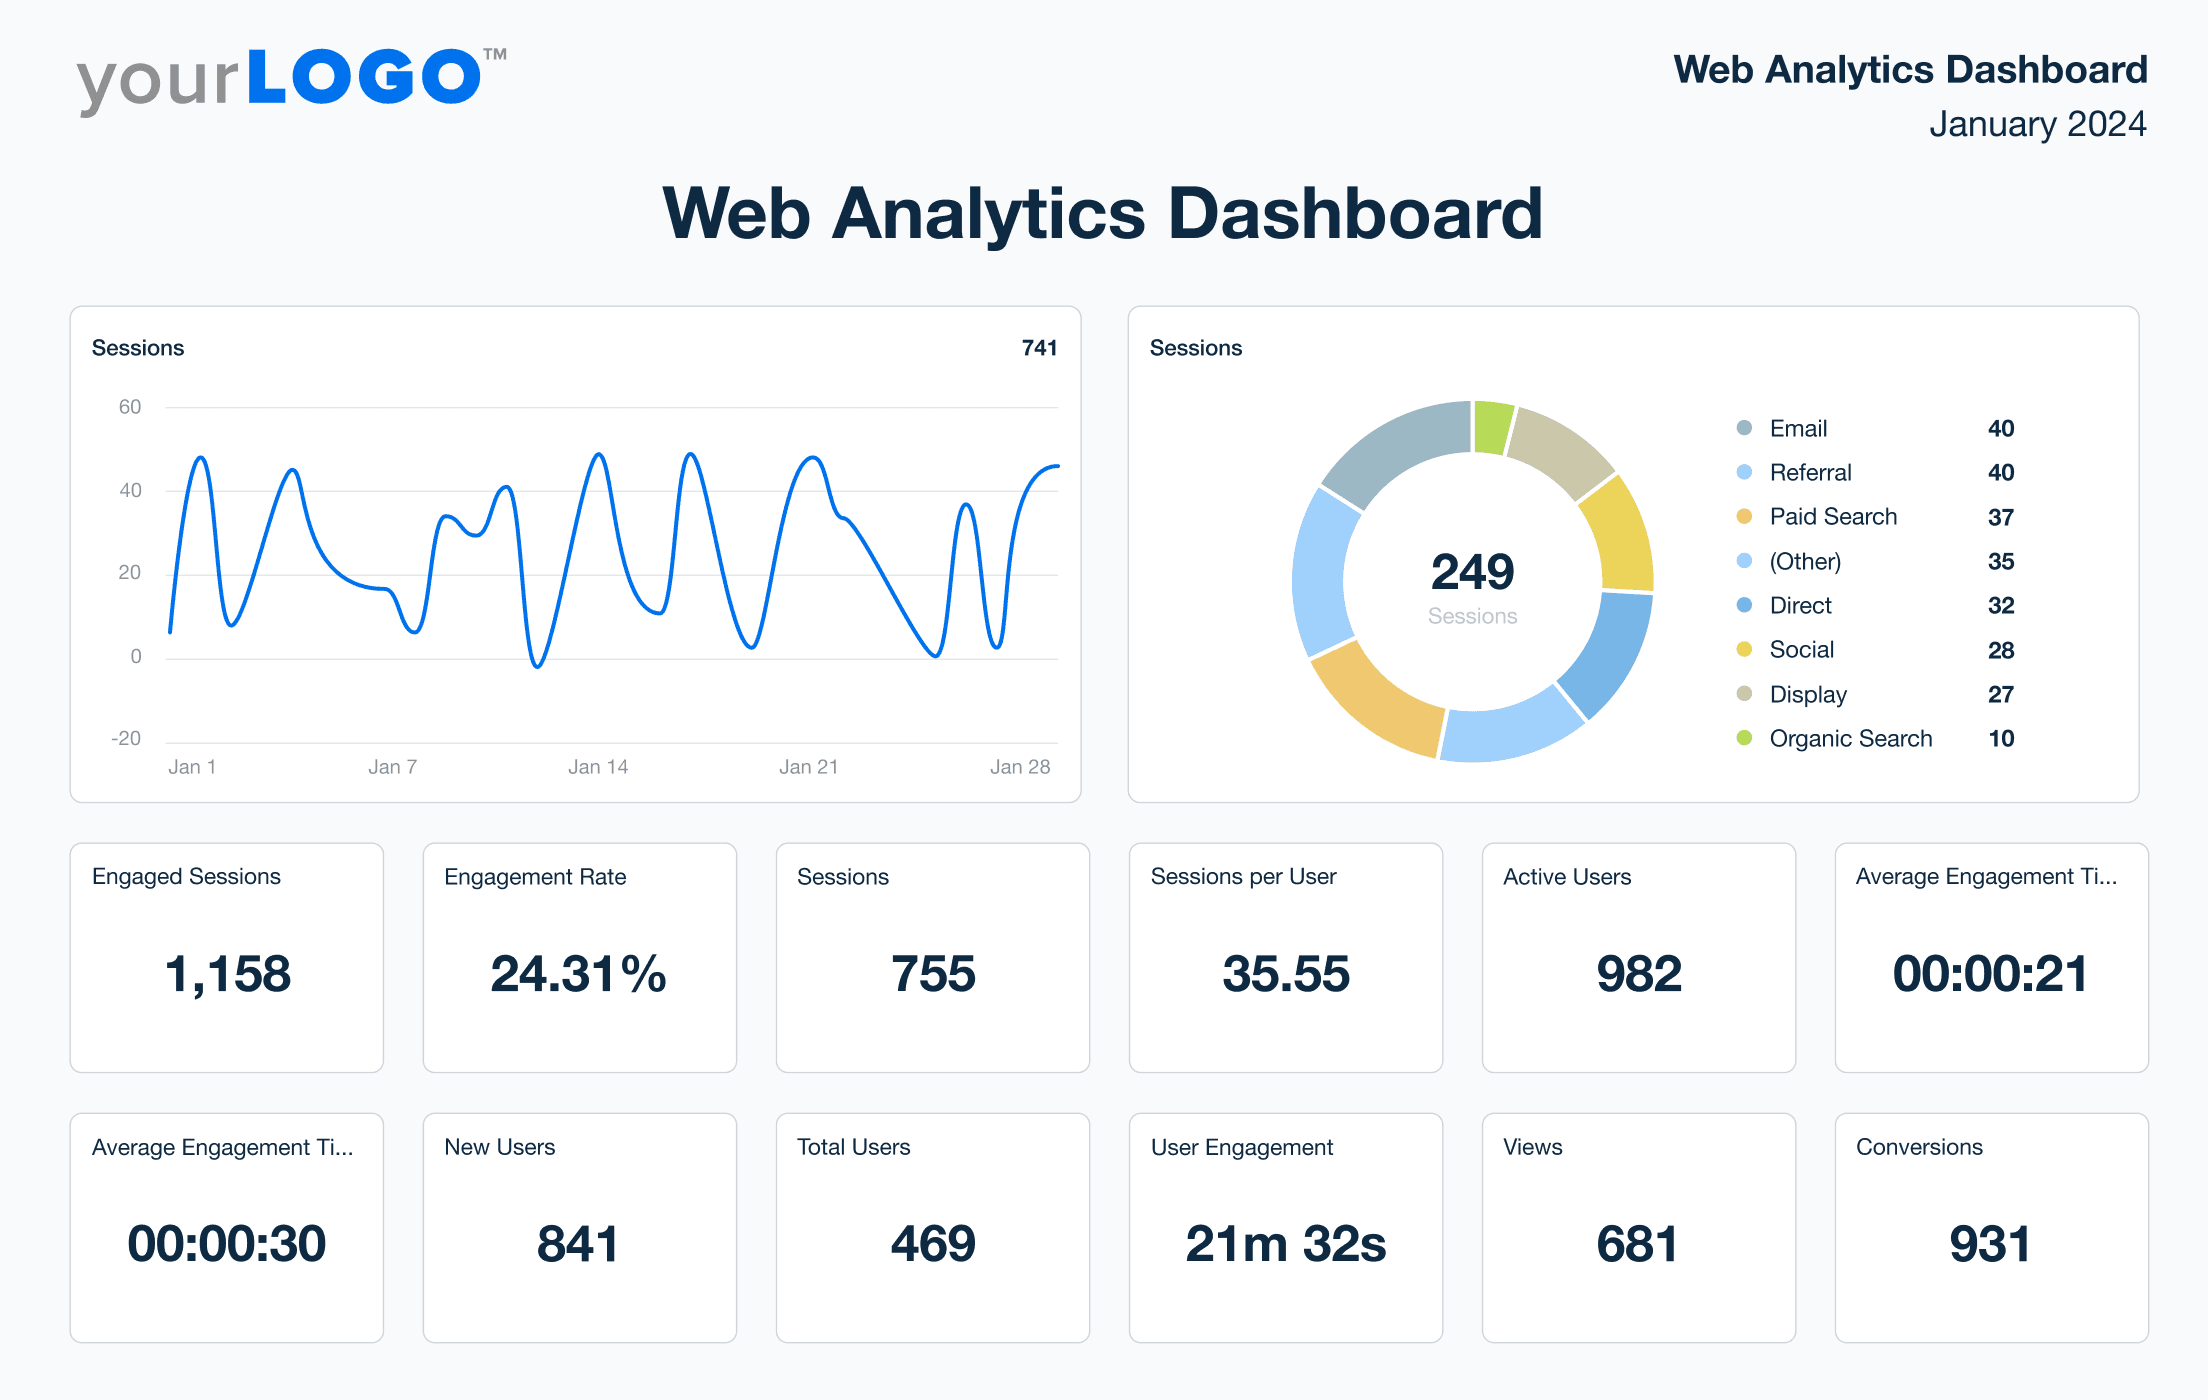
This dashboard works well to monitor:
Traffic Sources: See where visitors are coming from (e.g., organic, direct, paid, referral, or social). Use this data to identify the channels that are driving the most engagement.
User Behavior Insights: Track key metrics like average time on page, bounce rate, and pages per session. This provides a deeper look into how users navigate the site and where they may be losing interest.
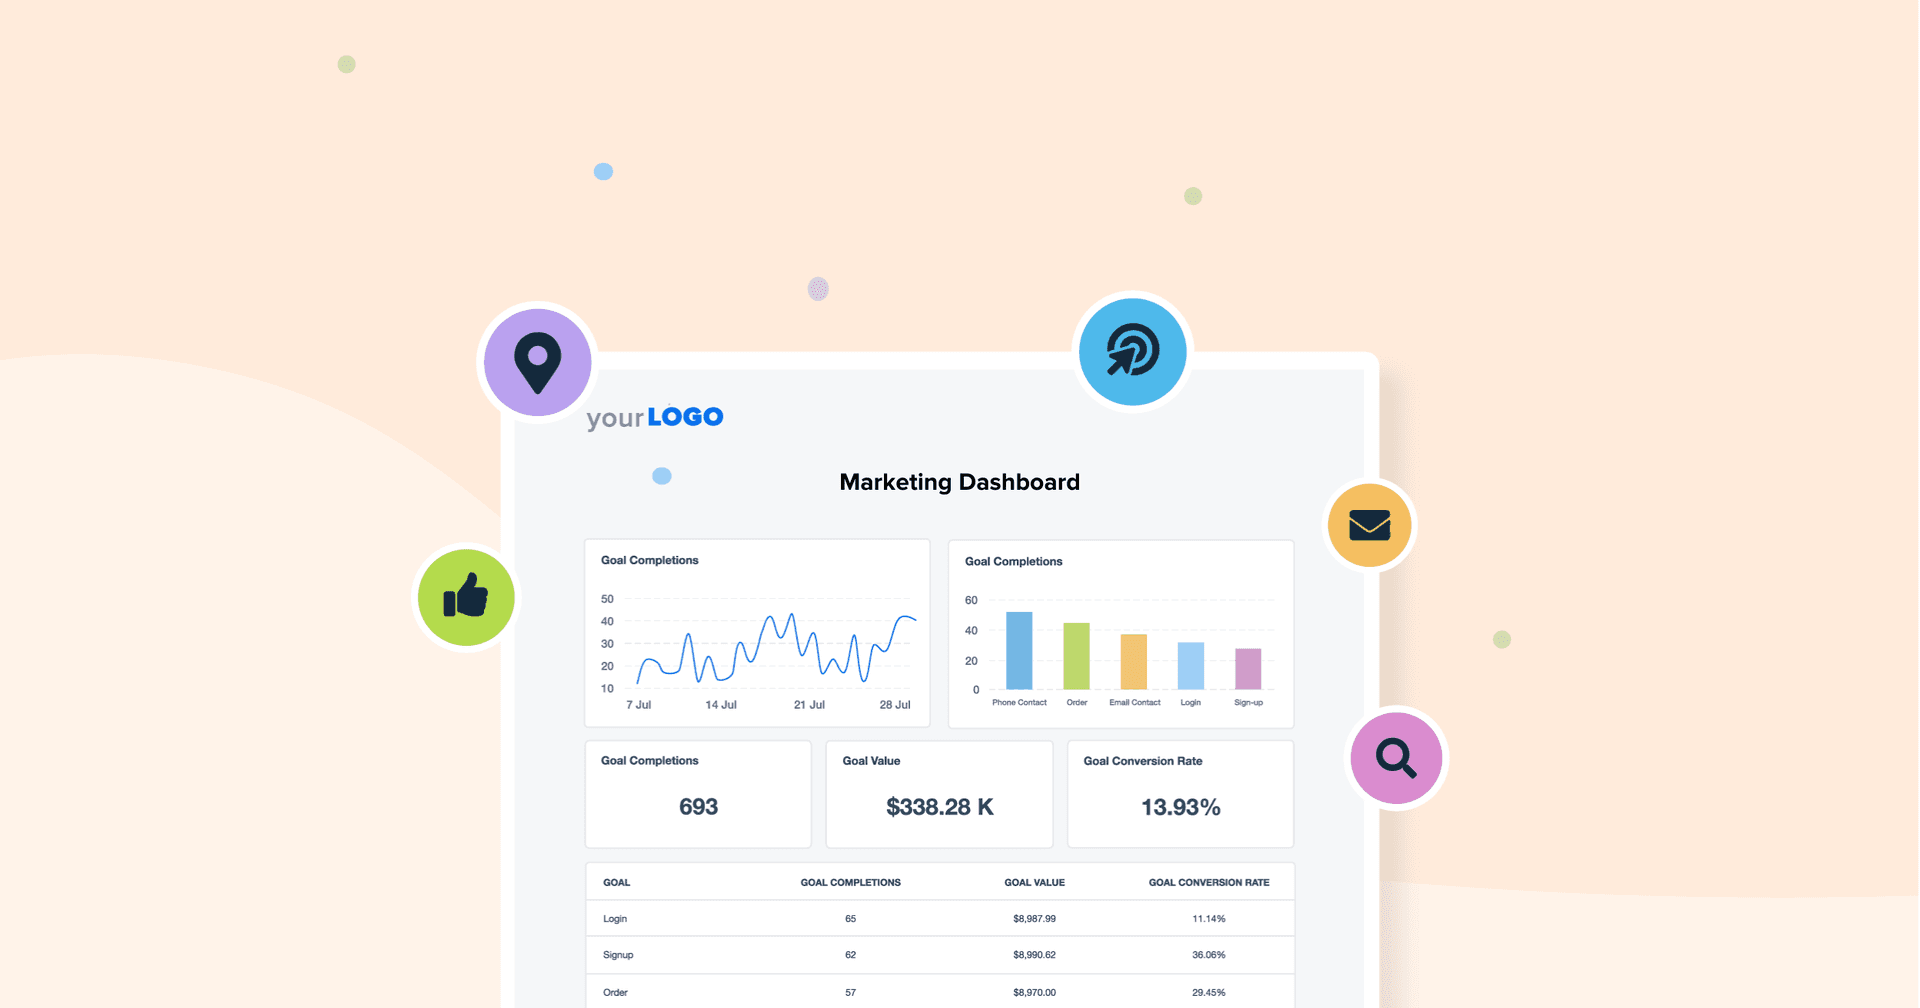
Goal and Event Tracking: Visualize performance against defined goals, like form submissions, downloads, or purchases. That way, you’ll demonstrate how your client’s site contributes to lead generation or sales.
Digital Marketing Analytics Dashboard
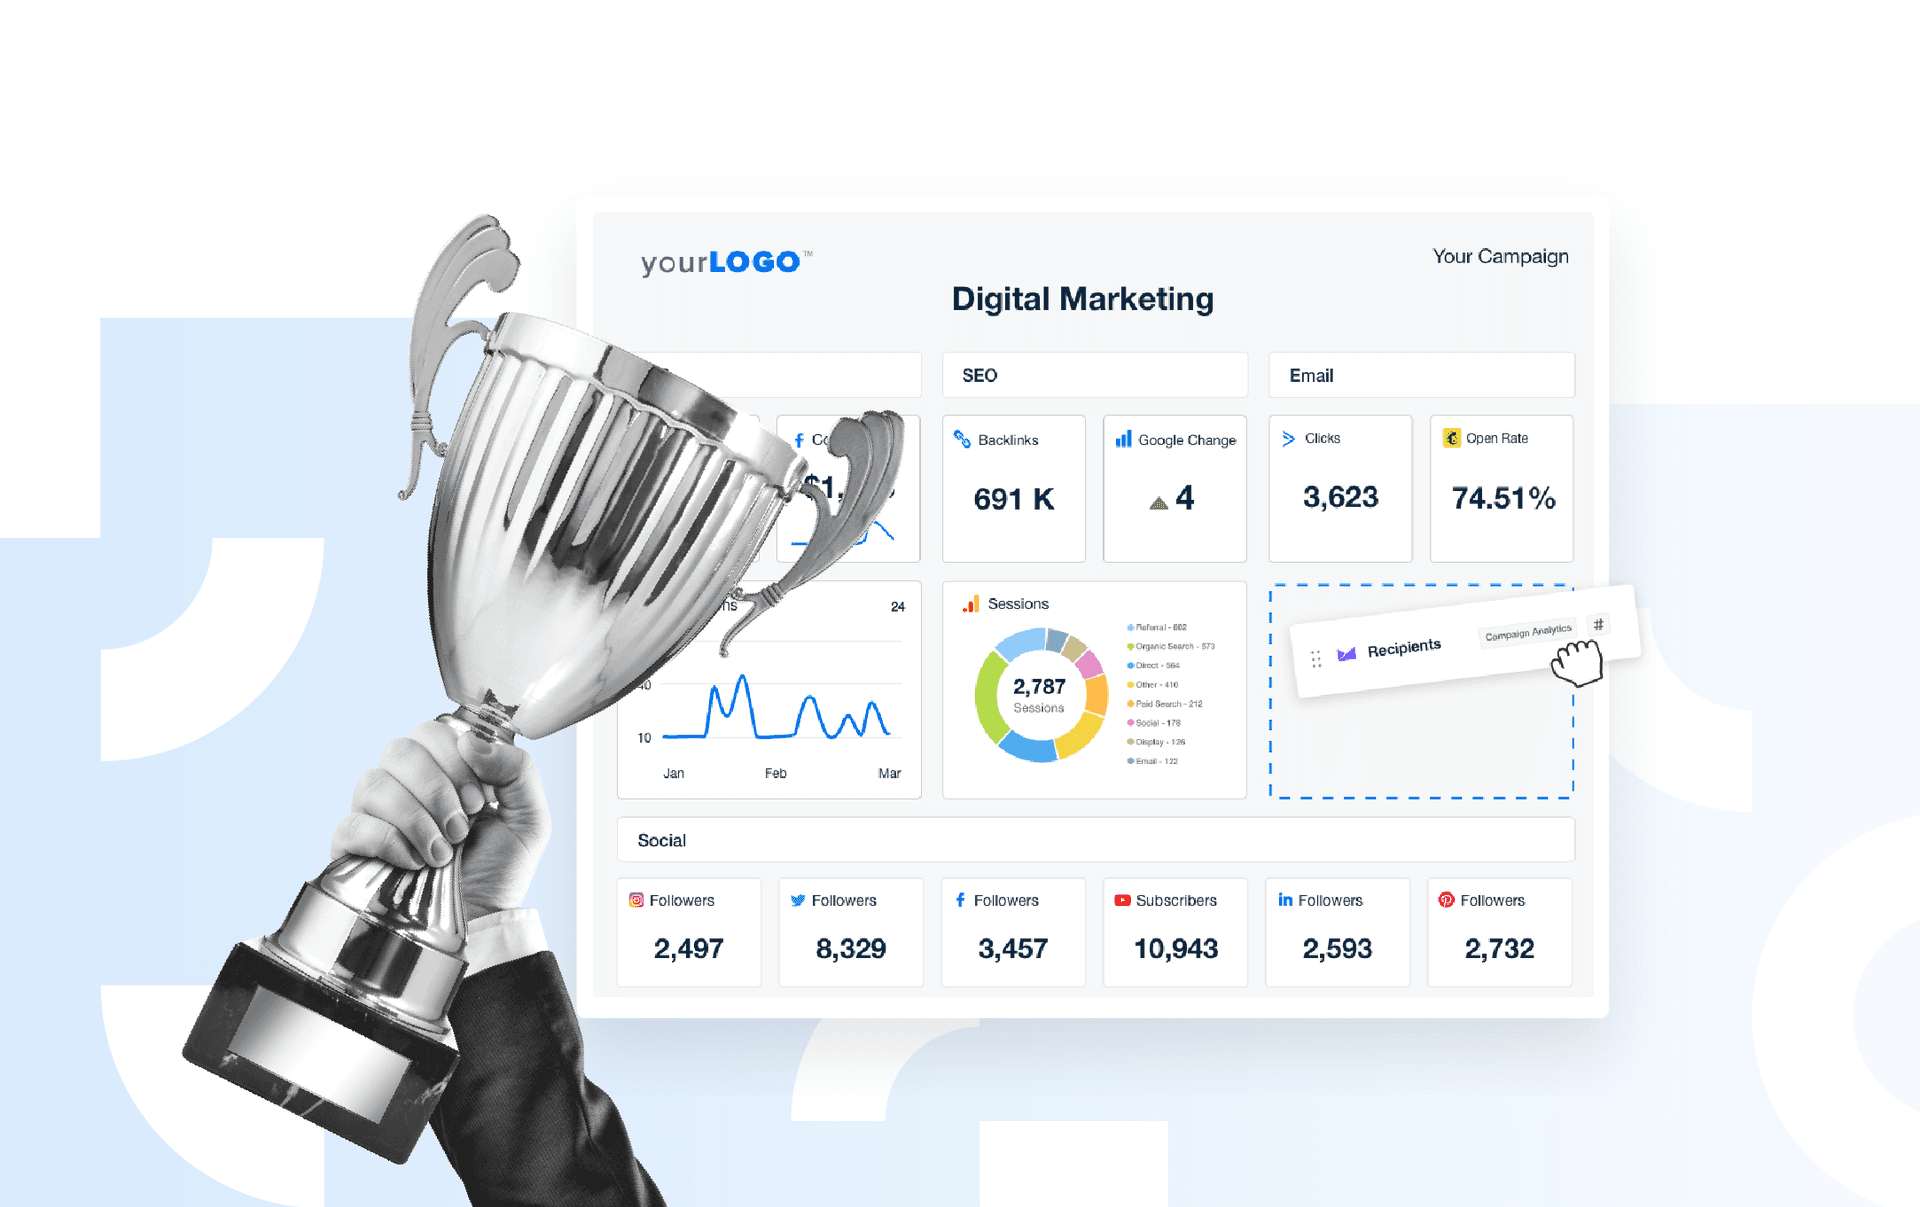
When campaigns span multiple platforms, it’s easy for data to get fragmented. A digital marketing analytics dashboard connects the dots, showing how each channel contributes to overall marketing performance. Consolidate SEO metrics, paid ads performance, social media insights, and more.
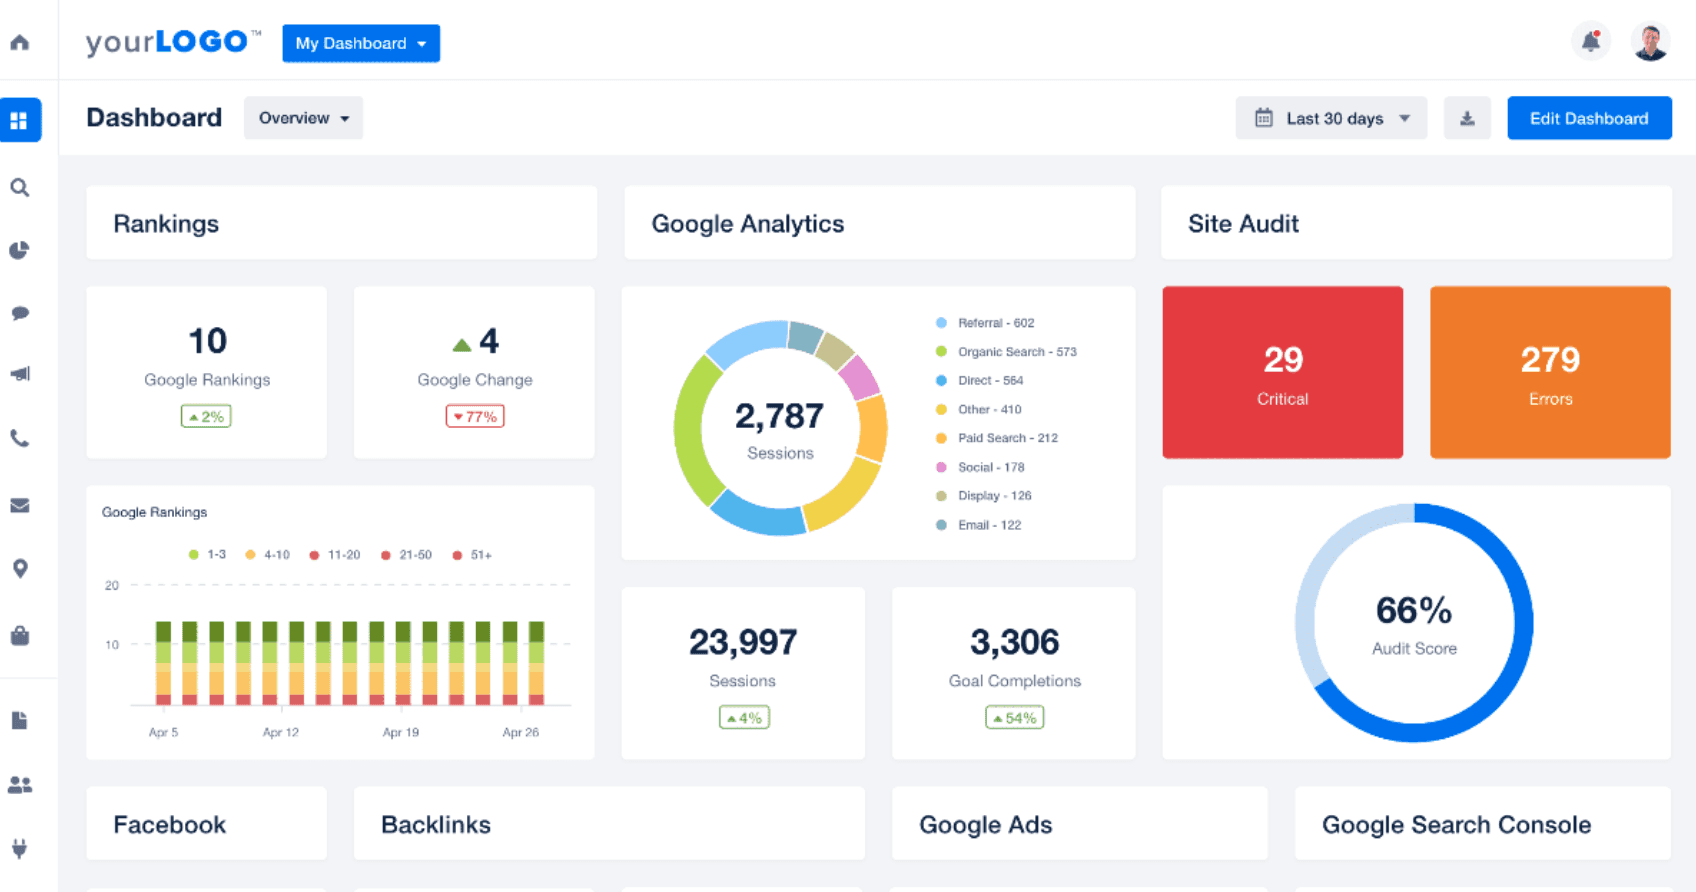
Use this dashboard to monitor:
Cross-Channel Visibility: Consolidate data across 80+ platforms.
Top-Level KPI Tracking: Assess campaign health by highlighting metrics like conversions, cost per acquisition, ROAS, and engagement rates.
Performance Trends Over Time: Use data visuals to pinpoint growth, stagnation, or sudden changes in campaign performance.
Email Marketing Analytics Dashboard
Email is one of the most direct ways to engage an audience. Without the right tracking, though, it’s hard to know what’s working.
An email marketing analytics dashboard brings together key performance indicators like open rates, click-through rates, bounce rates, and conversions. It allows your agency to track newsletter performance, improve future sends, and optimize email marketing campaigns.
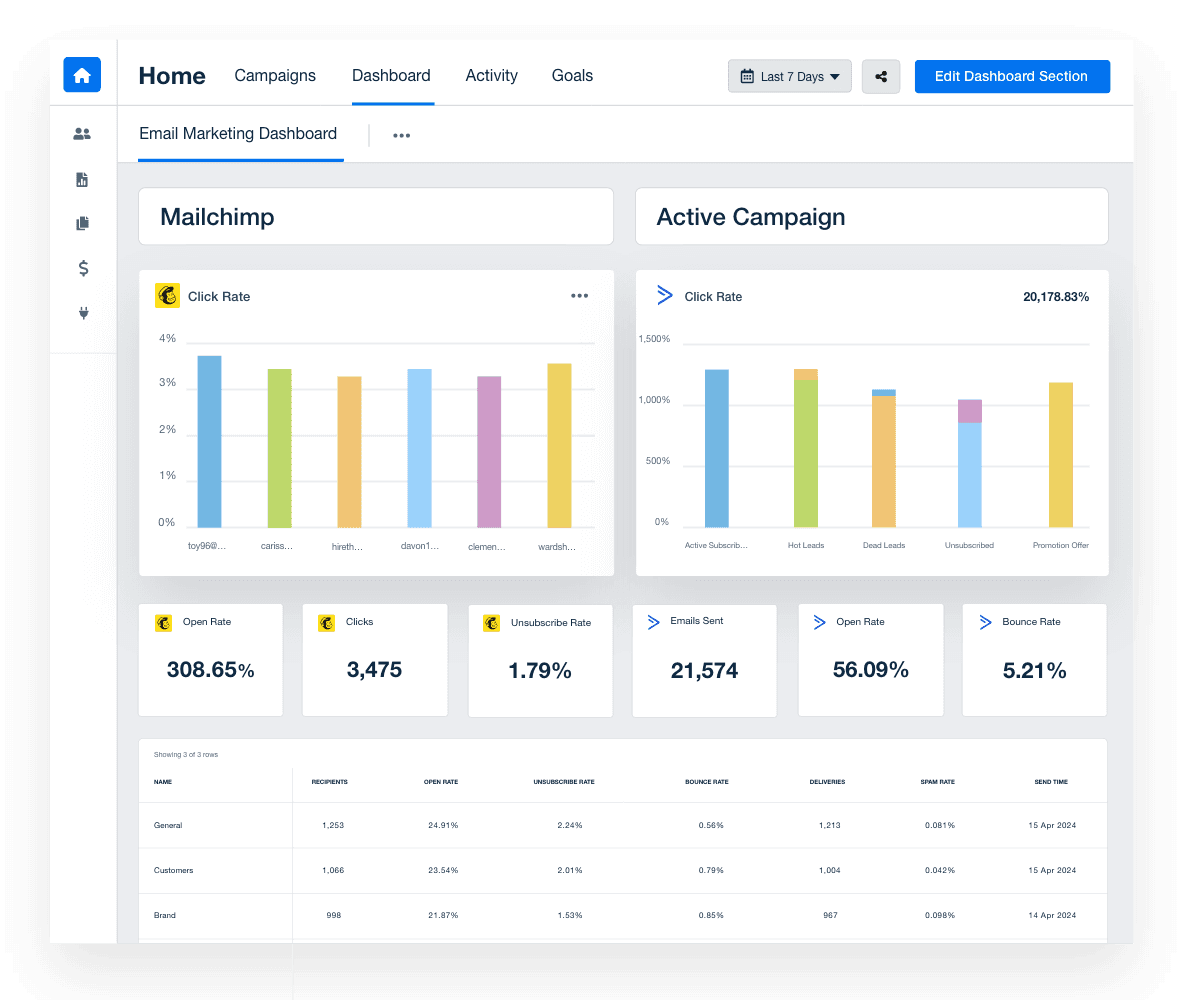
Use this dashboard to monitor:
List Growth and Engagement: Track subscriber growth, churn, and activity across campaigns to gauge overall list health.
Campaign Performance: Identify which emails lead to clicks, conversions, or revenue, not just opens.
Optimization Opportunities: Adjust subject lines, content, and send frequency based on real performance data.
How To Create a Digital Analytics Dashboard
You don’t need a developer to create a dashboard. What you do need is the right tool–one that streamlines the entire process. That’s where a platform like AgencyAnalytics comes in. Connect data sources, customize dashboards, and deliver results with one easy-to-use tool.
Ready to get started? Here are a few steps to create an impactful dashboard in AgencyAnalytics.
1. Connect Data Sources
Once goals are defined, the next step is importing your client’s data.
To get started, log in to your AgencyAnalytics account and navigate to the “Integrations” section from the left-hand menu.
After that:
Select a platform from the extensive list provided.
Follow the on-screen prompts to successfully link your client’s account.
Repeat the process for any additional integrations.
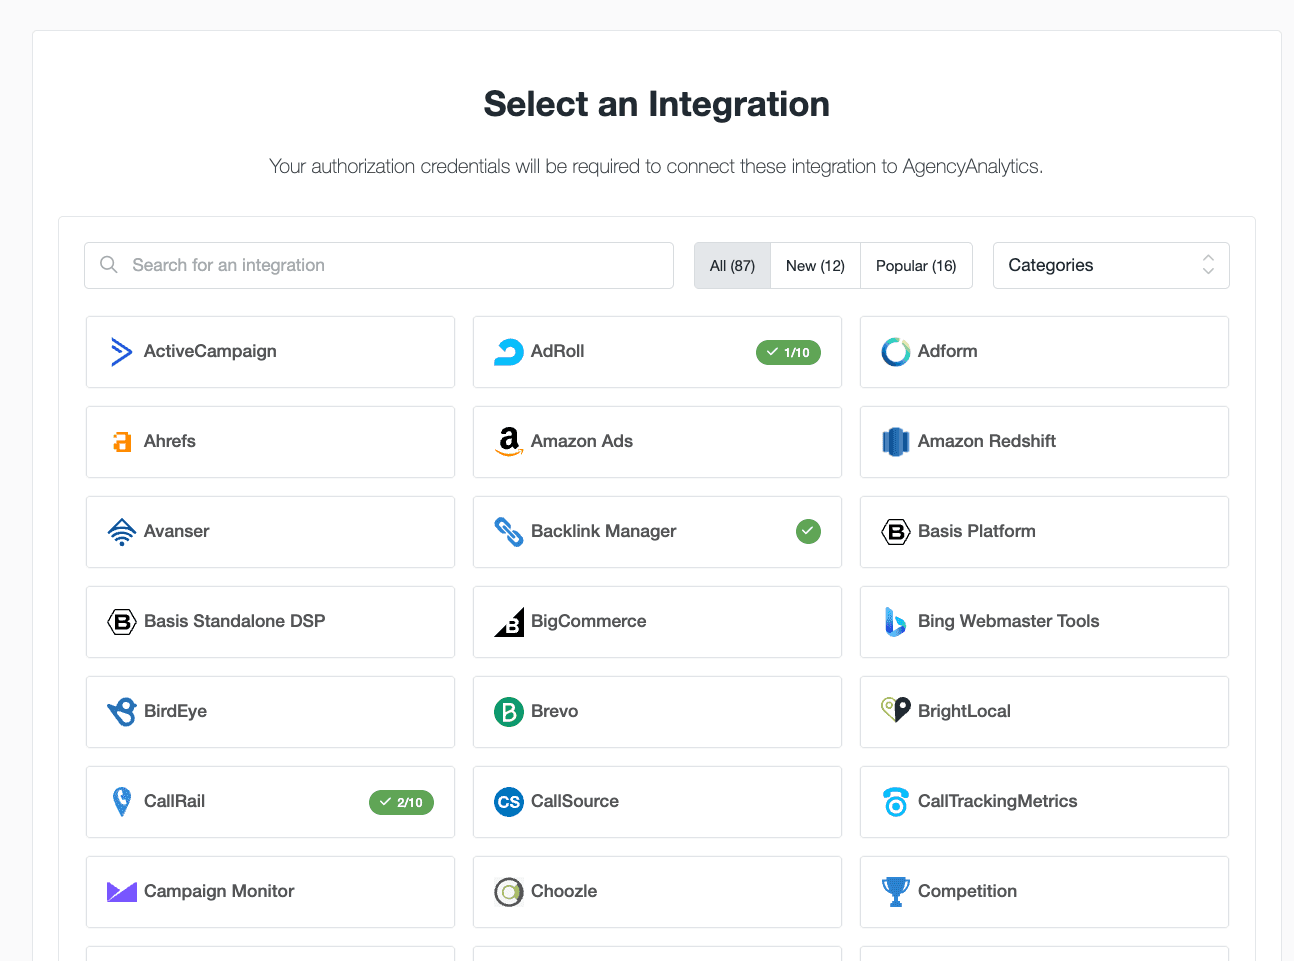
It’s that simple! No complex or time-consuming steps–just a straightforward process.
2. Pick the Dashboard Setup That Fits Your Workflow
With data sources connected, it’s time to build your dashboard. AgencyAnalytics provides multiple ways to get up and running, depending on your agency’s needs.
AgencyAnalytics’ interface is visually appealing and incredibly simple to navigate, allowing even the most non-technical team members to create comprehensive dashboards in no time. It presents essential metrics at a glance, ensuring that our clients will easily understand the results of our marketing efforts.
Alex Faiers, Founding Director, Addictivity
Here are your options:
Start from Scratch: Build a custom dashboard by adding widgets one by one. This option is ideal if a client has unique KPIs or a very specific reporting structure.
Use a Pre-Built Template: Choose from pre-built dashboard templates designed for SEO, PPC, social media, email, and more. This is a fast option when you need a solid framework that covers most use cases.
Generate a Smart Dashboard: Let AgencyAnalytics auto-build a dashboard based on your client’s connected integrations. It pulls in key metrics by default, which is perfect for a quick and easy setup. The best part? It takes only 11 seconds!
3. Customize As Needed
Add widgets, adjust layouts, or shift things around–it’s all up to you.
Every AgencyAnalytics dashboard is fully customizable, which means you don’t have to settle for a one-size-fits-all format. Here are a few ways to make it your own:
Rearrange Widgets With the Drag-and-Drop Editor: Highlight priority metrics by adjusting the layout to suit each client.
Apply White Labeling: Include your agency’s logo and color scheme for a fully branded experience.
Create Custom Metrics: Combine data points with formulas that reflect your client’s unique KPIs.
Track Goals Visually: Add goal widgets to show progress toward campaign targets in a dynamic, eye-catching way.
Include Annotations: Share additional context, explain trends, or call out wins directly in the dashboard.
Add External Data: Need to include your client’s budget forecasts or internal revenue targets? The Google Sheets integration works like a CSV file import system, letting you import extra data and display it alongside live metrics.
Customization turns a standard dashboard into a tailored reporting experience. Use it to highlight the right data, provide clarity, and keep clients in the loop.
Building a Dashboard With the Right Data
A dashboard is only as strong as the data it displays. If it’s cluttered, clients won’t know where to focus. If it’s too sparse, they’ll miss the bigger picture. For best results, here are a few actionable tips to keep in mind.
Tip | Why It Matters |
|---|---|
Align Metrics with Client Goals | Each metric should tie back to a specific business outcome, like lowering CPC or increasing engagement on social media platforms. If it doesn’t serve a goal, it shouldn’t be there. |
Structure by Marketing Channel | Group data by platform to quickly show how each channel contributes to overall results. This will also help your team troubleshoot performance issues faster. |
Focus on Actionable KPIs | Prioritize metrics that directly influence decisions, like conversion rates, CTR, or CPL. Avoid vanity metrics that don’t prompt action or tie into your client’s marketing strategy. |
Select the Right Visual Format | Use the most effective visual for each data point. Tables work best for granular breakdowns, while trendlines or bar charts highlight performance changes over time. |
Include Benchmarks and Targets | Context is critical. Show actual performance against reliable industry benchmarks for macro context and more meaningful discussions. |
Simply put, a well-structured dashboard saves time, keeps clients engaged, and makes reporting more strategic.
Final Thoughts
As we’ve covered, a digital analytics dashboard is more than a fancy display or a bunch of numbers.
It’s a powerful way to show what’s working, identify areas for improvement, and keep a watchful eye on marketing performance. When built with intent, it empowers your team to make informed decisions and shows clients the value of their investment.
With AgencyAnalytics, setting up a dashboard is quick, flexible, and easy to replicate. Whether you’re starting with a template, creating from scratch, or generating a Smart Dashboard, the outcome is the same: Clear, actionable insights your clients can trust.
Ready to reclaim billable time, enhance the customer experience, and have a data warehouse for client metrics? Invest in one platform that does it all–try AgencyAnalytics today, free for 14 days.

Written by
Faryal Khan is a multidisciplinary creative with 10+ years of experience in marketing and communications. Drawing on her background in statistics and psychology, she fuses storytelling with data to craft narratives that both inform and inspire.
Read more posts by Faryal KhanSee how 7,000+ marketing agencies help clients win
Free 14-day trial. No credit card required.


