Table of Contents
QUICK SUMMARY:
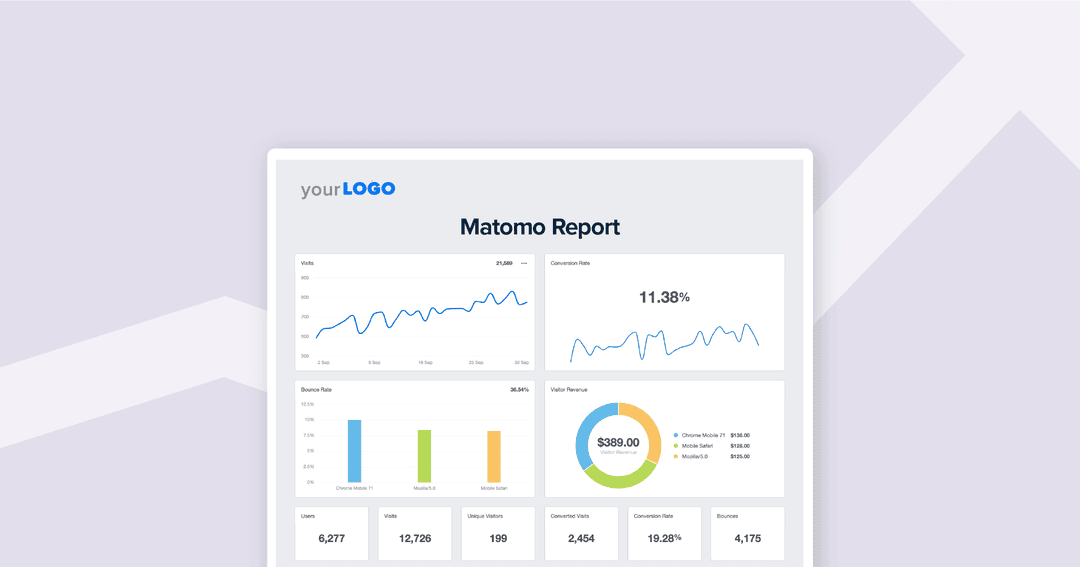
Marketers look at Matomo analytics to optimize client website performance. Matomo is an open-source platform that emphasizes data privacy and control while offering advanced tracking features. Agencies use Matomo to streamline client reporting, focusing on data like user behavior and conversions. This guide highlights the most important Matomo analytics for agencies to monitor, delivering clear, actionable insights in their monthly reports.
Managing web analytics for multiple clients is no easy feat, but choosing the right metrics is essential for delivering actionable insights.
Imagine preparing a monthly report for an ecommerce client. They don’t need to wade through complex data, but they want to know how many visitors turned into customers, which products are performing well, and where improvements can be made.
With the right Matomo metrics, agencies provide web analytics and clear, impactful reports without overwhelming clients.
For marketers who manage multiple client reports monthly, choosing the best metrics while maintaining software quality assurance through continuous integration servers and JavaScript tests is enough to make anyone’s head spin.
This guide outlines the top Matomo analytics to track for marketing agencies, simplifying monthly reporting and focusing on the data that matters most.
Let's get started.
What Is Matomo?
Matomo is an open-source web analytics platform that gives businesses and organizations advanced data tracking and reporting functionality. Unlike other analytics tools, Matomo emphasizes privacy and gives users full control over their data, allowing them to decide how it's collected, stored, and managed. The platform can be hosted on a dedicated server or accessed via the cloud, giving users complete ownership of their information.
For companies that need to comply with regulations like GDPR, Matomo is an ideal solution, and it enhances website security with features such as a security bug bounty program and tools for running screenshot UI tests. Additionally, the continuous integration server ensures seamless updates and monitoring of JavaScript code, further improving site performance and data accuracy.
Beyond privacy, Matomo’s analytics enable marketers to make data-driven decisions by monitoring key metrics like user behavior and conversion rates. The platform provides a comprehensive view of how visitors interact with a client’s digital platforms, and supports custom tracking, allowing businesses to gather specific insights aligned with their goals.
How Is Matomo Different Than Google Analytics?
Both Matomo and Google Analytics are widely used web analytics tools, but they cater to different needs. Here's how they stack up:
Data Privacy and Ownership
Matomo stands out by giving businesses full ownership of their web analytics data. With options for self-hosting, it ensures compliance with data protection laws like GDPR, while Google Analytics stores data on Google servers, raising potential privacy concerns.
Customization and Flexibility
Matomo offers extensive customization, from custom dimensions to tailored reports. The Matomo dashboard allows agencies to adapt web analytics data for specific goals without needing additional tools. In comparison, Google Analytics often requires Google Tag Manager for similar customization. Both platforms support custom dimensions and events, but Matomo's flexibility in server-side tracking can be a key advantage for some use cases.
Hosting Options
Matomo provides the choice between self-hosting or cloud-based solutions, allowing full control over the web analytics platform. Google Analytics only offers a cloud-based option, limiting customization for companies with data residency requirements.
Tracking Capabilities
While both use a JavaScript tracking code, Matomo delivers more built-in features, such as heatmaps and session recordings, offering detailed insights without third-party tools. Google Analytics lacks some of these capabilities out of the box. However, GA4 has introduced enhanced tracking features, such as automatic event tracking, which narrows the gap slightly.
Data Sampling and Accuracy
Google Analytics applies data sampling for large data sets, potentially reducing precision. Matomo processes all data without sampling, ensuring more accurate analytics data regardless of traffic volume.
Integration and Compatibility
Google Analytics benefits from seamless integration with Google's suite, such as Google Tag Manager, Google Ads, Google Search Console, etc. making it a convenient option for cross-channel tracking. Matomo integrates with various platforms but maintains a focus on privacy-centered tools.
Compliance and Legal Requirements
Matomo’s flexible data storage options simplify compliance with strict regulations, making it a robust alternative to Google Analytics. Installing Google Analytics may involve more steps to meet legal standards, especially concerning user consent tracking.
By understanding these distinctions, agencies choose the right web analytics platform to optimize client reporting and insights.
Agency Tip: Simplify your analytics process and showcase key insights with a customizable Matomo report template—designed to save time and deliver value.
15+ Matomo Analytics to Track for Clients
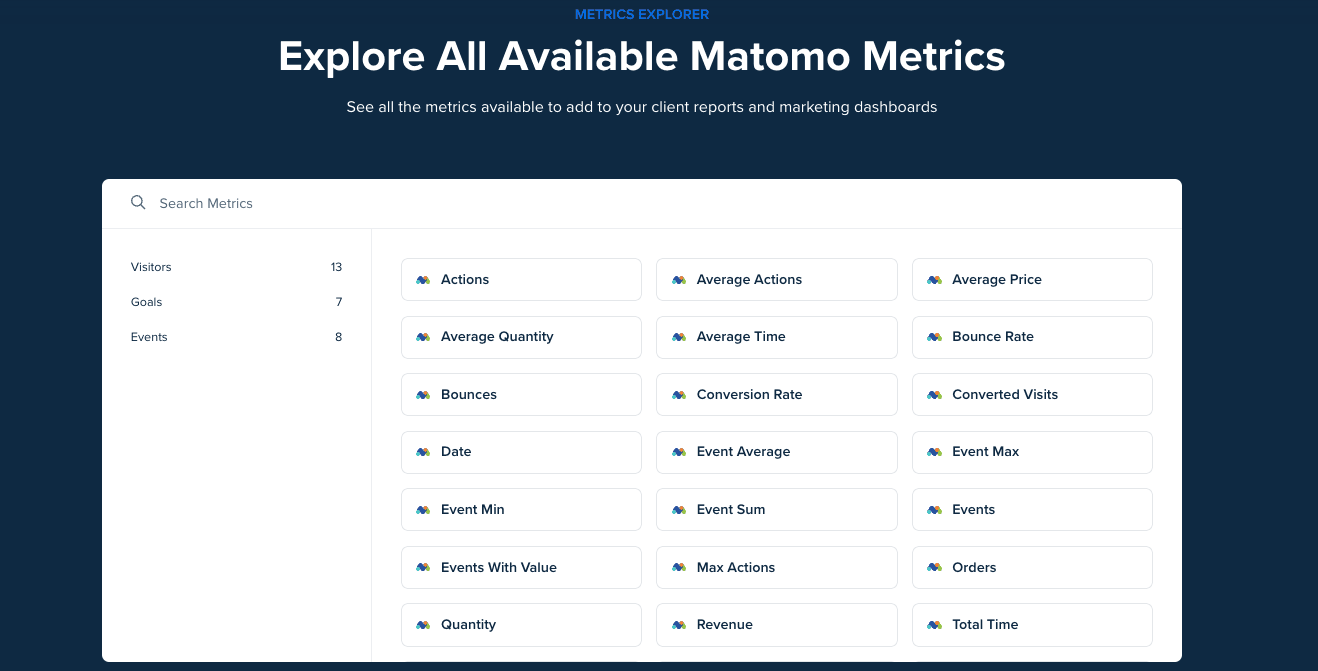
Matomo gives marketers access to a variety of metrics to better understand website performance, user behavior, and the overall success of digital marketing strategies. Tracking these metrics helps agencies identify areas for improvement, measure success, and make informed decisions.
Below are some of the top Matomo metrics to track for clients, each offering valuable insights into different aspects of their website’s performance.
1. Conversion Rate
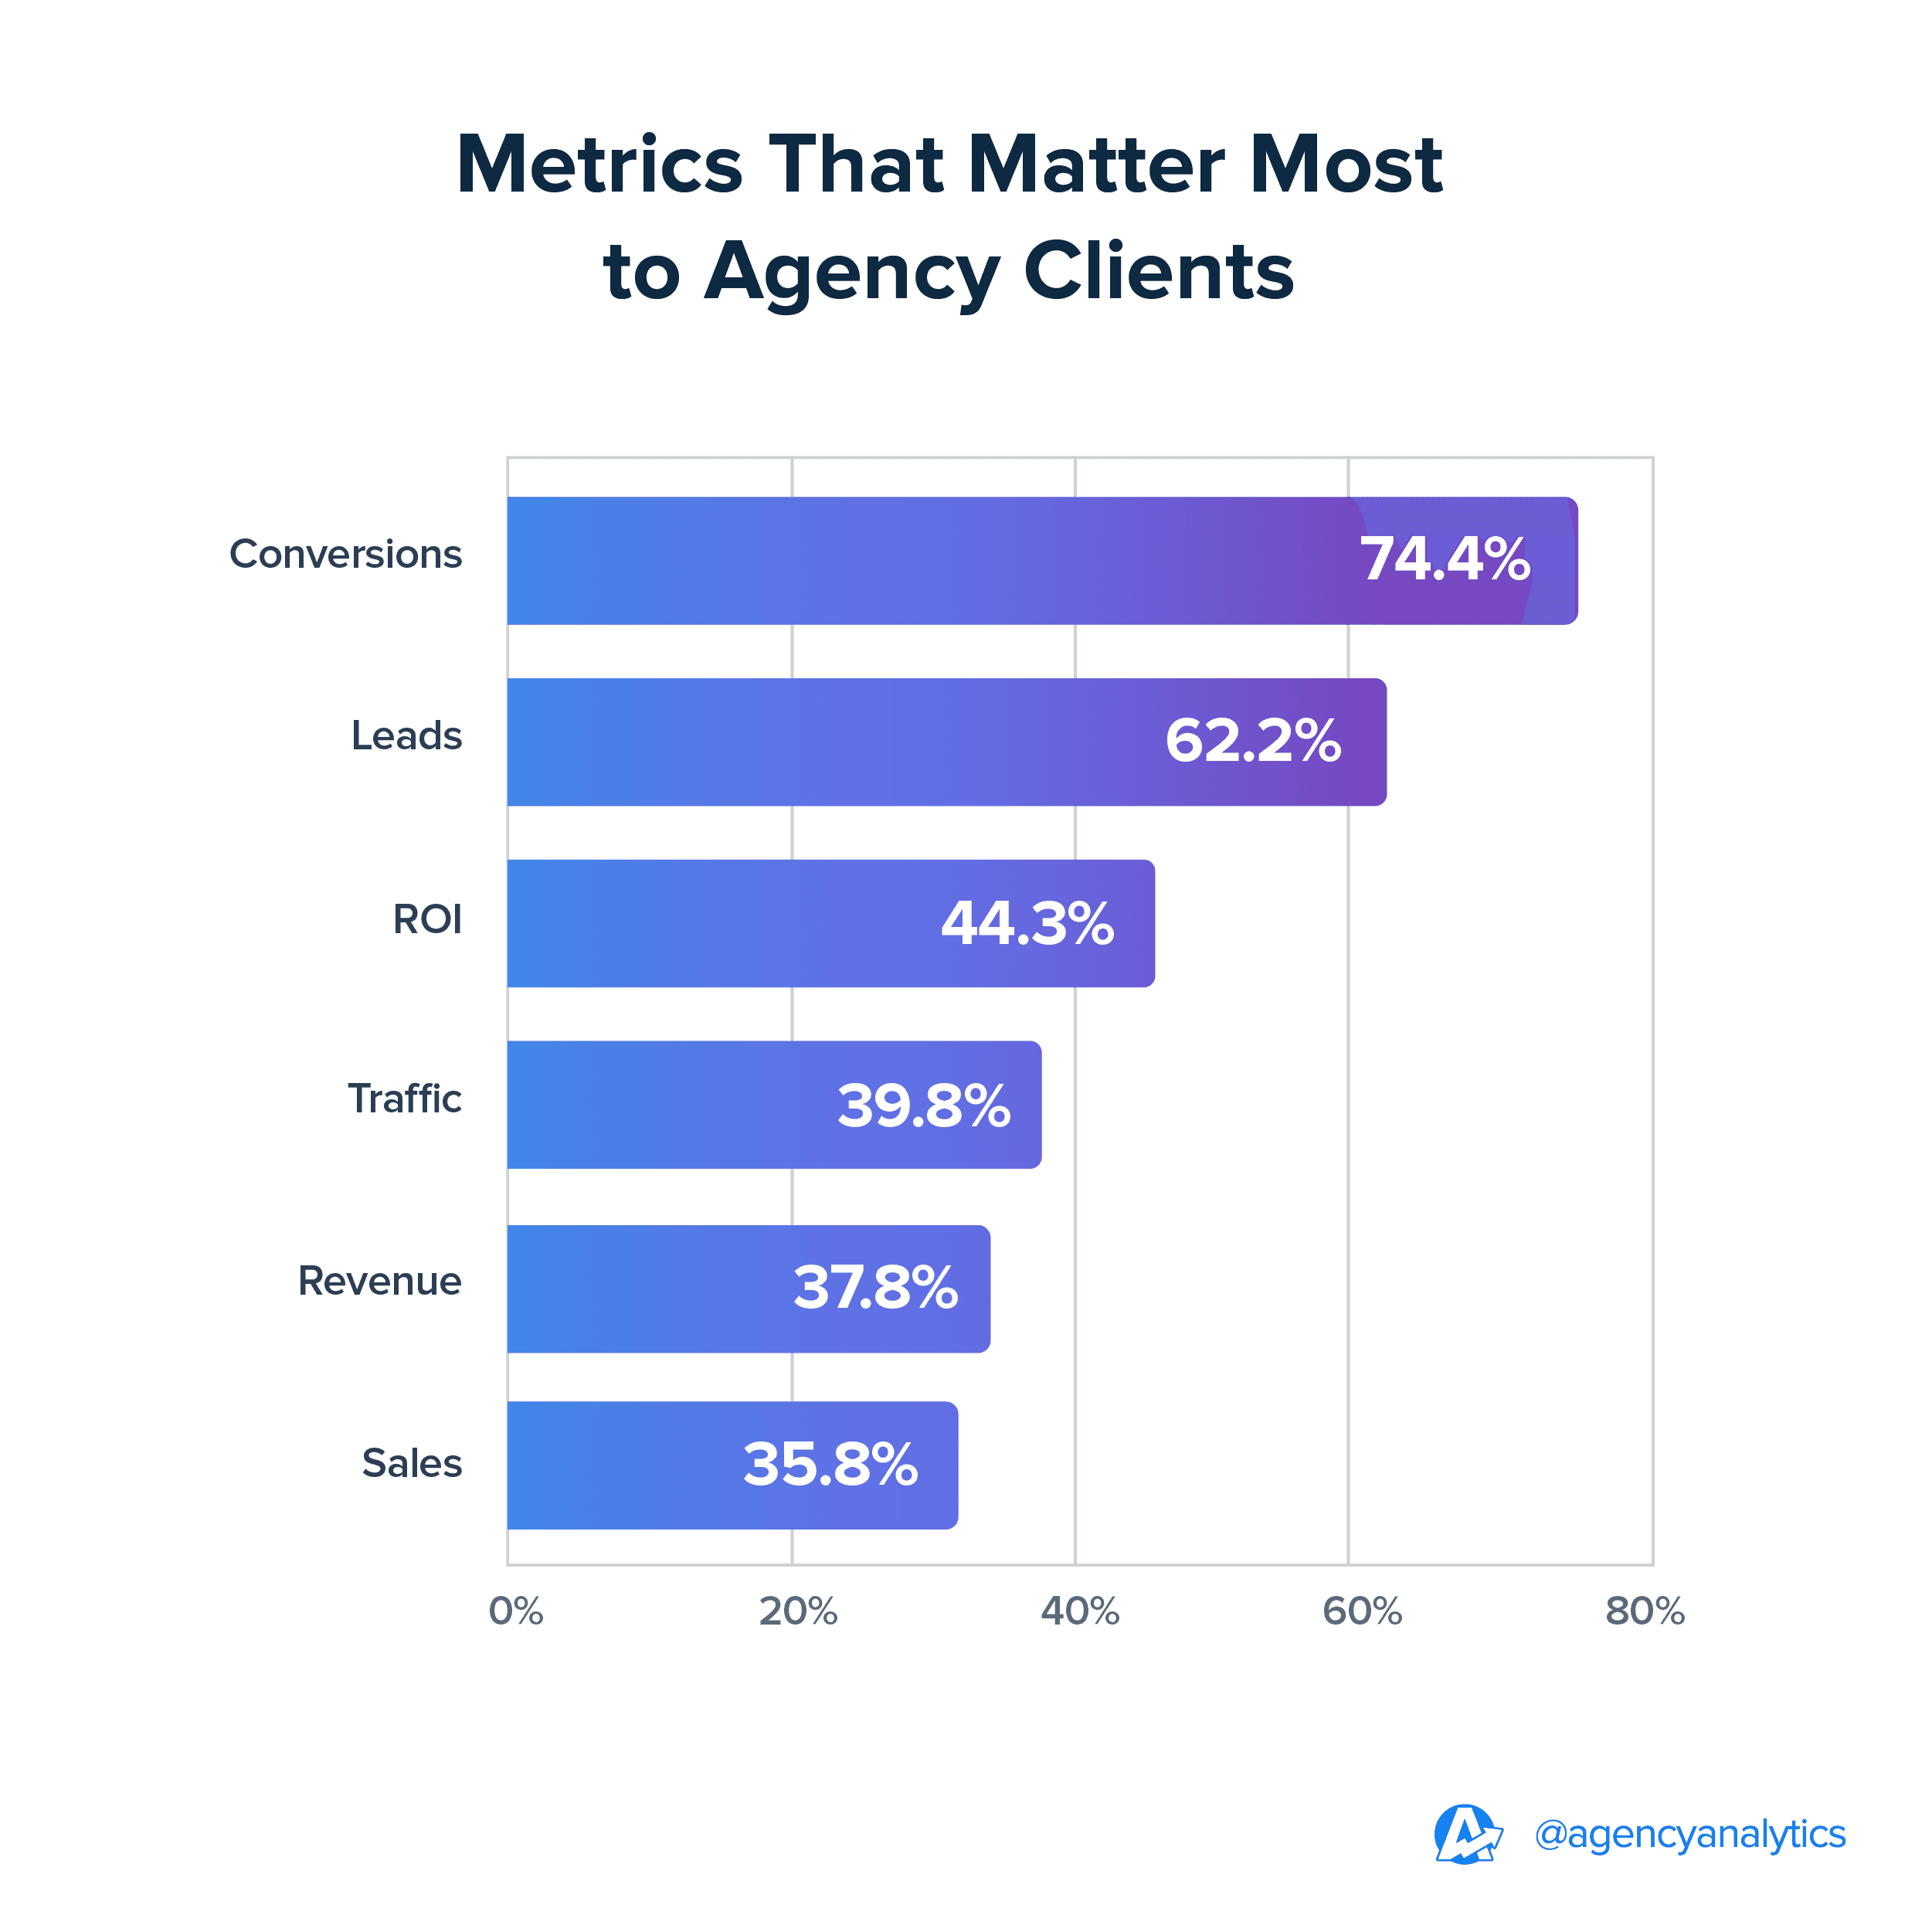
According to the AgencyAnalytics Marketing Agency Benchmarks Survey, conversion rate is the metric that’s most important to the majority of clients.
Conversion rate signifies the percentage of visitors who complete a desired action, such as making a purchase or signing up for a newsletter. This metric is always important because it directly reflects how well a client’s site is turning visitors into customers or leads. A high conversion rate indicates that their website's user experience, content, and calls to action are effectively driving visitors to convert.
Read More: The Ultimate Guide to Ecommerce Conversion Rate Optimization
2. Converted Visits
Include converted visits in your client reports to show the total number of sessions during which a conversion occurs. This metric is particularly important for understanding how many visits are leading to conversions, allowing you to assess whether changes to the website, content, or marketing efforts are improving overall performance.
Need to improve a client’s website content? Check out our 39-point SEO content checklist below.
3. Bounce Rate
Bounce rate measures the percentage of visitors who leave a client’s site after viewing only one page. A high bounce rate often indicates that visitors are not finding what they need, signaling a need for improvements in site structure, content, or user experience. Keeping track of bounce rate is key to optimizing engagement and user retention.
4. Website Visits
Website visits, or sessions, represent the total number of times users access a client’s site. This metric is fundamental in understanding overall website traffic and typically serves as a baseline for analyzing other metrics like conversions and engagement. A steady increase in visits often correlates with the success of marketing efforts.
5. Average Visit Duration
Average visit duration or average session duration tracks how long users stay on a client’s site during a single session. This metric helps marketers understand user engagement. A longer visit duration often indicates that users are finding valuable content and spending more time interacting with the site, which often positively affects other key metrics.
6. Unique Visitors
Unique visitors represent the total number of distinct individuals who visit a client’s site over a given period. This metric is essential for assessing the reach of the website and understanding the size of the audience. Tracking unique visitors also helps gauge how well your team’s marketing efforts are bringing new users to the site.
Show your clients the metrics that matter! Use AgencyAnalytics to display your Matomo metrics in a customizable dashboard that’s easy to understand and keeps clients informed. Start your 14-day free trial today!
7. Visitor Revenue
Visitor revenue calculates the total revenue generated from visitors who make purchases on a client’s site. This metric is important for your agency’s ecommerce clients to measure the financial performance of their website traffic. Tracking visitor revenue helps marketers identify the profitability of a client’s website and optimize for higher returns.
8. Actions and Average Actions
Actions refer to any activity a user performs on a website, such as clicking links, playing videos, or viewing pages. Average actions per visit indicate how engaged users are with a site. High engagement, as reflected by multiple actions per session, often leads to better retention and conversion rates.
9. Total Time
Total time measures the cumulative amount of time all visitors spend on your client’s site. This metric is useful for understanding overall user engagement and site performance. High total time suggests that visitors are interacting extensively with the content, while low total time may indicate a need for improvements in content quality or user experience.
10. Average Time on Page
Average time on page calculates the amount of time users spend on a specific page. This metric is valuable for understanding which pages are engaging visitors the most. It also helps identify underperforming pages that may need content updates or design improvements to hold users' attention longer.
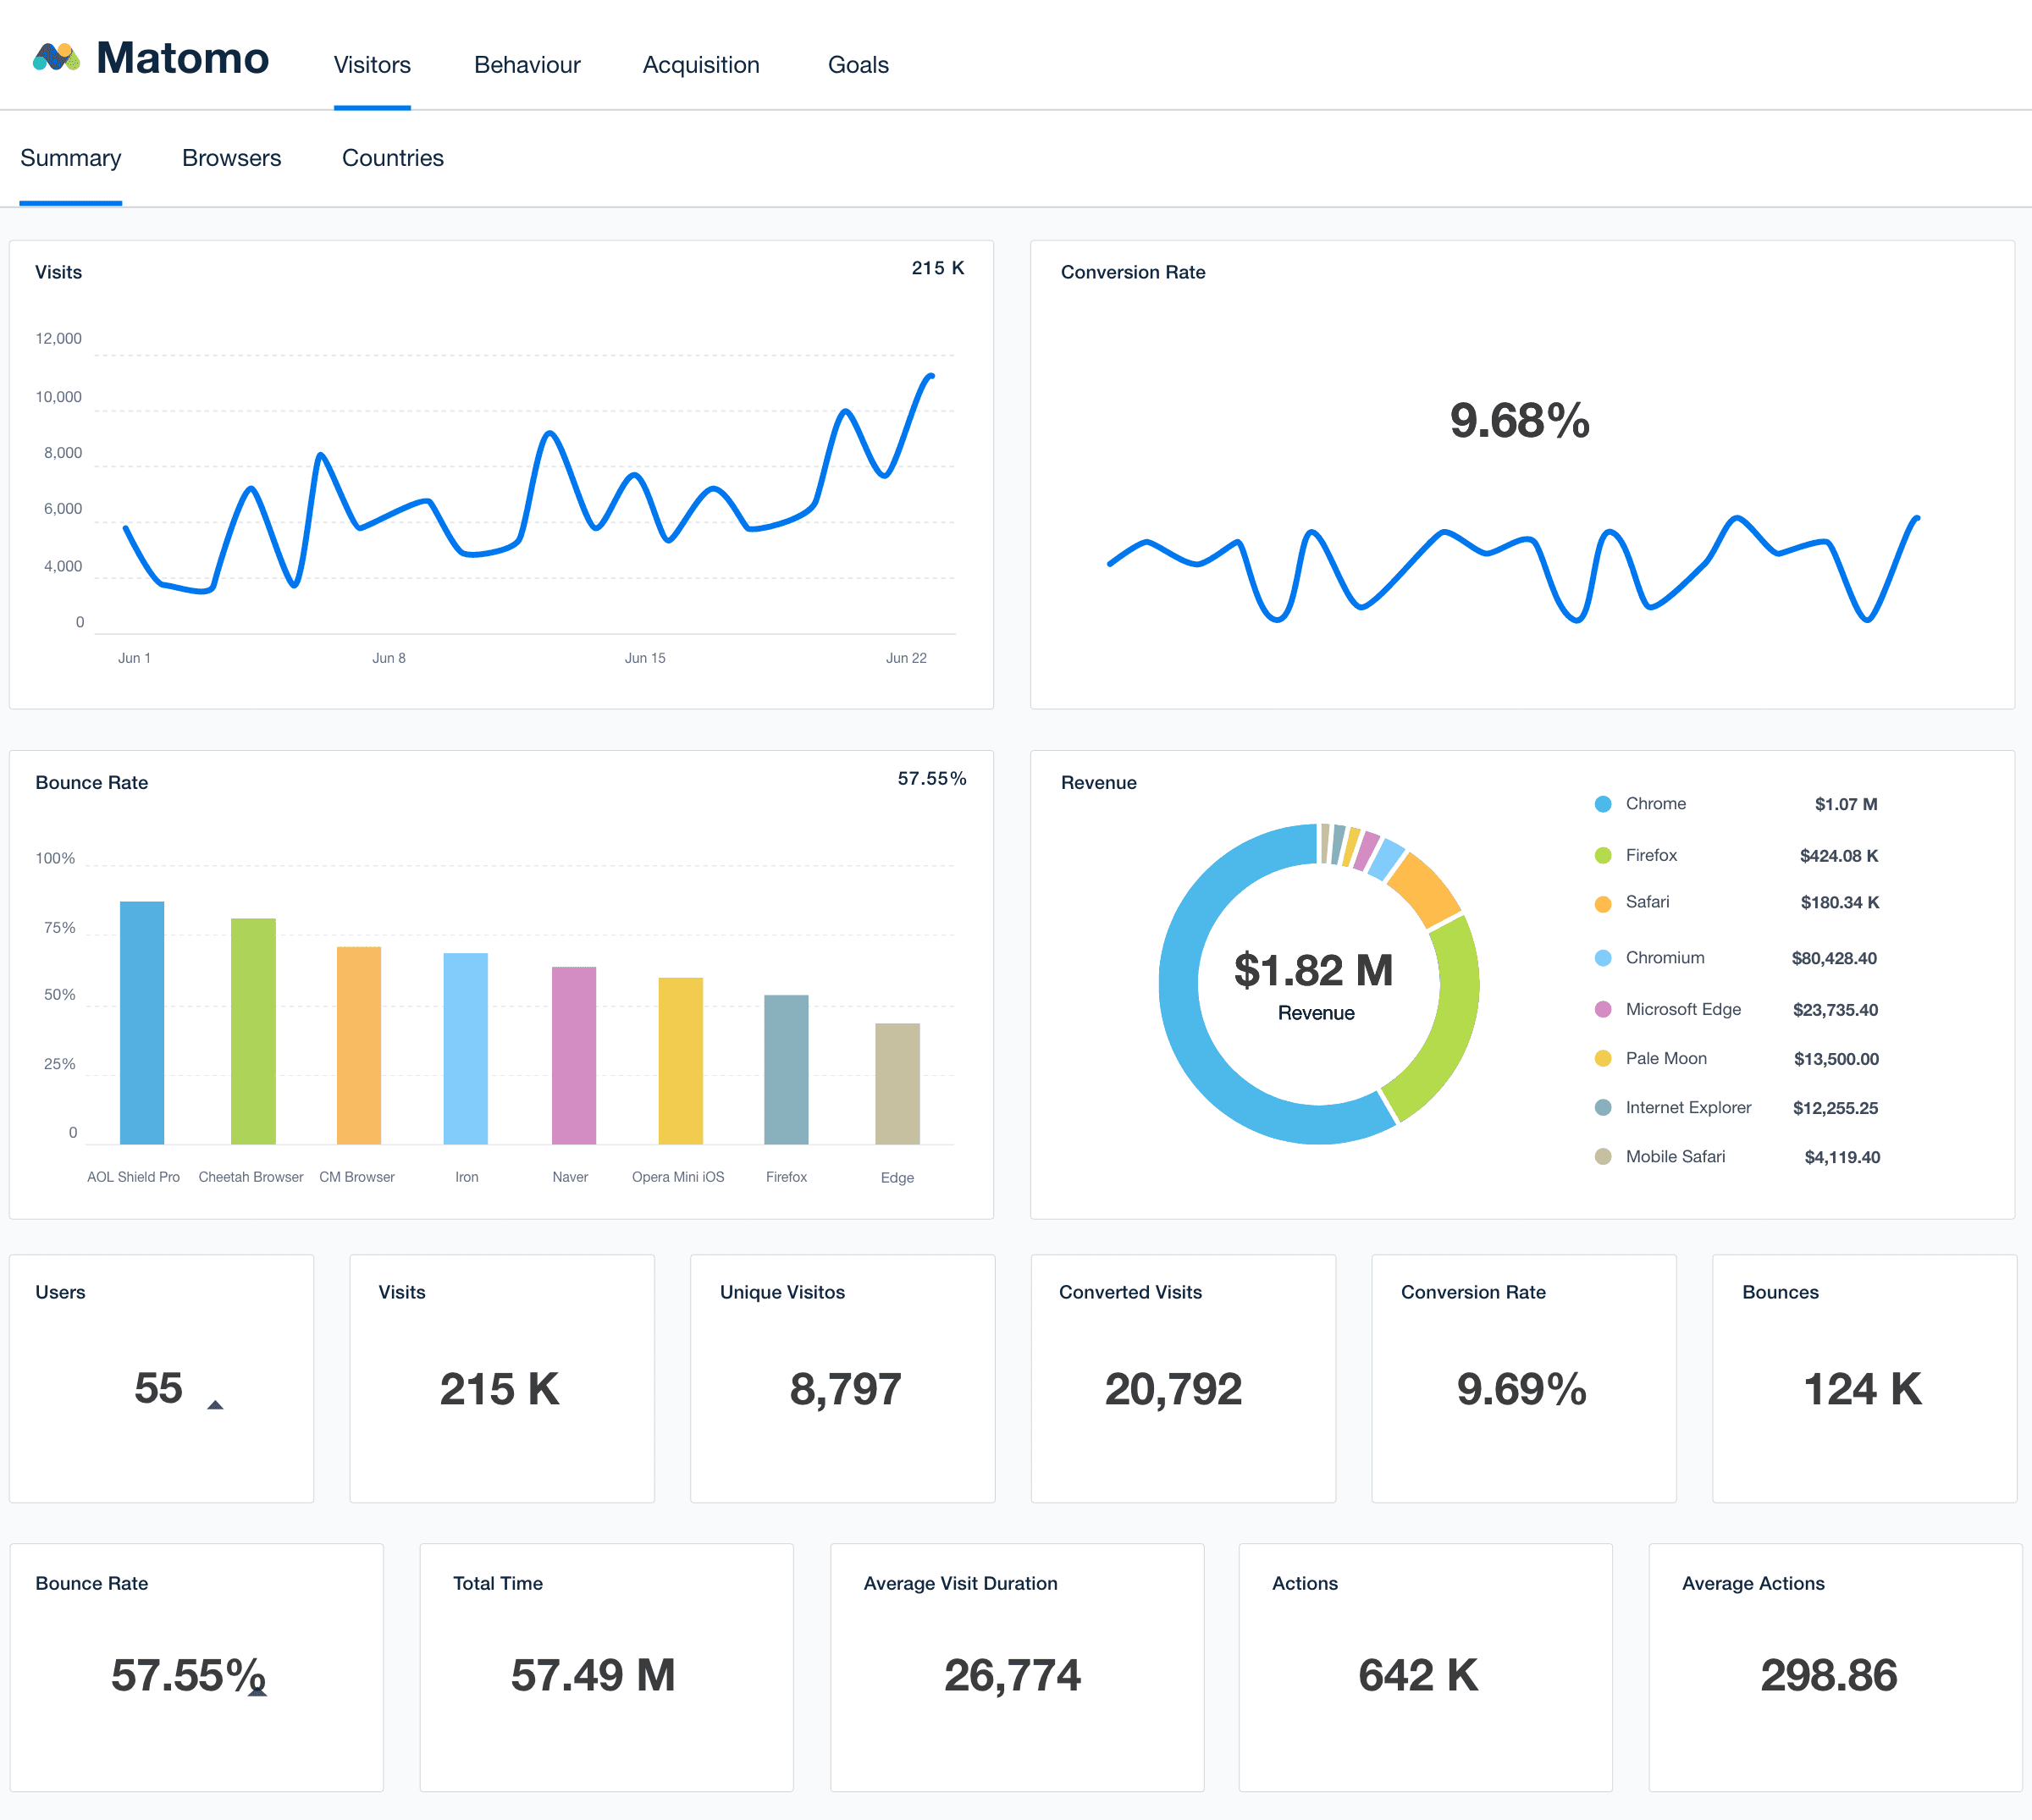
Create impressive web analytics reports in minutes with the Matomo integration from AgencyAnalytics. Get started today with your 14-day free trial.
11. Hits
Hits track the total number of interactions on a site, including page views, downloads, and events. Hits give a broad overview of site activity, and help gauge how much interaction is happening on a client’s site. This is a useful metric for tracking overall website performance and identifying trends in user behavior.
12. Events and Events With Value
Events are specific interactions users have with a site, such as playing a video or clicking a download button. Events with value go a step further by tracking events that result in conversions or have monetary significance. This metric allows marketers to see how well their site features are driving conversions and providing value.
13. Acquisition Revenue
Acquisition revenue or cost per acquisition measures the total income generated from acquisition channels like paid search, email campaigns, or social media. Tracking this metric helps agencies understand which marketing channels are most effective in driving revenue, allowing for more informed allocation of marketing budgets.
Read More: How Agencies Are Using the Bowtie Model to Enhance Post-Acquisition Client Retention
14. Orders
Orders track the number of completed purchases made on a client’s website. This is a key metric for ecommerce businesses as it directly correlates with revenue. Monitoring the number of orders helps businesses understand their sales performance and make necessary adjustments to boost sales.
15. Product Revenue
Product revenue measures the total income generated from the sale of individual products. This metric provides insight into which products are performing best and contributing the most to a business's bottom line. Tracking product revenue helps marketing agencies focus on high-performing products while identifying those that may need additional marketing or pricing adjustments.
16. Quantity
Quantity refers to the total number of items sold in completed orders. This metric is helpful in understanding the volume of sales and which products are in demand. By tracking quantity, businesses are able to ensure inventory levels are appropriate and adjust sales strategies to increase volume where needed.
17. Average Price
Average price or average order value calculates the average amount spent per product in completed orders. This metric is key for marketers (and their clients) to understand customer spending behavior and how pricing strategies are working. Monitoring average price helps businesses optimize their pricing for profitability while remaining competitive in the marketplace.
Read More: 12 Ecommerce Goals That Drive Client Success
Turning Raw Matomo Analytics Into Actionable Insights
To truly deliver value, marketers aim to transform clients’ Matomo data into actionable insights that drive results. Raw numbers are important but are often overwhelming or unclear for clients without context.
Turning Matomo analytics into clear, strategic recommendations helps clients understand what’s working, where adjustments are needed, and how to improve their website’s performance and user experience.
Here are some key tips for transforming raw Matomo data into actionable insights:
Set Clear Goals & KPIs: Establish measurable goals and key performance indicators (KPIs) to ensure your data aligns with your client’s objectives.
Identify Key Metrics: Focus on the most relevant metrics that impact your client’s goals, such as conversion rates and visitor behavior.
Analyze Trends: Use historical data to identify patterns and trends that highlight growth areas or potential challenges.
Benchmark Against Competitors: Compare your client’s performance with industry standards to provide context and highlight competitive advantages.
Connect the Dots With Other Platforms: Integrate Matomo analytics with other tools to cross-reference data, uncover deeper insights, and ensure software quality assurance.
Use Insights To Drive Strategy: Leverage data-driven insights to shape your client’s future strategies and optimize their website for better performance.
We are asking our clients to trust our recommendations, and this can only happen once we show them the insights, trends and where we are winning for them.
Khurram Shahzad, Founder & CEO, Digilatics
Offer your clients more value and guide their business decisions with clear recommendations. Matomo lets marketers liberate web analytics from a purely technical space and apply it strategically, improving client outcomes and driving sustainable improvements in the long run.
Want to improve your Matomo reports? Integrate Matomo with AgencyAnalytics to create clear, multi-platform reports and give your clients better insights. Try it free for 14 days!
How To Create Matomo Reports Using AgencyAnalytics
If you’re already using Matomo for your clients, connecting it to the AgencyAnalytics platform streamlines tracking important website KPIs from a centralized location. With customizable dashboards, agencies (and their clients) are able to monitor everything with up-to-date data in real time.
By connecting other popular web analytics or SEO integrations like Ahrefs, Semrush, and Moz, agencies easily pair this data with PPC channels such as Google Ads, providing an in-depth understanding of where their clients' leads are coming from and how campaigns are performing.
So, where do you begin?
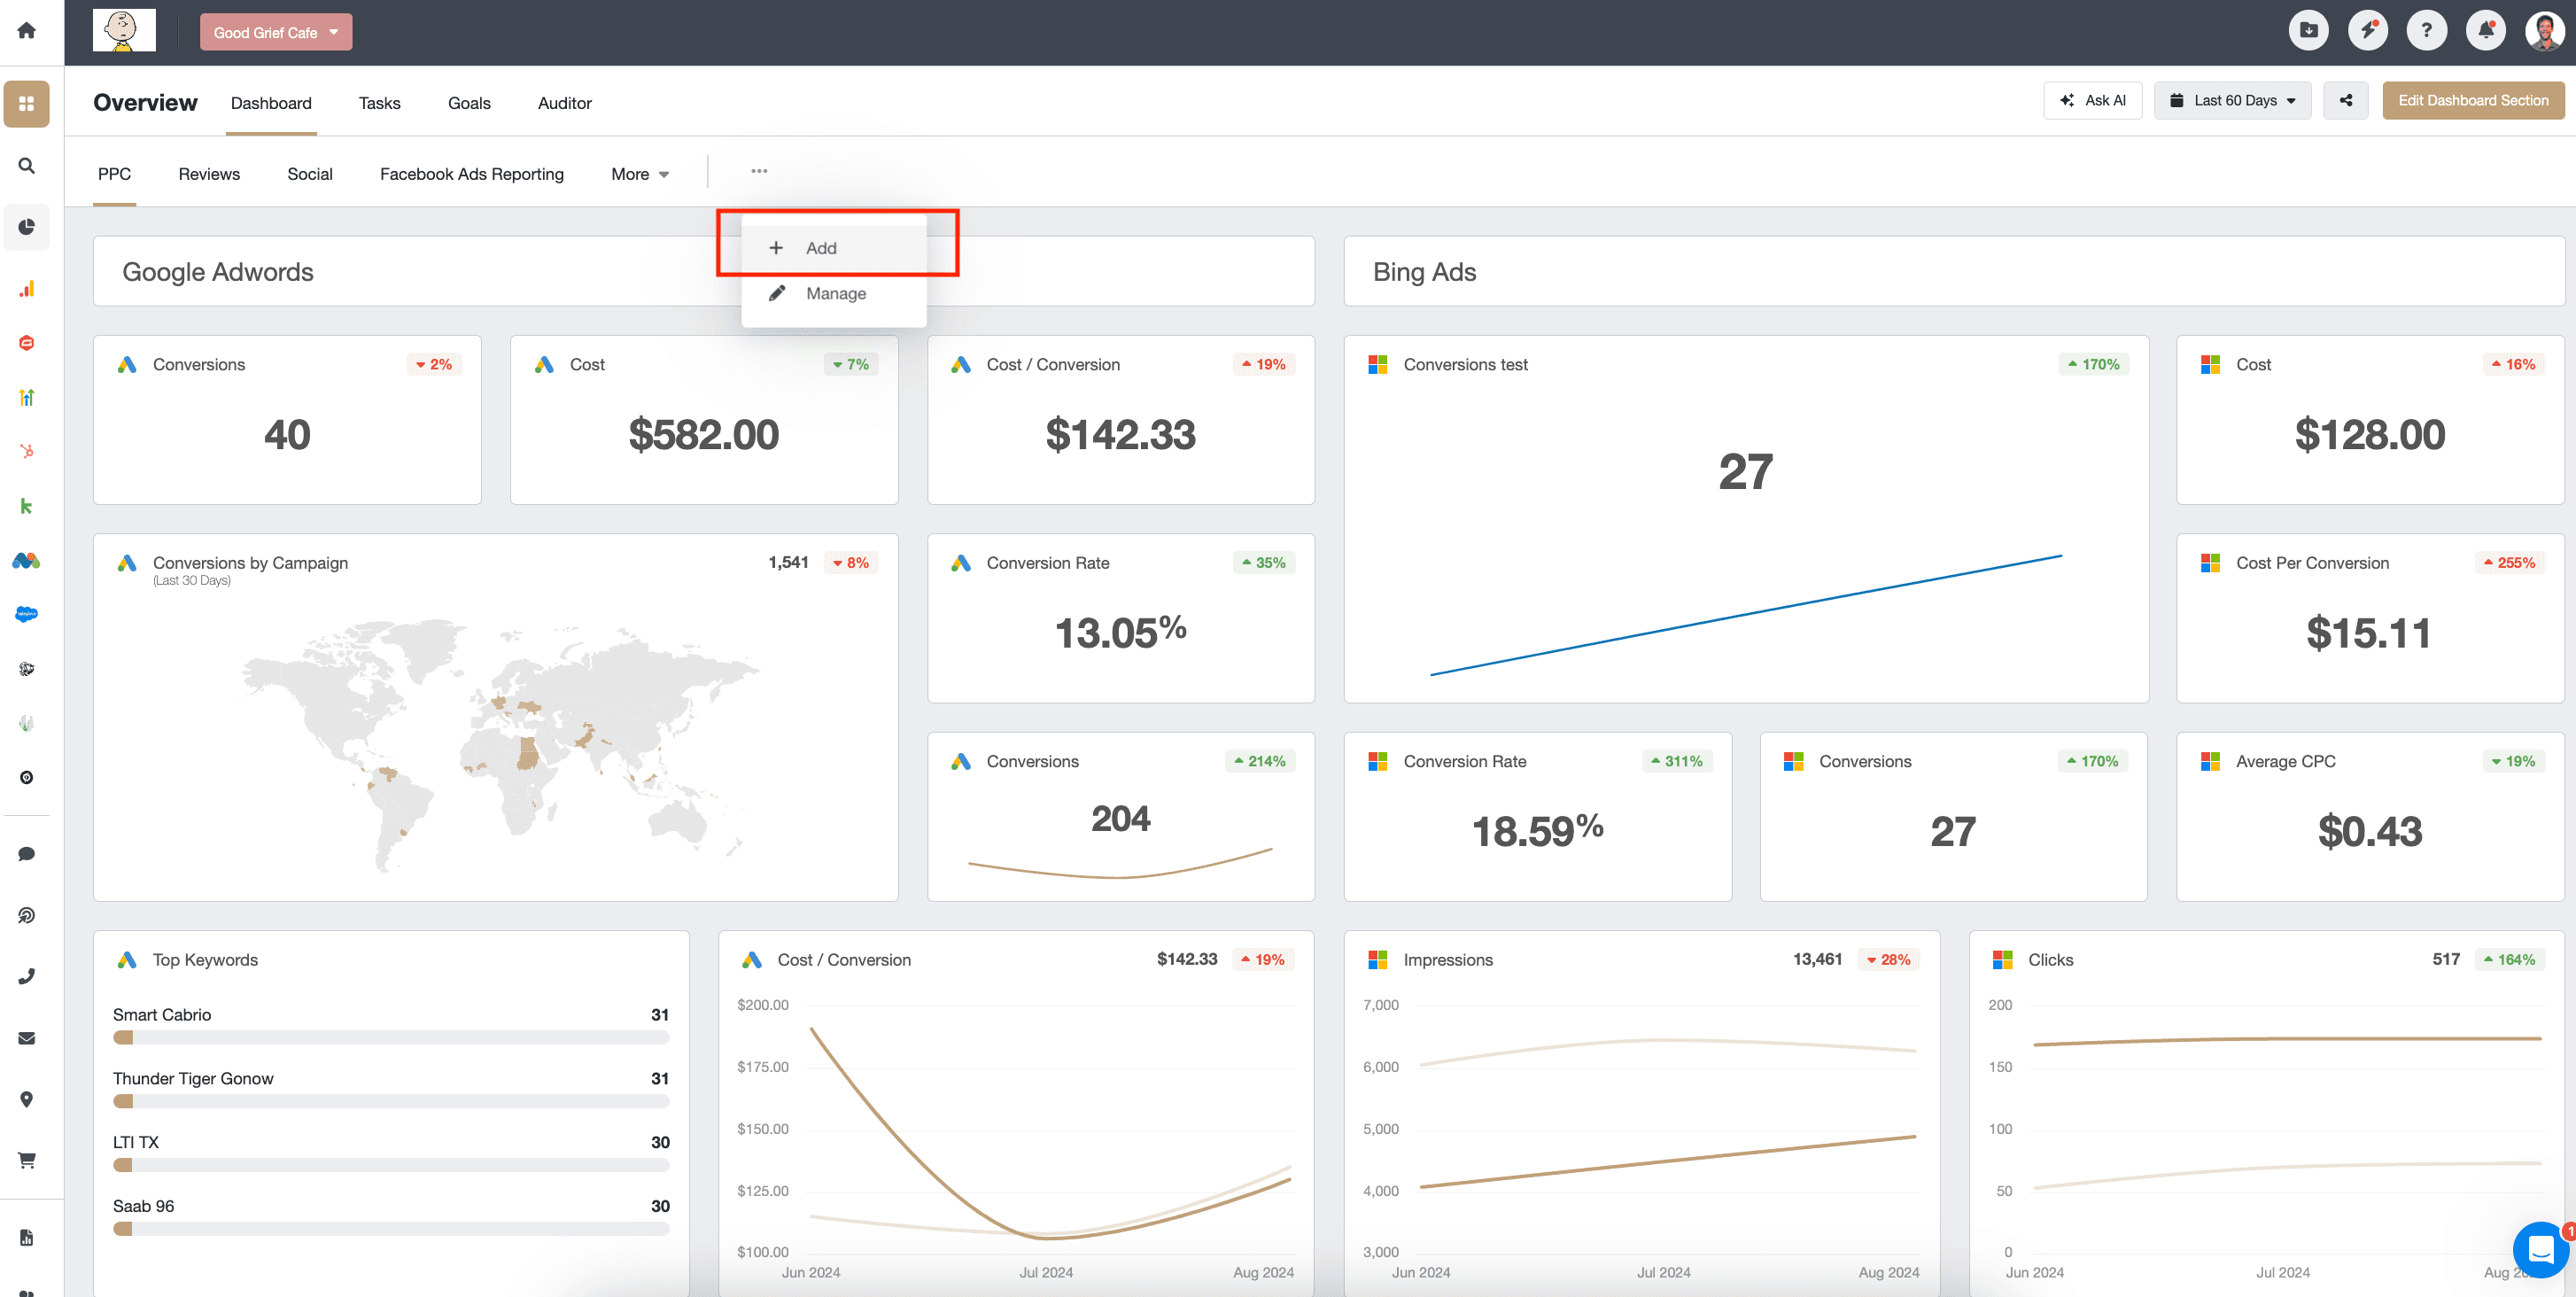
Start by logging into your AgencyAnalytics account and navigate to the client account you’d like to build a Matomo analytics dashboard for. Then select “add” in the drop-down menu to create a new dashboard.
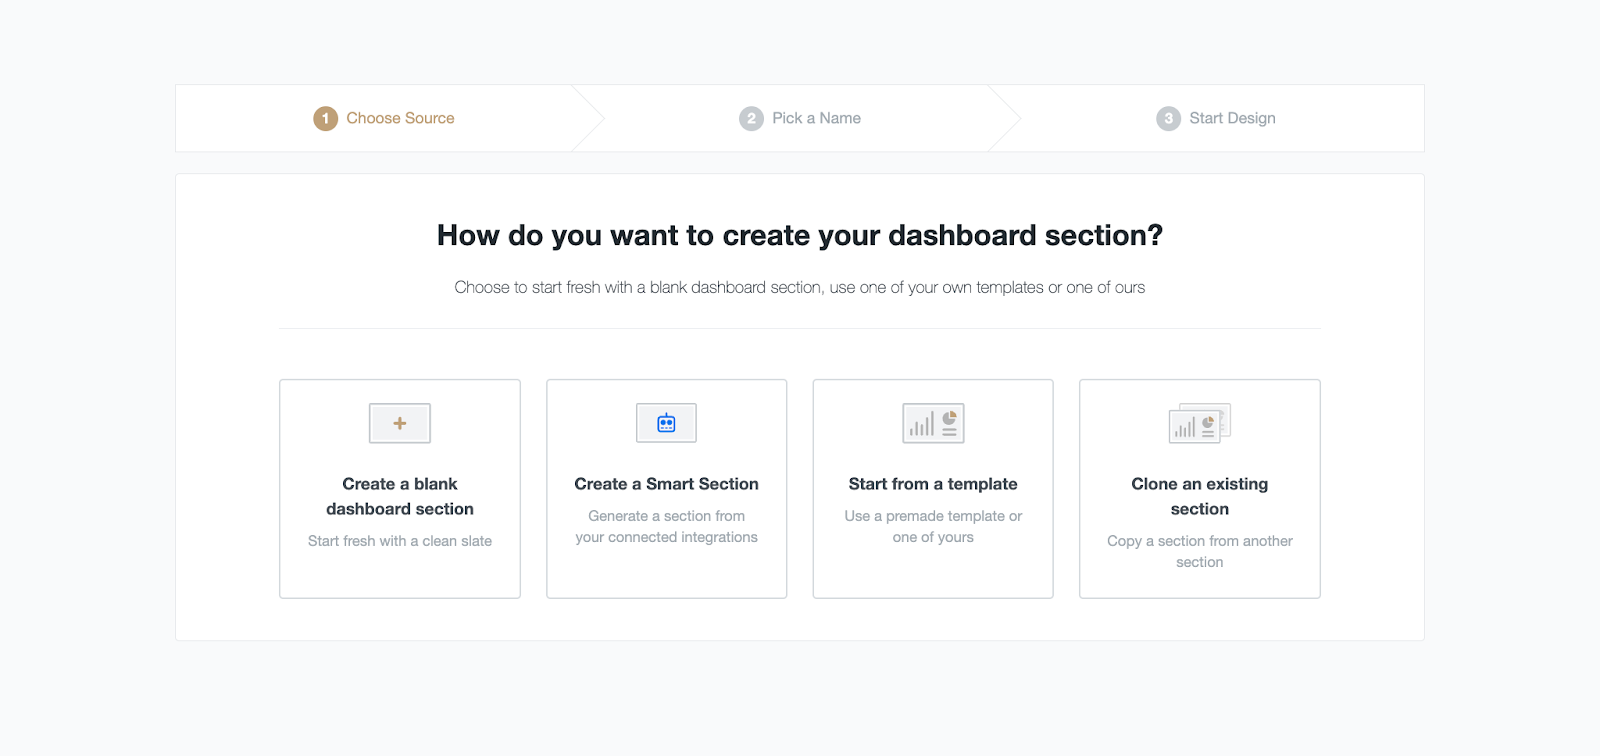
Next, you’ll be prompted to choose how you’d like to create the insights dashboard:
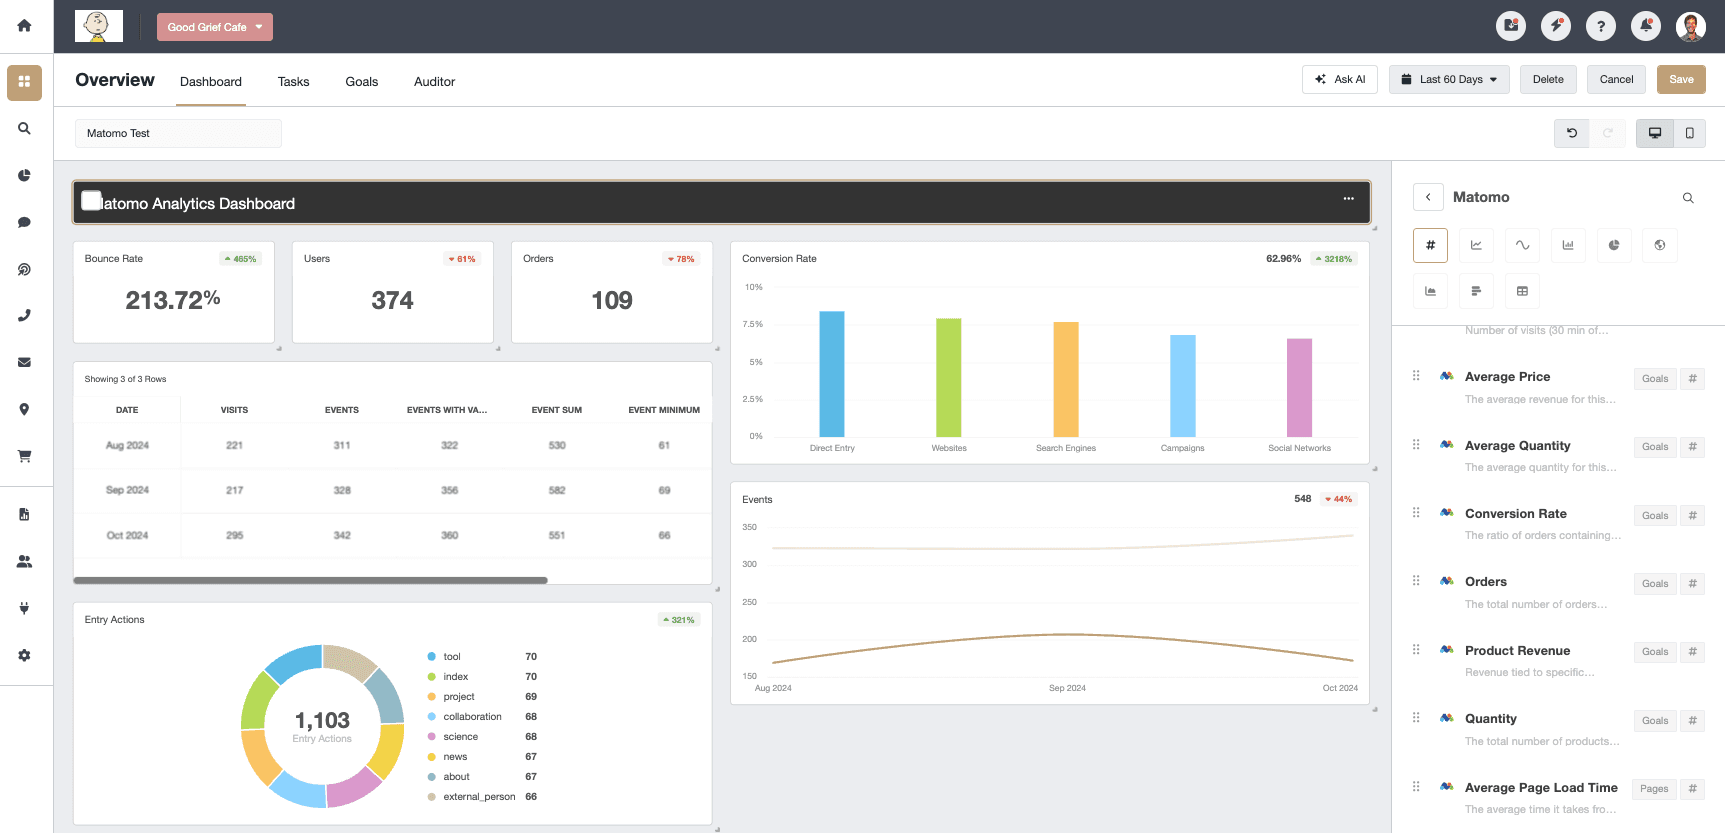
We’ve chosen to create a blank dashboard for this example. This allows you to drag and drop specific widgets you’d like from a variety of marketing platforms.
Under a time crunch? The Smart Reports and Smart Dashboards feature from AgencyAnalytics builds exactly what you need in 11 seconds or less. Try it out for yourself with a 14-day free trial.
With access to over 80 marketing channels, AgencyAnalytics gives agencies a complete picture of a client's marketing activity in one place. The platform’s user-friendly interface makes it easy to visualize data, identify trends, and make informed decisions, all while keeping clients in the loop with real-time insights.
5 Matomo Reporting Tips
Delivering impressive web analytics reports means they need to be clear, actionable, and aligned with your client’s goals. Matomo’s web analytics tool provides advanced metrics, but how you present the data makes all the difference in how clients perceive your agency’s value.
Here are five tips to help your team create Matomo reports that leave a lasting impression.
1. Combine Matomo With All of Your Clients' Other Campaign Metrics: Incorporate data from other platforms like Google Analytics 4, Google Ads, Facebook, SEO rankings, and more. This gives clients a complete view of their marketing performance, ensuring no data is left out.
2. Track the Right Matomo Metrics: Focus on the metrics that are most important to your client’s objectives, such as conversion rates, bounce rates, and visitor behavior. Avoid overwhelming them with unnecessary data.
3. Focus on the Results That Matter: Highlight the key takeaways that drive client results. Prioritize insights that directly relate to improving website performance or achieving business goals.
4. Use Automated Reporting Tools: Save time and reduce manual effort by using automated integration tests and reporting tools. This ensures that reports are timely, accurate, and easy to update as new data comes in.
5. Wrap Results in Your Agency's Brand: Customize your marketing dashboards and reports with your agency’s branding to maintain a professional and cohesive look. Personalizing them adds a layer of professionalism that clients appreciate.
Using the web analytics report and the SEO reports side by side helps us show our clients a correlation between SEO and Traffic. We merge this data with a custom template that tracks conversions, and Stripe data to show that traffic growth–from SEO and PPC–does have an impact on the number of conversions and revenue (their bottom line).
Ruben Roel, President, Investigator Marketing
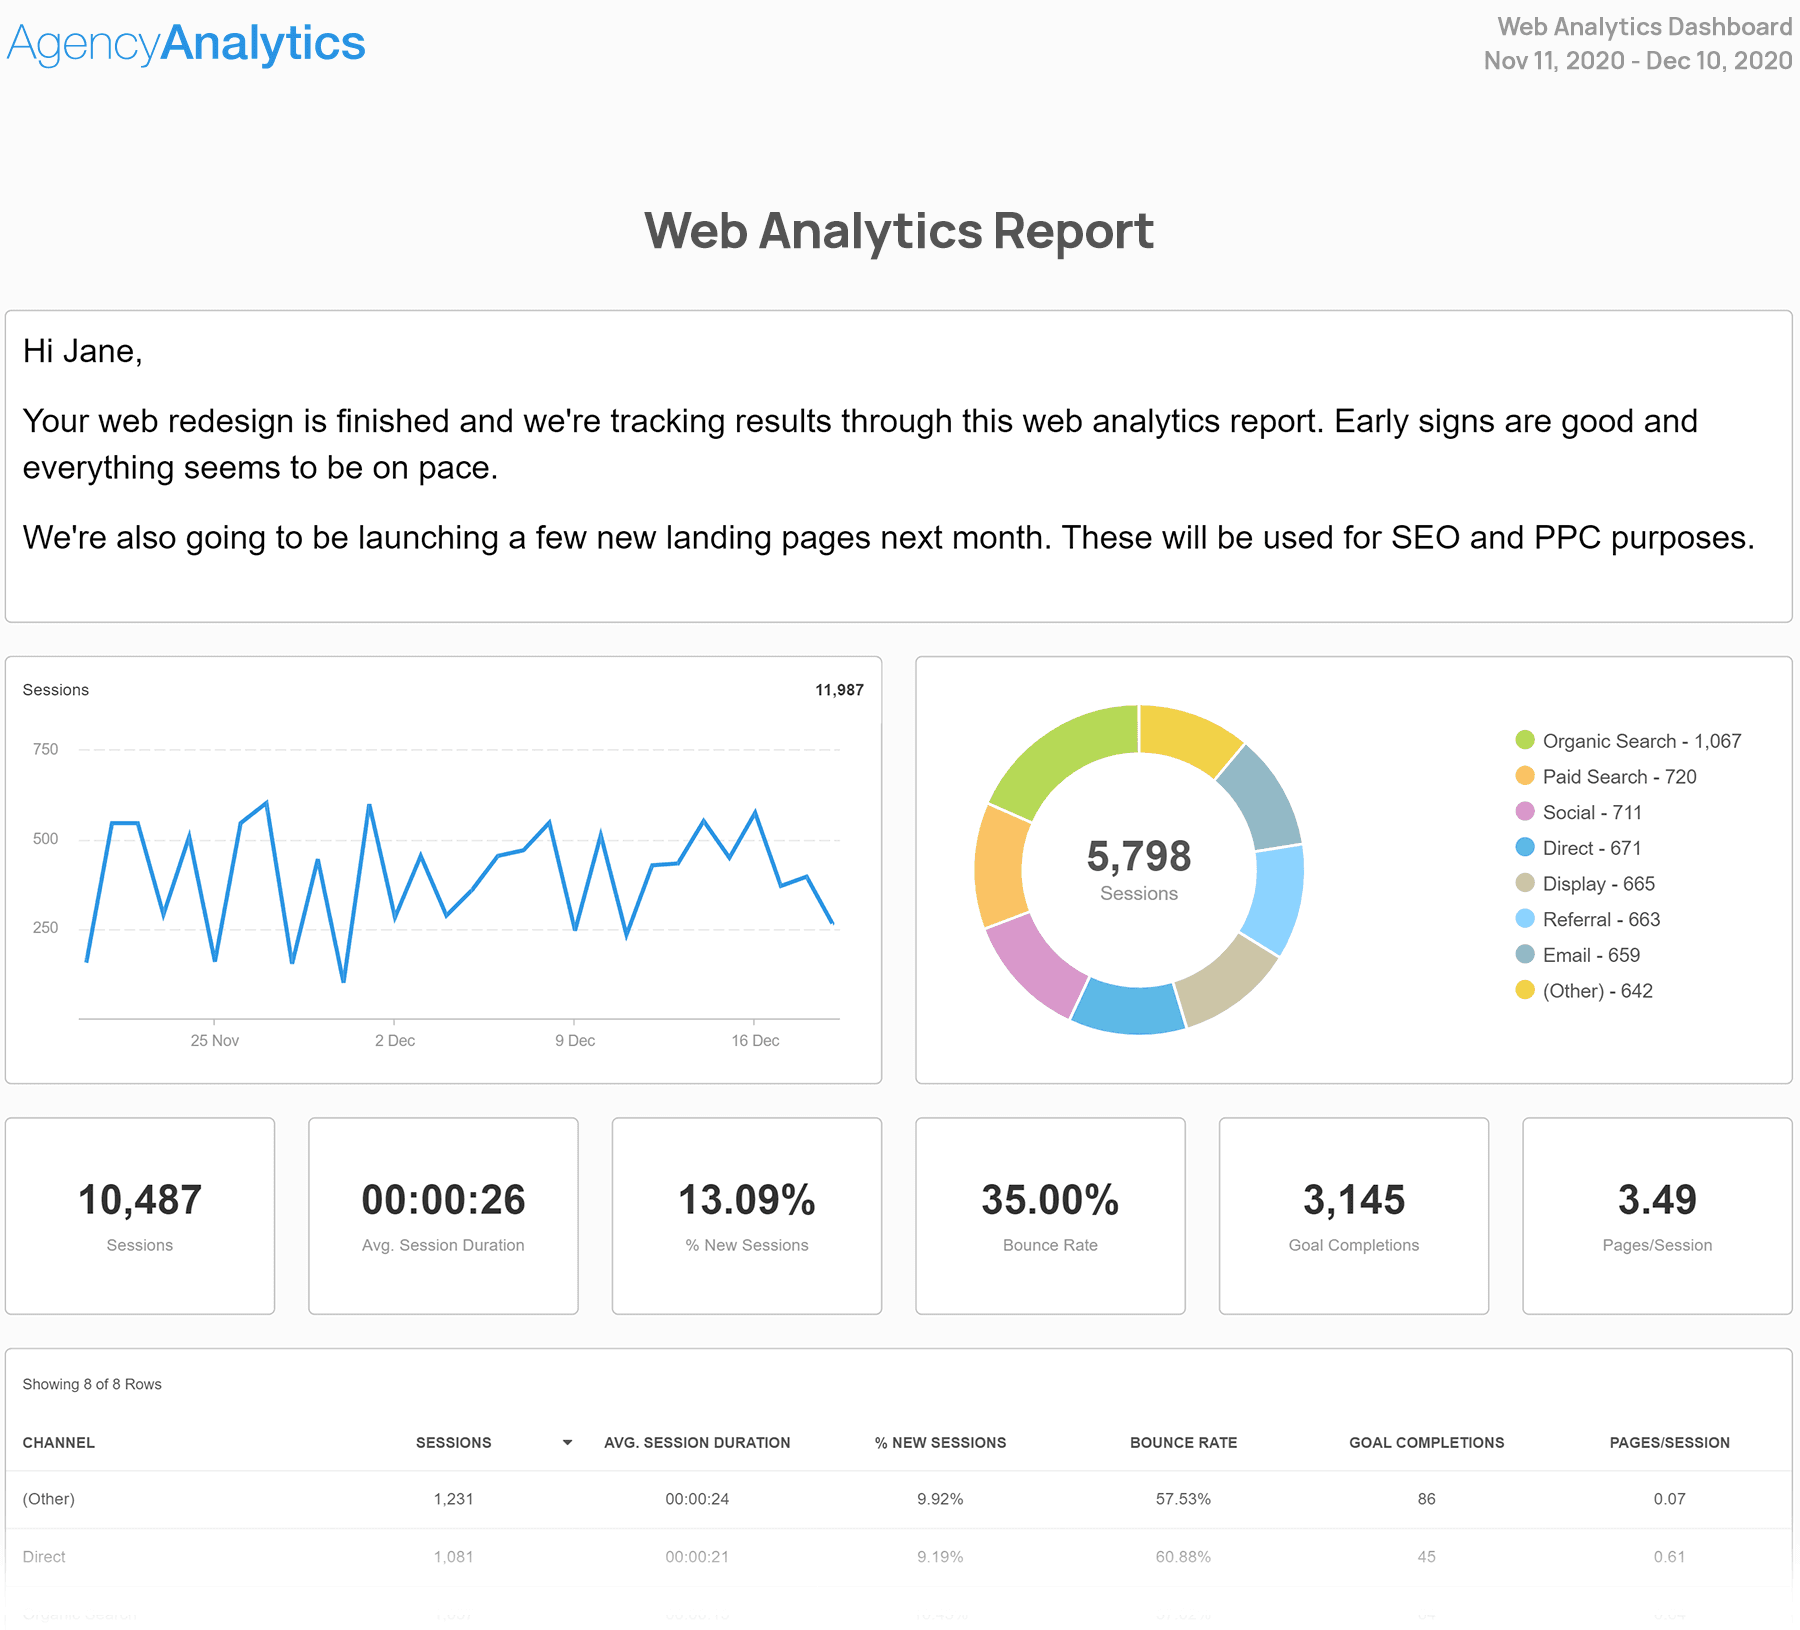
Save yourself valuable time and try out the web analytics report template. It brings the top web analytics front and center so you don’t have to. Plus, with customization options, you can add any widgets you want to clearly communicate specific results to clients.
Matomo Analytics vs. AgencyAnalytics
While Matomo’s native analytics platform provides essential insights into your clients’ website analytics, marketing agencies managing multiple marketing platforms for their clients need more advanced reporting capabilities.
Many agencies often debate about using Matomo vs. Google Analytics to track their clients’ website analytics.
However, a Google Analytics alternative like AgencyAnalytics brings more than just a client’s web analytics into focus. With 80+ marketing platform integrations, agencies get a bird’s eye view of their marketing efforts.
Not to mention tools like Ask AI to summarize client marketing data, helping agencies make informed decisions and communicate those results to clients in an easy-to-understand way.
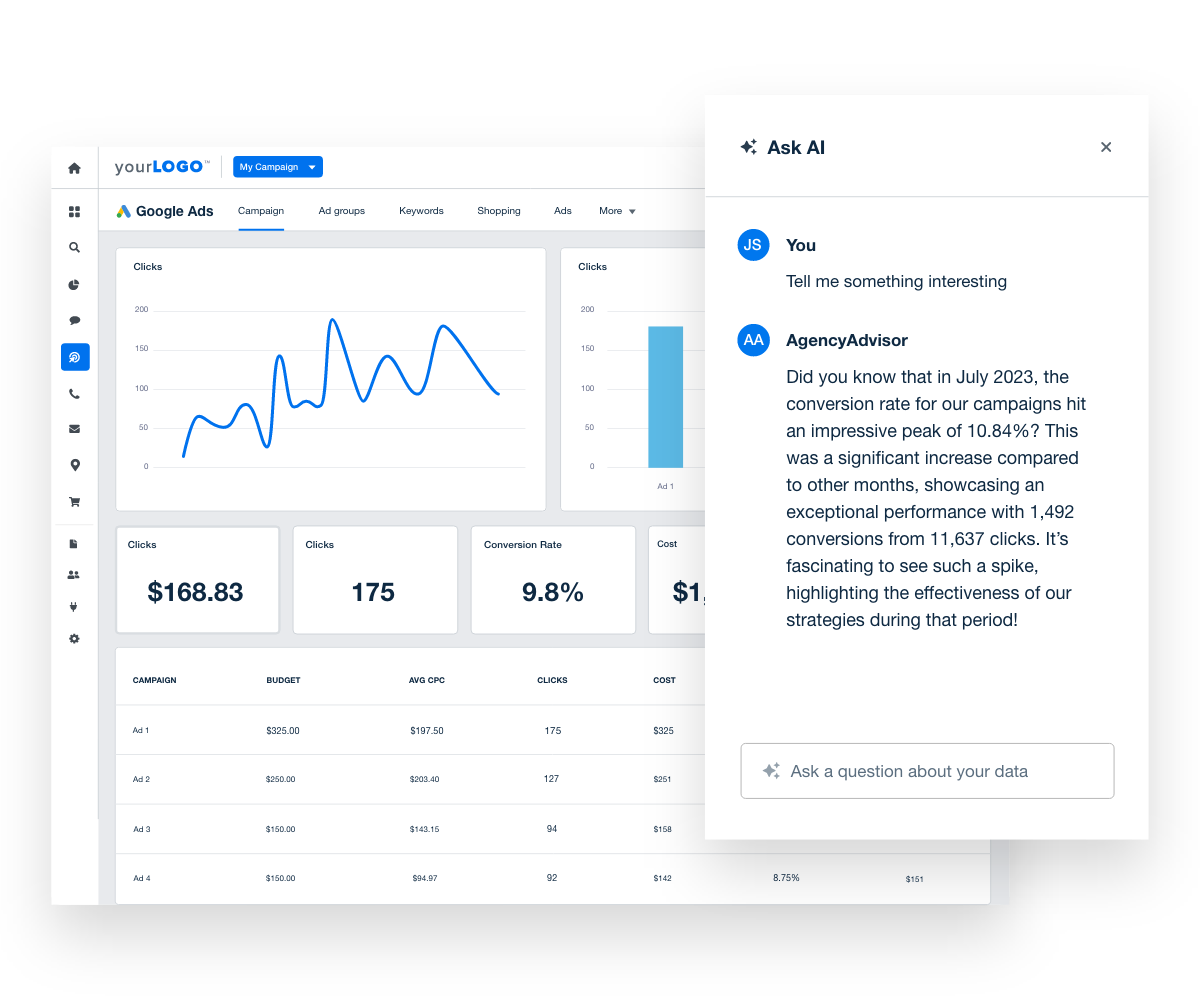
Here is a breakdown of how Matomo features stack up against AgencyAnalytics.
Feature | Matomo Native Analytics Tool | AgencyAnalytics |
|---|---|---|
Direct Integration | Easily access Matomo analytics. No extra setup is required. | Connect in seconds using the Matomo integration. |
Use Cases | Works for all Matomo users. | Built specifically for marketing agencies managing multiple clients. |
Cost | Included with Matomo, no additional charge. | Included with every AgencyAnalytics plan. |
Multi-Platform | Focused solely on Matomo analytics. | Consolidates data from over 80 marketing platforms. |
User Interface | Simplified and specific to Matomo data. | More customizable using widgets, custom metrics, and the drag-and-drop editor. |
Reporting | Standard Matomo reporting tools with limited customization. | Advanced report customization, including complete white labeling capabilities. |
Client Management | No built-in client management or report sharing tools. | Features like client dashboards, report templates, and custom access for staff and clients. |
Find out why 7,000+ marketing agencies trust AgencyAnalytics with their client reports. Keep your finger on the pulse with accurate marketing data, dashboard and marketing report templates, and so much more. Start your 14-day free trial today.
Summary and Key Takeaways
To ensure your agency is getting the most out of Matomo, take the following steps to improve your analytics approach and client reporting:
Evaluate Your Current Matomo Analytics Approach: Review how you're using Matomo’s tracking code, simple and advanced analytics, and data ownership features to ensure your analytics align with your agency’s (and your client’s) goals.
Explore Third-Party Tools: Consider platforms like AgencyAnalytics to see if they provide a better fit for integrating Matomo analytics with other marketing data and simplifying reporting.
Customize Reports: Use Matomo’s native tools and third-party integrations to tailor reports to each client’s needs, and add white label branding to enhance professionalism.
Set Up Automated Reporting: Leverage automation tools and reporting schedules to keep clients informed about their Matomo campaigns while saving time and minimizing manual updates.
By optimizing any Matomo project through customization and automation, and exploring options like AgencyAnalytics, marketing agencies deliver clearer insights and maintain full control over their client’s website data.
Many of our client relationships require customized reports because we're managing multiple marketing channels for them at once to run cohesive, integrated marketing campaigns. They don't want to see 7 reports, one per platform: Facebook Ads, Google Ads, Email Marketing, Website Analytics, etc. They want everything condensed into one, easy-to-read report, where they can view all of their most significant marketing data in one place. The customizable marketing reports allow us to do just that. The clients love them, and we do too.
Graham Lumley, Director of Growth Marketing, Blackhawk

Written by
Richelle Peace is a writer with a degree in Journalism who focuses on web content, blog posts, and social media. She enjoys learning about different topics and sharing that knowledge with others. When she isn’t writing, Richelle spends time teaching yoga, where she combines mindfulness, movement, and her passion for wellness.
Read more posts by Richelle PeaceSee how 7,000+ marketing agencies help clients win
Free 14-day trial. No credit card required.


