Table of Contents
QUICK SUMMARY:
Average ad spend benchmarks reveal typical monthly spending by marketing agencies across platforms like Google Ads, Facebook Ads, and Amazon Ads. These figures help evaluate campaign performance and align budgets with industry norms. By comparing ad spend trends, this guide highlights opportunities for optimizing strategies and maximizing ROI.
When running client campaigns across multiple platforms, ad spend benchmarks provide clarity in a noisy space. Without these figures, comparing campaign performance across Google Ads, Facebook Ads, and others feels like trying to hit a moving target. Median monthly ad spend values anchor your strategy, offering a clear understanding of what’s typical across the industry.
For marketing teams fine-tuning budgets and justifying spending decisions to clients, these insights are gold. They help answer key questions, such as:
Are budgets aligned with industry norms?
Are opportunities being missed by over- or under-investing in a specific platform?
What is the average ad spend on Google for different industries?
Here’s where things stand for 2025 across most major digital advertising platforms, based on the over 150,000 campaigns run by the over 7,000 marketing agencies using AgencyAnalytics to streamline their client reporting:
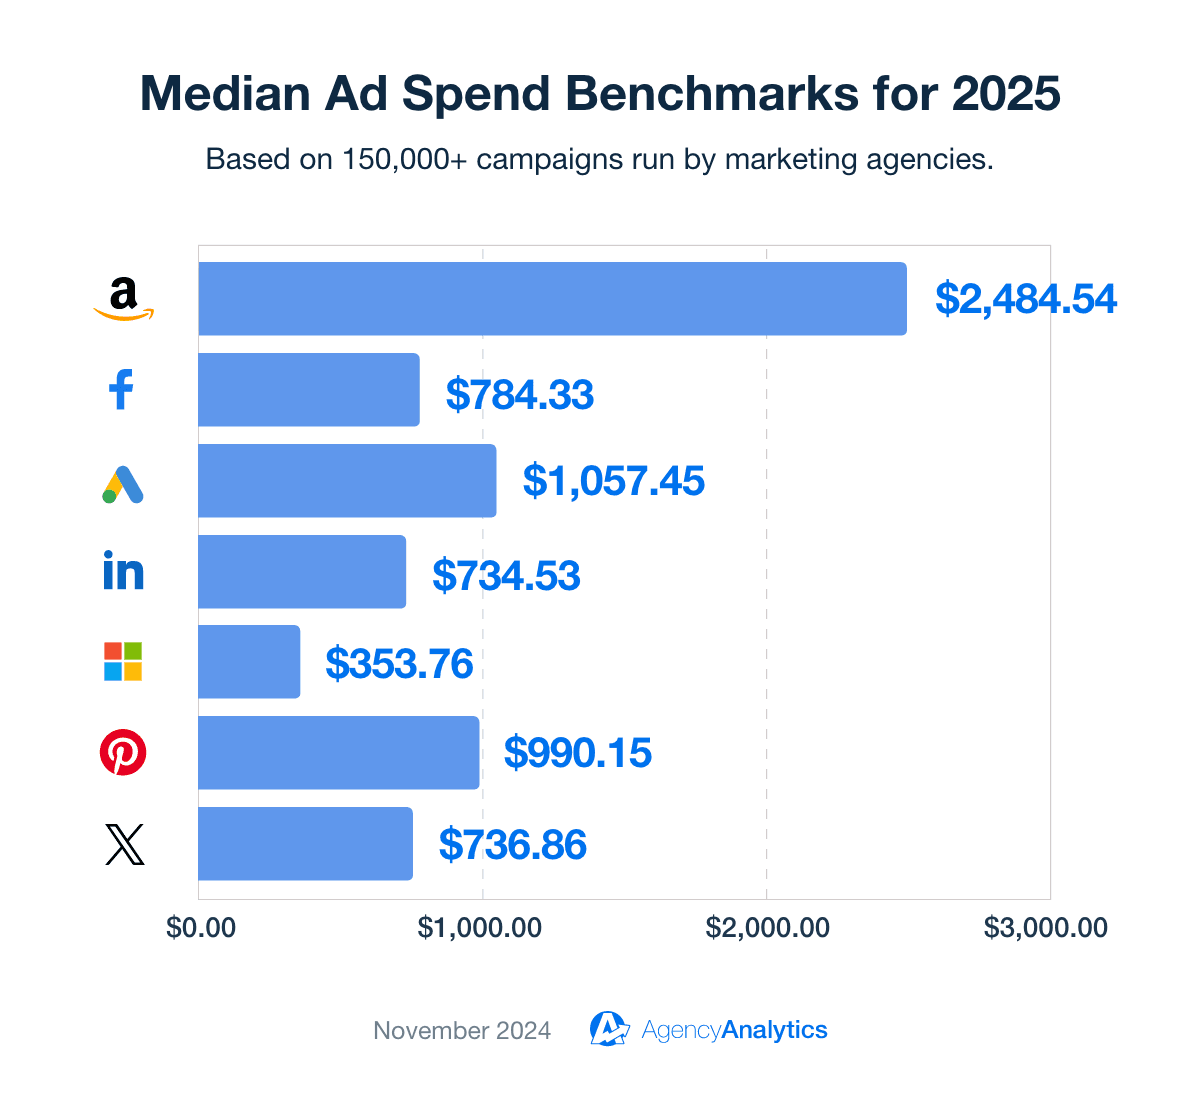
Amazon Ads: $2,484.54 – Surprisingly, Amazon Ads dominates with a high monthly spend, reflecting its power in ecommerce.
Facebook Ads: $784.33 – Tailored targeting with smaller budgets delivers strong ROI potential.
Google Ads: $1,057.45 – A solid investment for capturing high-intent search traffic.
LinkedIn Ads: $734.53 – Connects professionals without blowing through budgets.
Microsoft Ads: $353.76 – Budget-friendly for reaching underutilized search audiences.
Pinterest Ads: $990.15 – Inspires early buying interest through visually rich content.
Snapchat Ads: $1,442.77 – Delivers engagement with younger audiences at a competitive spend.
Spotify Ads: $1,085.03 – Elevates brand visibility with audio campaigns.
X (Twitter) Ads: $736.86 – Maintains relevance with a steady commitment to concise messaging.
Whether budgets lean toward high-spend platforms like Amazon Ads or focus on maximizing ROI with modest allocations on Facebook, this guide sets the foundation for smarter spending. Dive deeper into how each platform’s ad spend compares and what it means for optimizing campaign performance.
Keep reading as we dig into the data and what it tells us, based on benchmarks from over 150,000 marketing campaigns, to give the full picture of average ad budgets for campaigns run by agency professionals.
Why Ad Spend Benchmarks Matter
Ad spend benchmarks are like a map for navigating your client campaigns. They show what typical investments look like across platforms, helping you allocate resources smartly and evaluate performance with confidence.
For example, if your agency runs campaigns for a boutique skincare brand, benchmarks for Facebook Ads could help you figure out whether you're overspending to hit that conversion goal—or if there's room to stretch the budget and test a new audience.
They make a messy, competitive landscape easier to navigate.
Using Ad Spend Benchmarks To Evaluate Campaign Budgets
Are you spending enough on a particular platform? Or maybe too much? Ad spend benchmarks help answer those questions, giving you a clear reference point to guide your campaign budgets and performance goals.
Whether you're focusing on Google Ads for search campaigns or LinkedIn to connect with professionals, these benchmarks help steer your strategy in the right direction.
Imagine for a moment that you’re managing LinkedIn ads for a software startup client. You see that LinkedIn benchmarks show a higher-than-average cost-per-click, but they also deliver some of the highest-quality leads. Although the CPC is higher than average, the client is currently investing less than 50% of the ad spend compared to others in their industry. By sharing this with your client, you justify allocating more budget toward LinkedIn–despite the higher CPCs–while setting the right expectations.
Impact on Client Satisfaction and Retention
Clients love transparency, especially when it’s backed by industry data. Consider a hypothetical fitness studio client who is concerned about the cost of their Facebook ads campaign, despite strong performance.
Benchmarks might show that studios in similar niches typically allocate 20% more budget to Facebook ads because of their strong engagement rates. By showing your clients the average Facebook ads cost within their industry, you reassure them that their spending isn’t just justified—it’s strategic.
Driving Campaign Success Through Benchmarks
Benchmarks help you make informed adjustments to drive better results.
Say you’re running a multi-platform campaign for a healthcare client. If benchmarks show that Facebook ads generate less ROI on a higher-than-average spend while Google ads exceed all performance benchmarks (except the allocated budget), it’s a clear sign that a portion of the Facebook budget should be shifted to scaling up on Google.
By comparing your client’s current Facebook and Google Ads budget to industry standards, you easily make the case for shifting the investment to stay competitive while optimizing campaigns to stretch their dollars further.
Want to show off how well your agency exceeds these industry standards? Automatically include benchmarks in agency dashboards and client reports. Get started with a 14-day free trial.
The Value of Industry Benchmarks
Benchmarks turn isolated data into actionable insights, offering clarity on whether campaign budgets are competitive, excessive, or lagging.
However, not all benchmarks are created equal. To draw meaningful conclusions, it’s vital to look deeper into the numbers—especially when comparing averages and medians.
Why Median Values Are More Insightful Than Averages
While averages are commonly used, they often fail to tell the whole story. Median values provide a more insightful and practical perspective, especially for marketing agencies managing diverse client campaigns.
Here’s why the median outshines the average in marketing benchmarking:
Averages Can Be Skewed: A handful of unusually high or low ad spend campaigns will pull the average in one direction, distorting the picture. For example, a few large-budget campaigns on Amazon Ads could inflate the average, making typical budgets look far higher than they are.
Median Reflects the Typical Campaign: By identifying the midpoint of all campaigns, the median offers a clearer view of what most advertisers are spending. Half of the campaigns fall above this value, and half fall below, making it a better measure of the standard spend.
Focus on Relevance: Agencies need benchmarks that reflect the real-world budgets their peers are managing, not outliers. Median values achieve this by cutting through noise and anchoring expectations to realistic numbers.
AgencyAnalytics uses median values for its benchmarks because they’re more practical and actionable. Marketing agencies benefit from data that reflects the norm, allowing them to compare client campaigns with confidence. Unlike averages, which can be misleading, medians provide a true baseline for evaluating and optimizing ad spend.
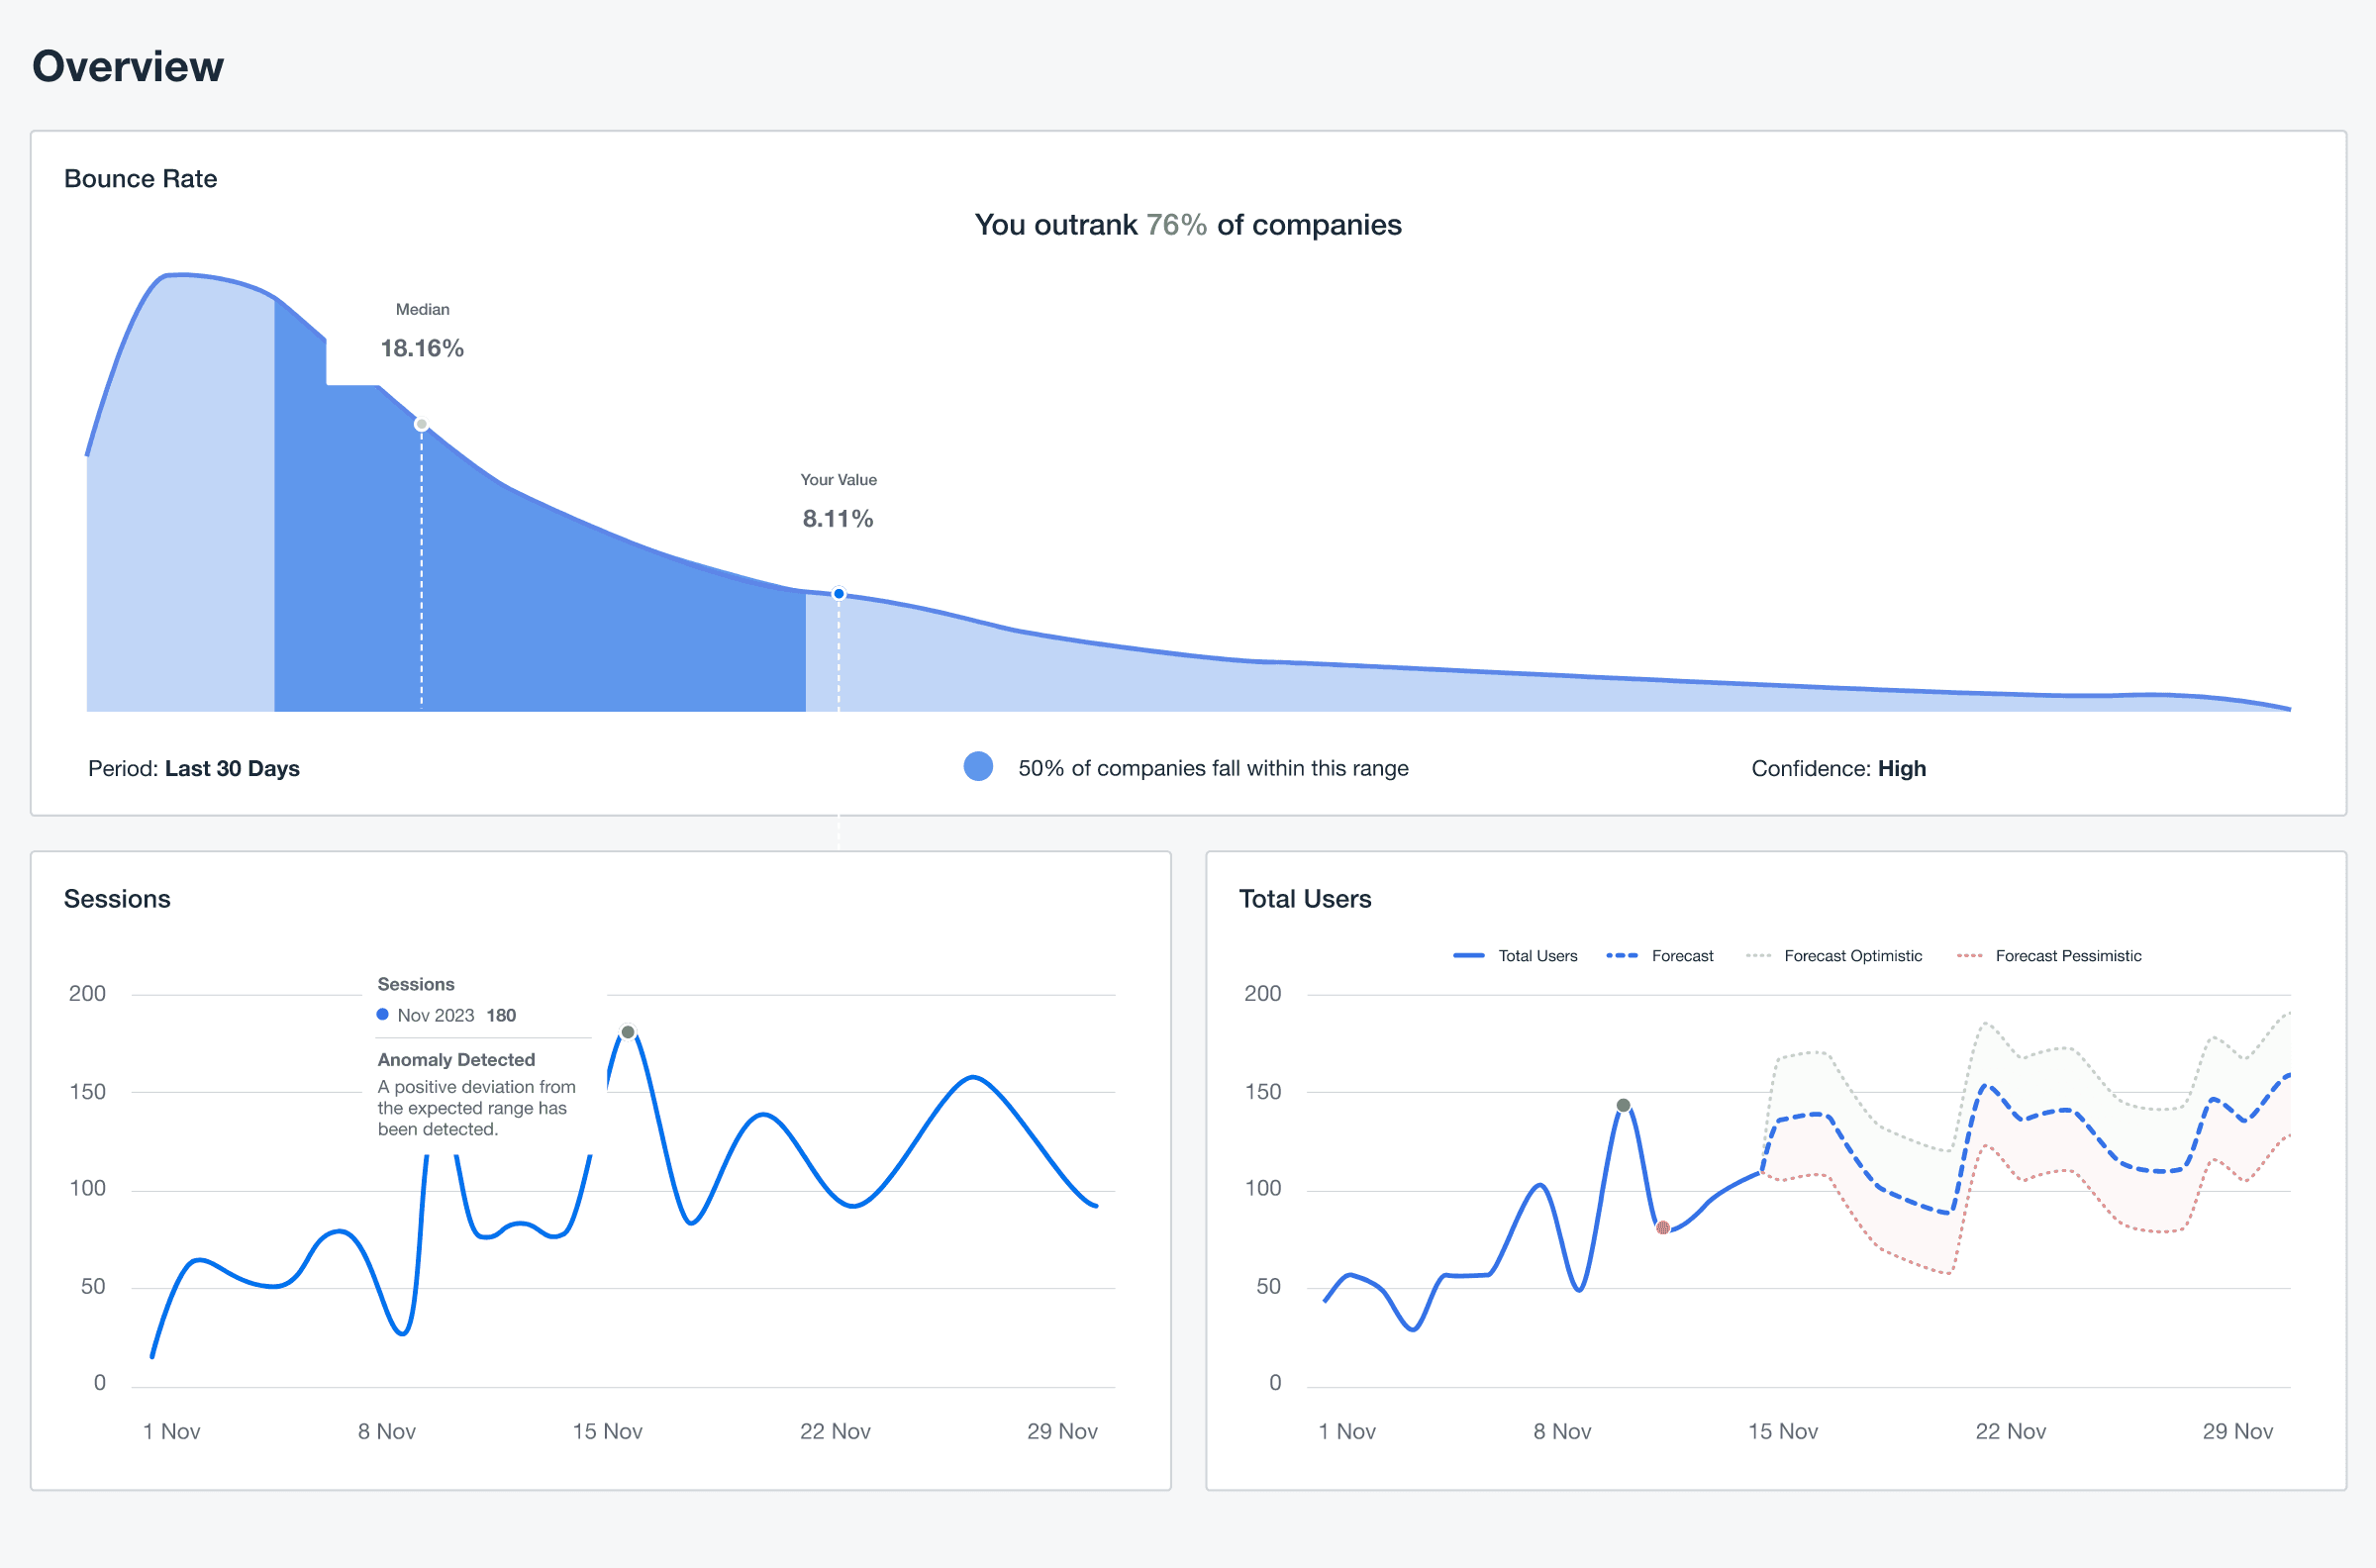
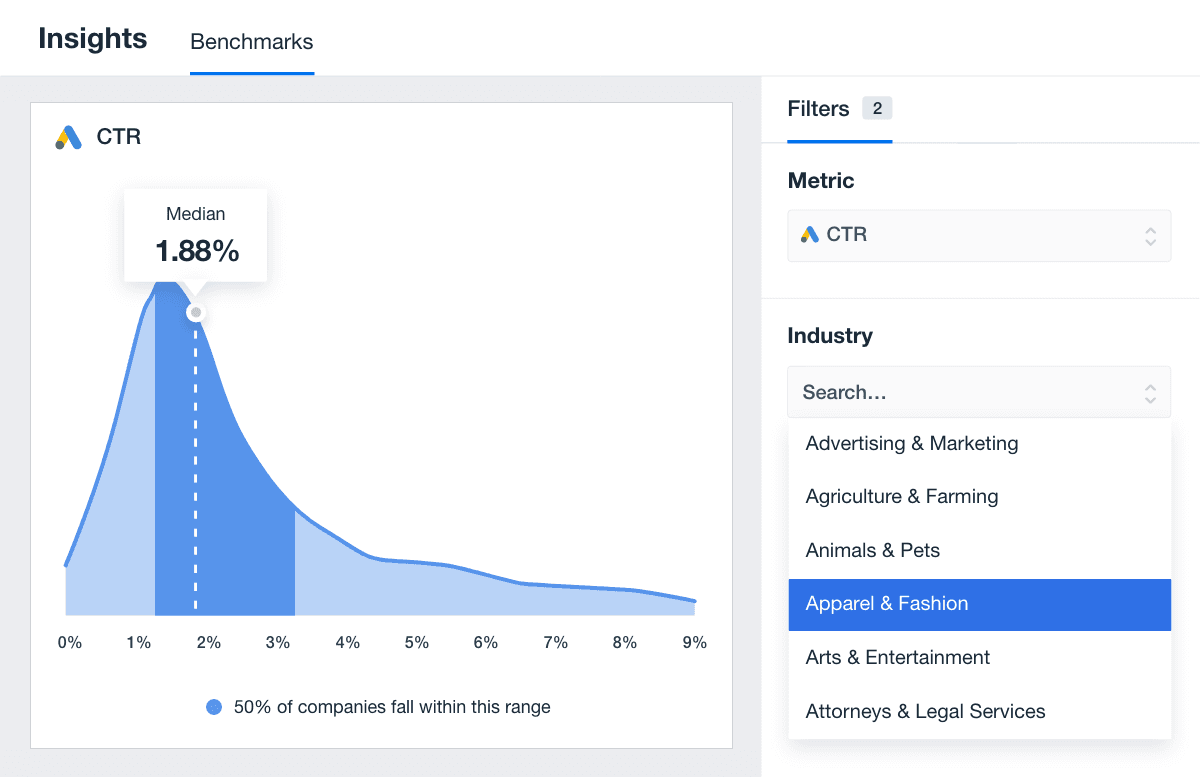
Benchmarks are just one of the premium performance insights features available on AgencyAnalytics. Try it for 14 days free.
Common Misconceptions About Ad Spend Benchmarks
Benchmarks are often misunderstood or misapplied. Here are a few myths worth dispelling:
Myth #1 - Higher Spend Always Equals Better Results: Bigger budgets don’t guarantee better performance. Efficiency and targeting matter more than the amount of money spent.
Myth #2 - Benchmarks Are Universal: Ad spend varies significantly by platform, audience size, industry, and campaign goals. Applying a one-size-fits-all approach leads to inaccurate conclusions.
Myth #3 - Benchmarks Dictate Budgets: While benchmarks guide decisions, they don’t replace the need for customized budgets based on specific client goals and market conditions.
Understanding these nuances helps agencies use benchmarks wisely, without over-relying on them or misinterpreting the data.
How Agencies Use Benchmarks To Guide Strategy
Ad spend benchmarks provide valuable insights that help refine strategies and drive better campaign outcomes. Here’s how marketing agencies use them effectively:
Budget Allocation: Benchmarks help prioritize platforms based on typical spend levels, ensuring resources are distributed efficiently.
Performance Assessment: Comparing client campaigns to industry benchmarks highlights areas for improvement and showcases where campaigns excel.
Client Education: Agencies use benchmarks to set realistic expectations, showing clients how their ad spend aligns with industry norms.
Our agency builds out a marketing strategy per tactic for each client, which includes goals such as social channel page growth, improved content engagement, or increased return on ad spend.
The reports that we build in AgencyAnalytics are customized to the exact KPIs that match up with these goals. It's so easy to add a block or create a trend graph in a report and then let AgencyAnalytics do all of the heavy lifting from there. Clients love it.
Paul Echols, Creative Director & Agency Owner, Square 205
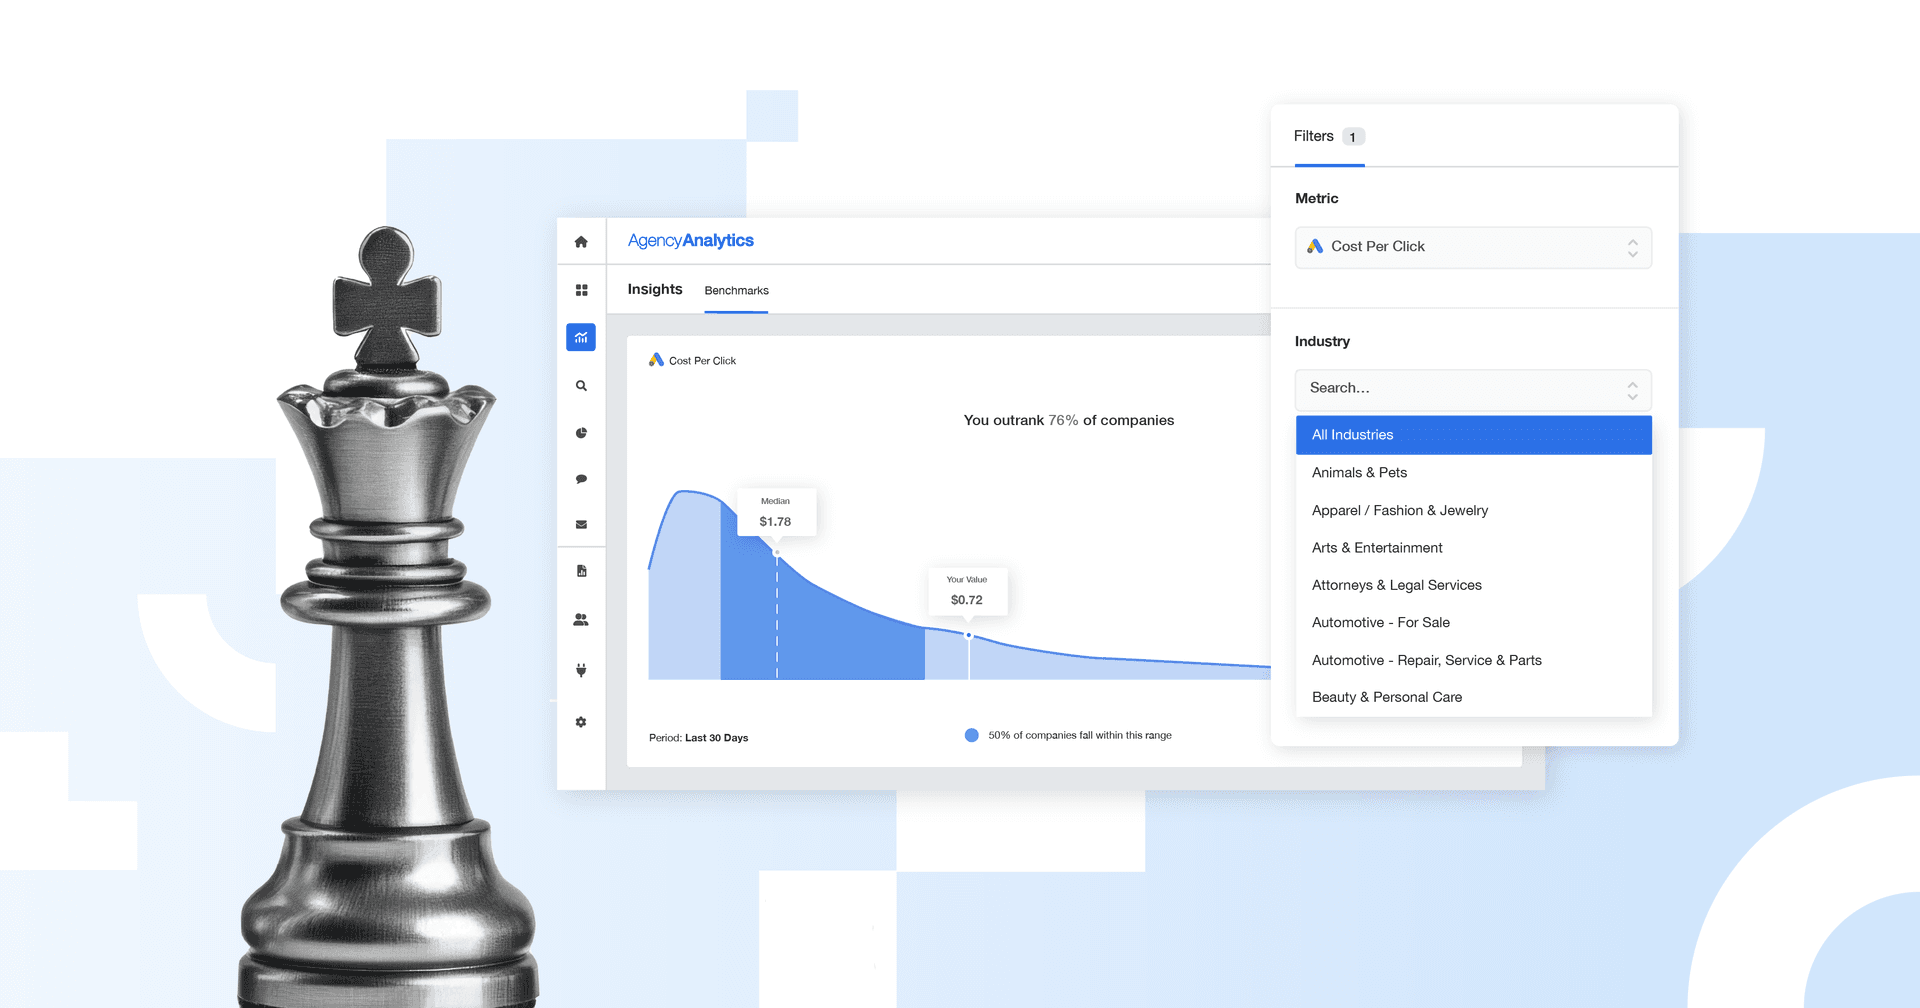
Set performance goals for clients using proven industry benchmarks as your guide. The goal and budget tracking feature measures progress, ensures transparency, and demonstrates how your agency is driving results. Start today with a 14-day free trial.
What Sets AgencyAnalytics Benchmarks Apart
Many benchmarks in the market rely on general or aggregated data that includes a mix of amateur campaigns, large enterprises with multi-million dollar budgets, and non-professional advertisers. AgencyAnalytics benchmarks stand out because they’re based exclusively on professional marketing agencies managing client campaigns.
This distinction ensures the data is:
More Relevant: Reflecting strategies used by expert marketers rather than a mix of amateurs and professionals.
Actionable: Grounded in campaigns that aim for efficiency, ROI, and professional results, not guesswork.
Focused: Derived from agencies handling diverse client portfolios, offering a clearer view of industry-wide best practices.
For agencies looking to compare their efforts against credible benchmarks, AgencyAnalytics provides a level of trust and specificity that generic sources lack.
Average Ad Spend by Platform
Knowing where to invest is half the battle when allocating advertising budgets. Average ad spend benchmarks by platform provide a valuable snapshot of industry spending, helping agencies set realistic budgets and prioritize platforms for maximum ROI.
Average Google Ads Monthly Spend
The median monthly spend for Google Ads is $1,057.45, offering a clear benchmark to guide budget planning and optimization. Google Ads continues to be a key platform for reaching targeted audiences through search ads and strategic ad placements.
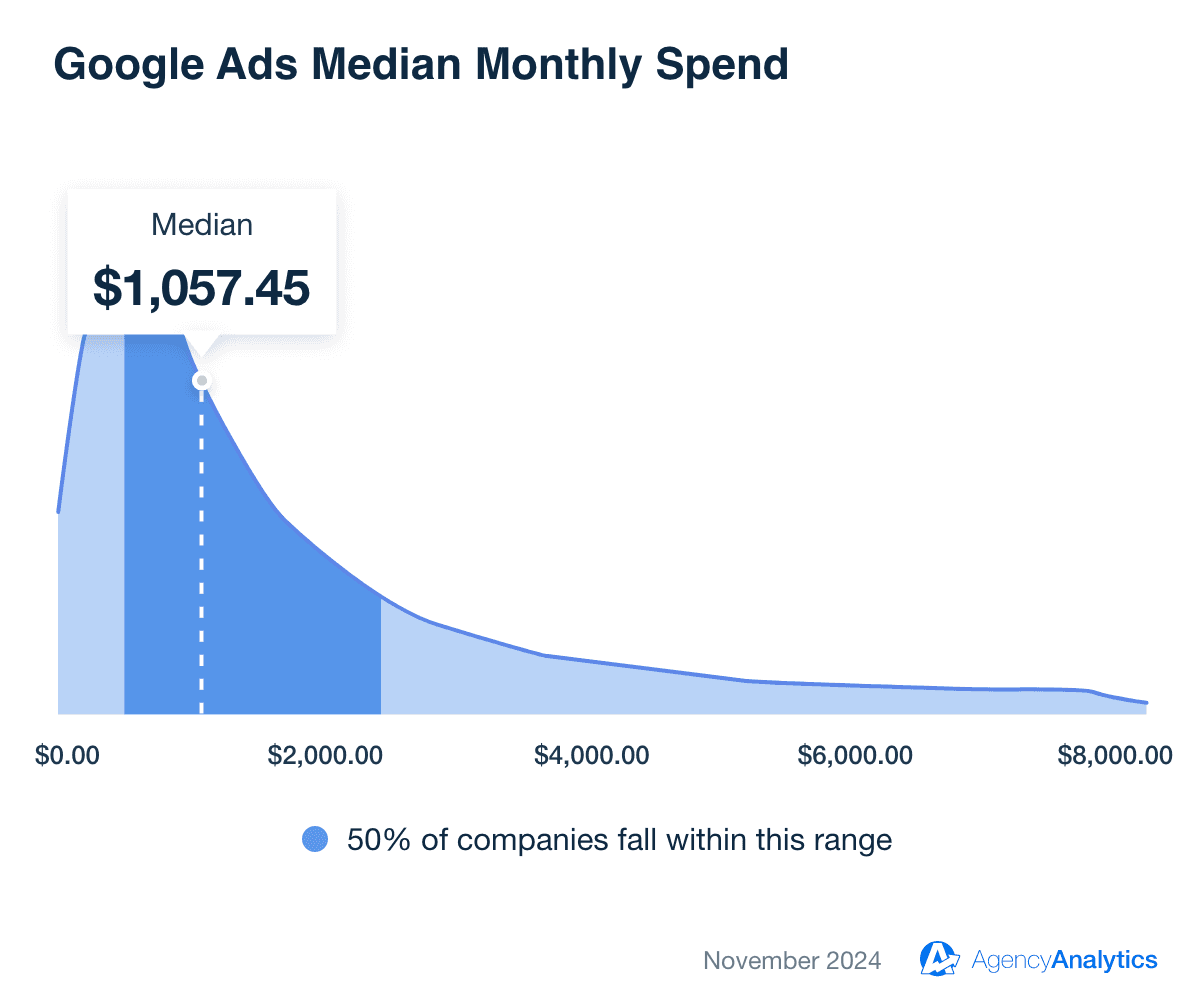
The median spend on Google Ads varies significantly by industry, reflecting how different client types allocate budgets for targeted Google ads. For instance, industries like Roofing (with a median spend of $2,219.40) and Furniture (with budgets averaging closer to $1,489.29) demonstrate higher investment levels, likely due to the competitive nature of these markets and the significant value of each lead.
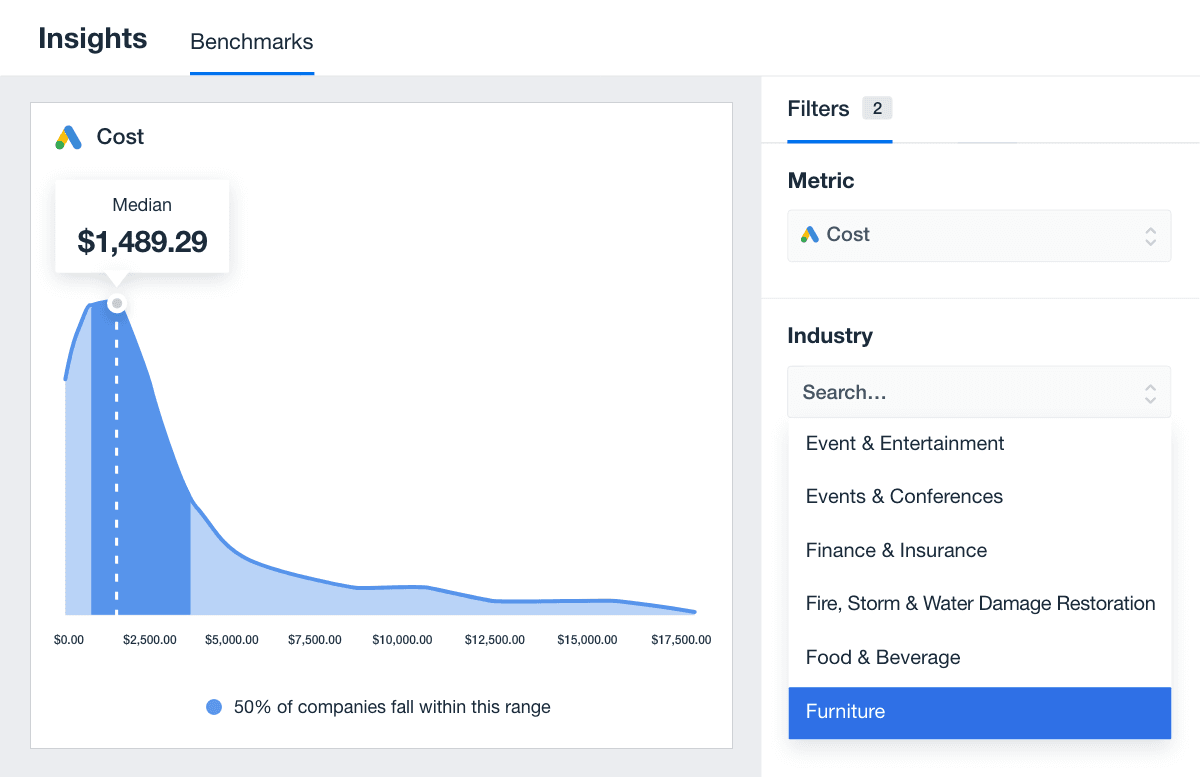
On the other hand, industries such as Restaurants ($679.78) and Storage & Moving ($692.76) typically invest less. These differences may reflect lower Cost-Per-Click (CPC) rates or a more limited target audience. Understanding these variations helps contextualize ad placements and spending trends.
Average Monthly Google Ads Spend by Industry
Industry | Median Google Ads Spend by Industry |
|---|---|
Advertising & Marketing | $786.57 |
Animals & Pets | $1,019.93 |
Apparel & Fashion | $1,479.14 |
Arts & Entertainment | $968.05 |
Attorneys & Legal Services | $1,637.17 |
Automotive Parts & Services | $930.84 |
Beauty & Personal Care | $1,098.58 |
Business Services | $1097.55 |
Dental Services | $1,156.61 |
Education | $1,112.68 |
Electrical Services | $838.79 |
Finance & Insurance | $934.87 |
Food & Beverage | $1,001.47 |
Furniture | $1,489.29 |
Health & Fitness | $1,179.48 |
Home Improvement | $1,206.36 |
HVAC Repair | $1,419.35 |
Non Profit | $1,769.62 |
Plumbing | $1,198.82 |
Real Estate | $986.33 |
Restaurants | $679.78 |
Roofing | $2,219.40 |
Sports & Recreation | $1,144.63 |
Storage & Moving | $692.76 |
Travel | $847.73 |
Average Facebook Ads Monthly Spend
The median monthly spend for Facebook Ads across industries is $784.33, making it a popular choice for businesses seeking cost-effective social media advertising. Facebook ad campaigns are a staple for reaching target audiences on social media platforms, offering flexibility and reach across a range of audiences.
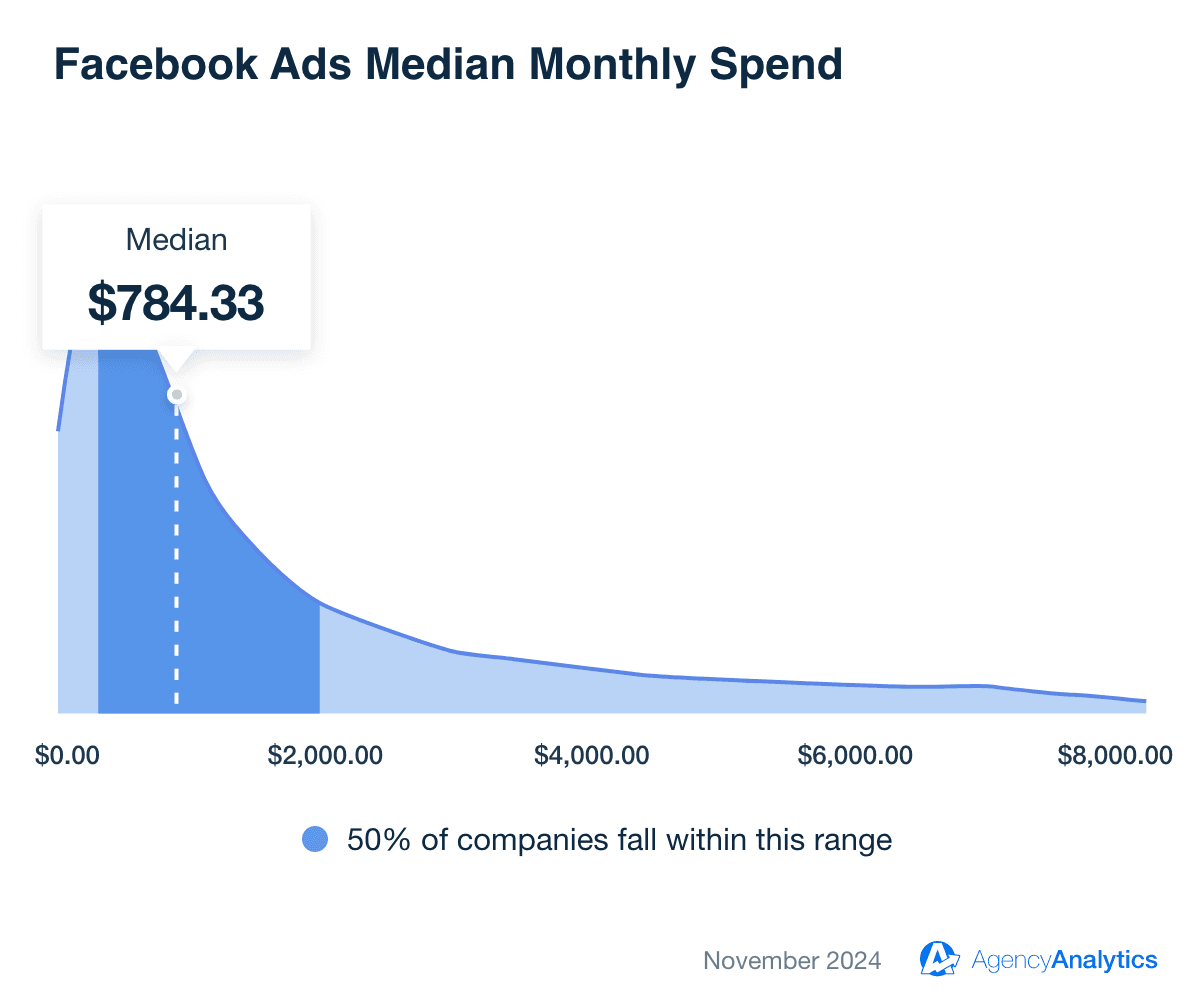
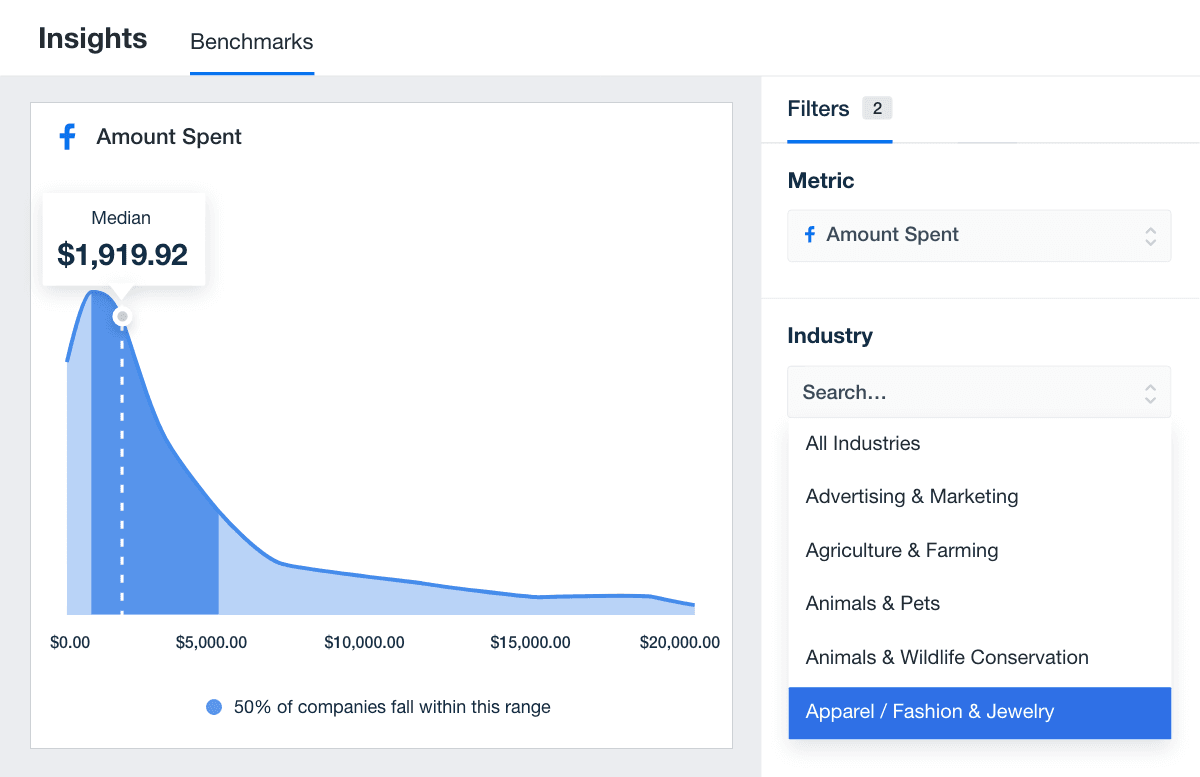
Spending varies widely depending on the industry. Apparel & Fashion leads the pack with a median spend of $1,919.92, reflecting the platform’s effectiveness for visual storytelling and driving ecommerce. Categories like Beauty & Personal Care ($1,234.38) and Food & Beverage ($1,229.89) also allocate larger budgets, leveraging Facebook’s ability to connect with highly engaged audiences.
On the other end, industries like Automotive Parts & Services ($475.19) and Plumbing ($486.84) typically invest less in Facebook advertising costs, likely due to more localized campaigns or narrower target audiences. Despite the differences, Facebook’s wide user base and robust targeting options make it a key player in social media platforms for advertising.
Average Monthly Facebook Ads Spend by Industry
Industry | Median Facebook Ads Spend by Industry |
|---|---|
Advertising & Marketing | $520.24 |
Animals & Pets | $698.12 |
Apparel & Fashion | $1,919.92 |
Arts & Entertainment | $932.34 |
Attorneys & Legal Services | $660.63 |
Automotive Parts & Services | $475.19 |
Beauty & Personal Care | $1,234.38 |
Business Services | $788.41 |
Dental Services | $511.73 |
Education | $866.81 |
Electrical Services | $490.60 |
Finance & Insurance | $831.71 |
Food & Beverage | $1,229.89 |
Furniture | $1401.84 |
Health & Fitness | $945.25 |
Home Improvement | $871.20 |
HVAC Repair | $538.00 |
Non Profit | $918.24 |
Plumbing | $486.84 |
Real Estate | $497.79 |
Restaurants | $615.65 |
Roofing | $973.58 |
Sports & Recreation | $999.14 |
Storage & Moving | $743.09 |
Travel | $594.11 |
Average LinkedIn Ads Monthly Spend
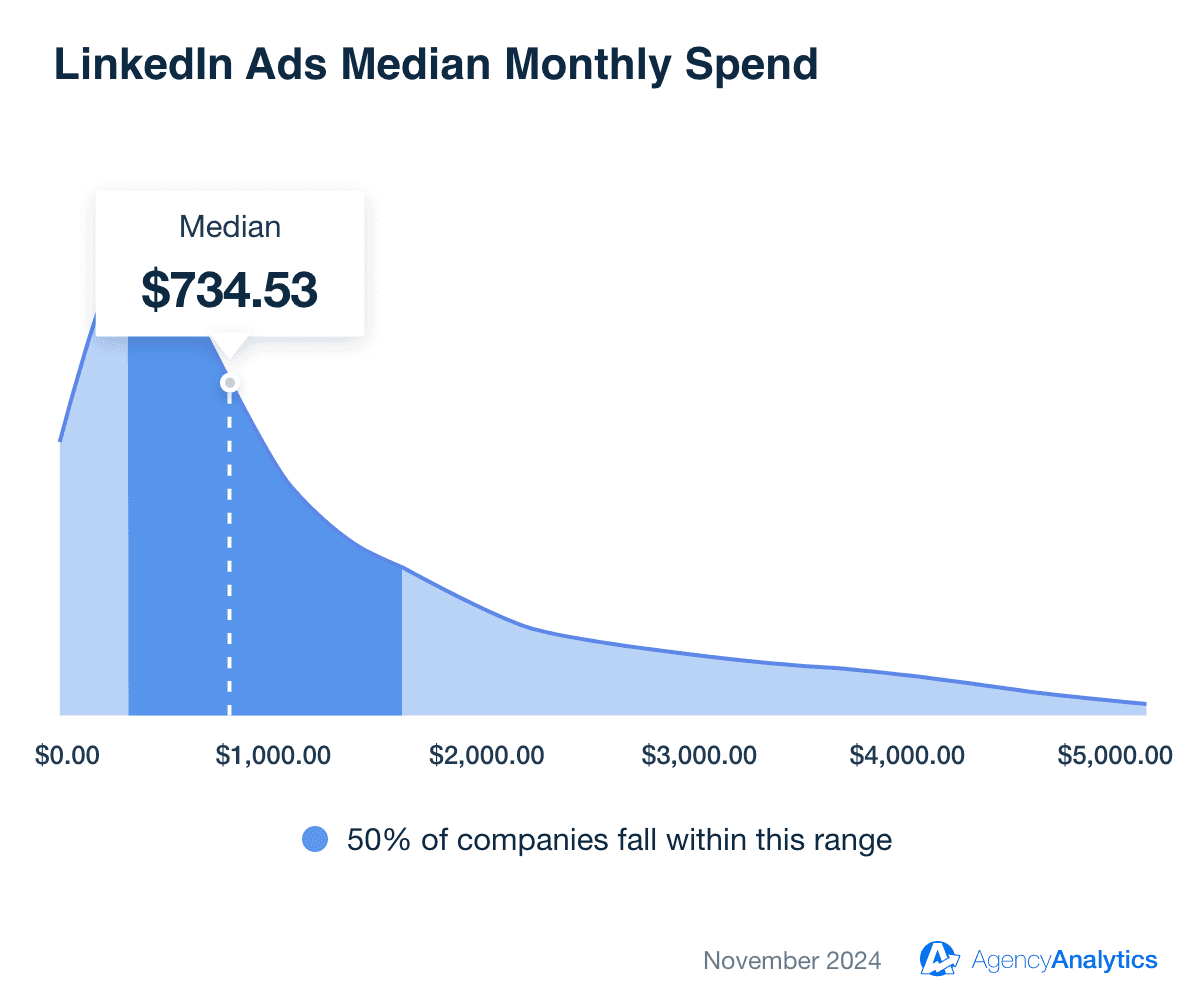
The median monthly spend for LinkedIn Ads is $734.53, reflecting its position as a go-to platform for reaching professional audiences. Known for its focus on B2B connections, LinkedIn excels at helping businesses engage with decision-makers and industry professionals.
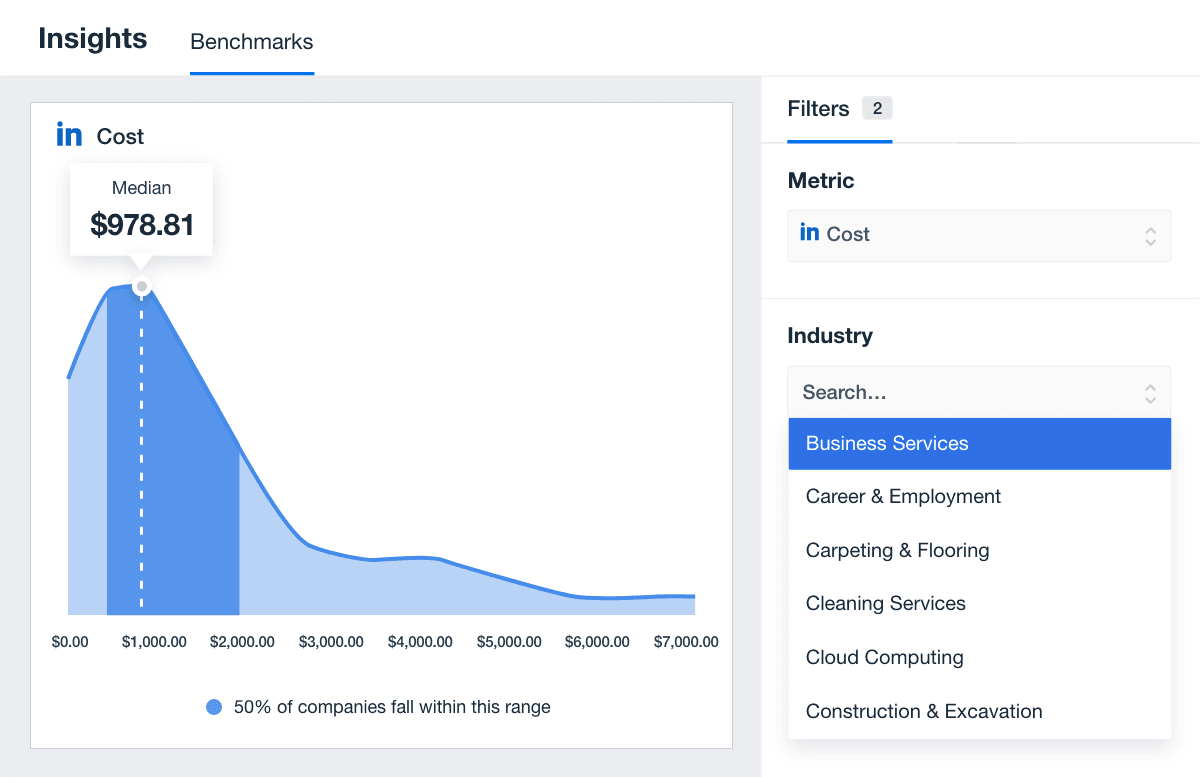
Spending varies by industry, particularly in sectors that thrive on professional networking and expertise. Business Services leads with a median spend of $978.81, showcasing LinkedIn’s strength in connecting B2B marketers with qualified leads.
Similarly, Health & Fitness ($1,002.06) and Finance & Insurance ($843.32) allocate higher budgets, likely due to the value of targeting LinkedIn’s professional audience with tailored messaging.
Whether clients aim to generate leads, build thought leadership, or foster industry connections, these benchmarks serve as a guide to structuring campaigns that align with their goals and budgets.
Average Monthly LinkedIn Ads Spend by Industry
Industry | Median LinkedIn Ads Spend by Industry |
|---|---|
Advertising & Marketing | $705.45 |
Business Services | $978.81 |
Education | $714.96 |
Finance & Insurance | $843.32 |
Health & Fitness | $1,002.06 |
Average X (Twitter) Ads Monthly Spend
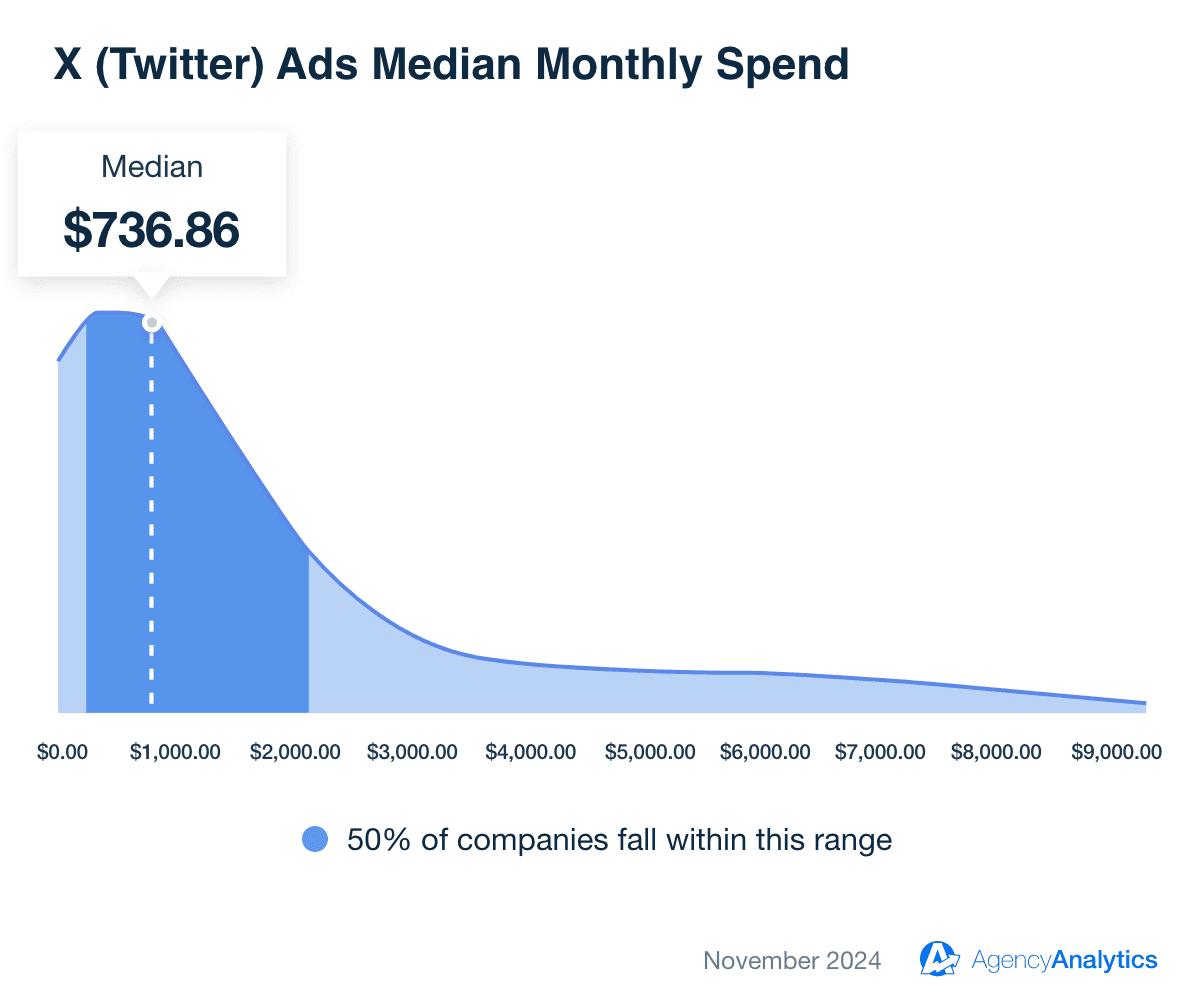
The median monthly spend for X (formerly Twitter) Ads is $736.86, making it a cost-effective option for businesses aiming to connect with engaged audiences. Known for its real-time nature, X is ideal for ad campaigns that prioritize concise messaging and timely interactions.
Average Amazon Ads Monthly Spend
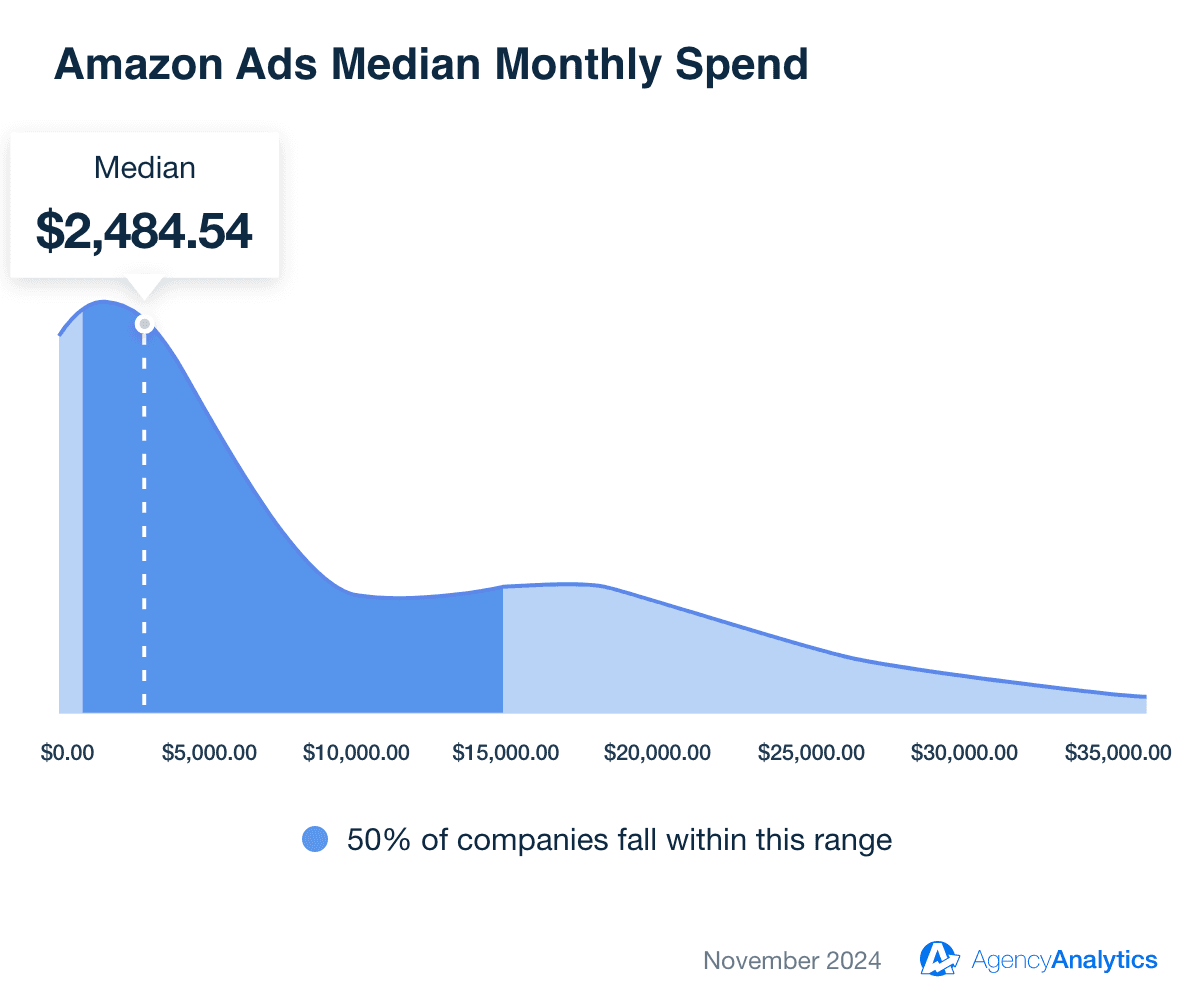
The median monthly spend for Amazon Ads is $2,484.54, reflecting its dominance as a platform for ecommerce and product-focused advertising. With high purchase intent from its audience, Amazon offers businesses a direct path to converting shoppers through targeted ad placements.
Average Pinterest Ads Monthly Spend
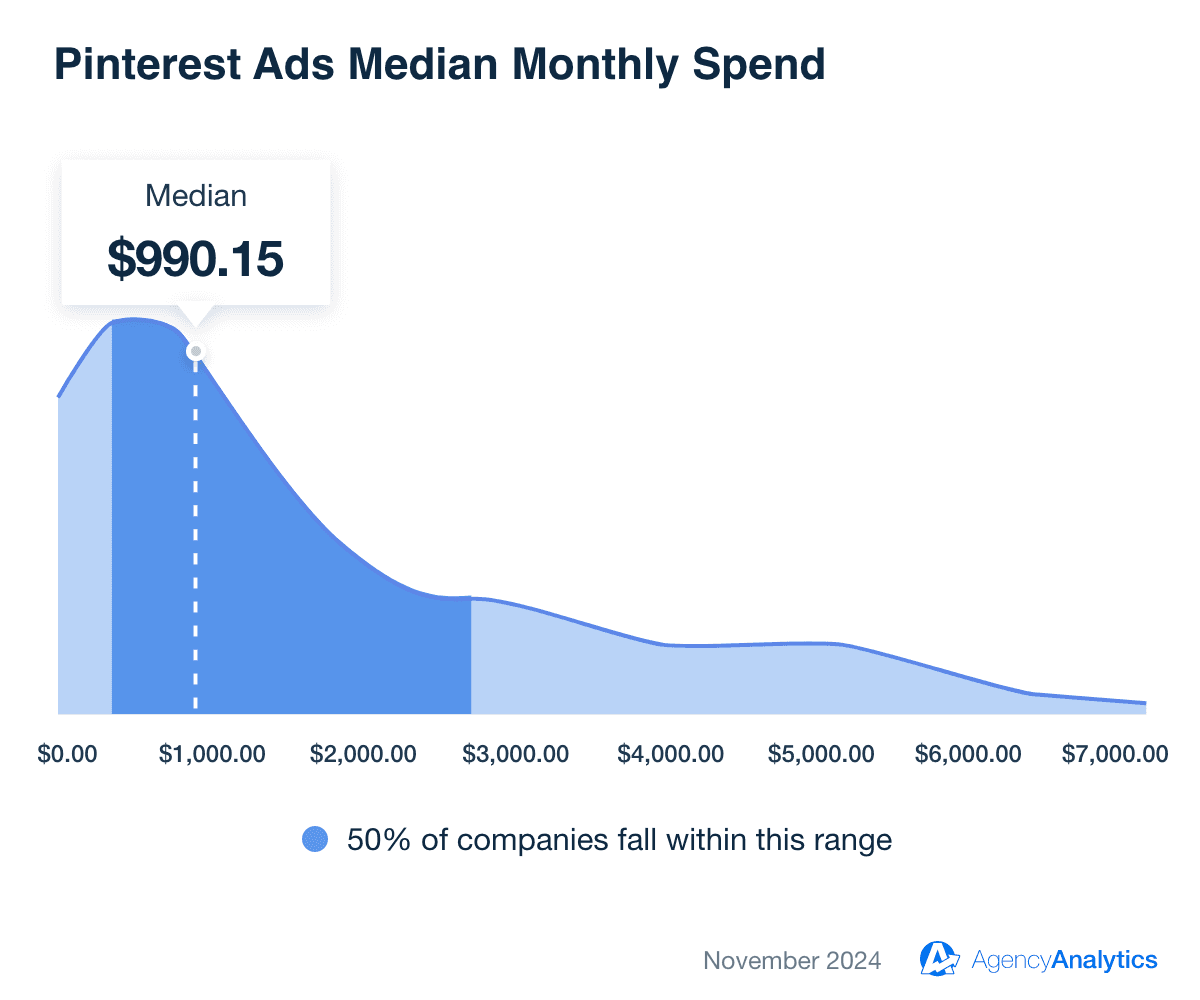
The median monthly spend for Pinterest Ads is $990.15, highlighting the platform’s appeal for businesses focused on visual discovery and inspiration. Pinterest’s audience often uses the platform to plan purchases, making it ideal for ad campaigns targeting consumers in the early stages of decision-making.
Average Snapchat Ads Monthly Spend
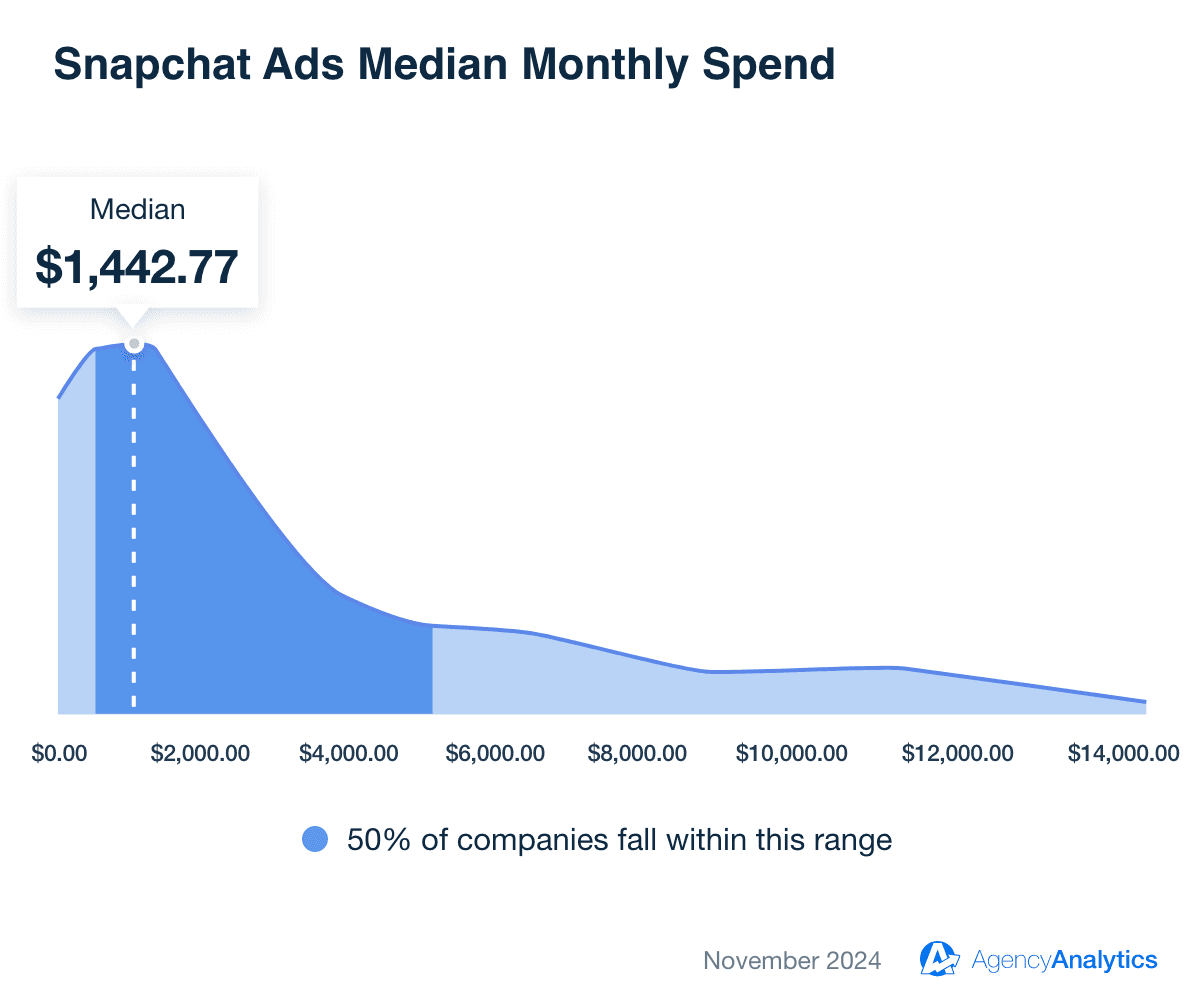
The median monthly spend for Snapchat Ads is $1,442.77, reflecting its role as a key platform for engaging younger, mobile-first audiences. Snapchat’s interactive ad formats and immersive content make it a strong choice for ad campaigns aimed at driving brand awareness and fostering direct engagement.
Average Spotify Ads Monthly Spend
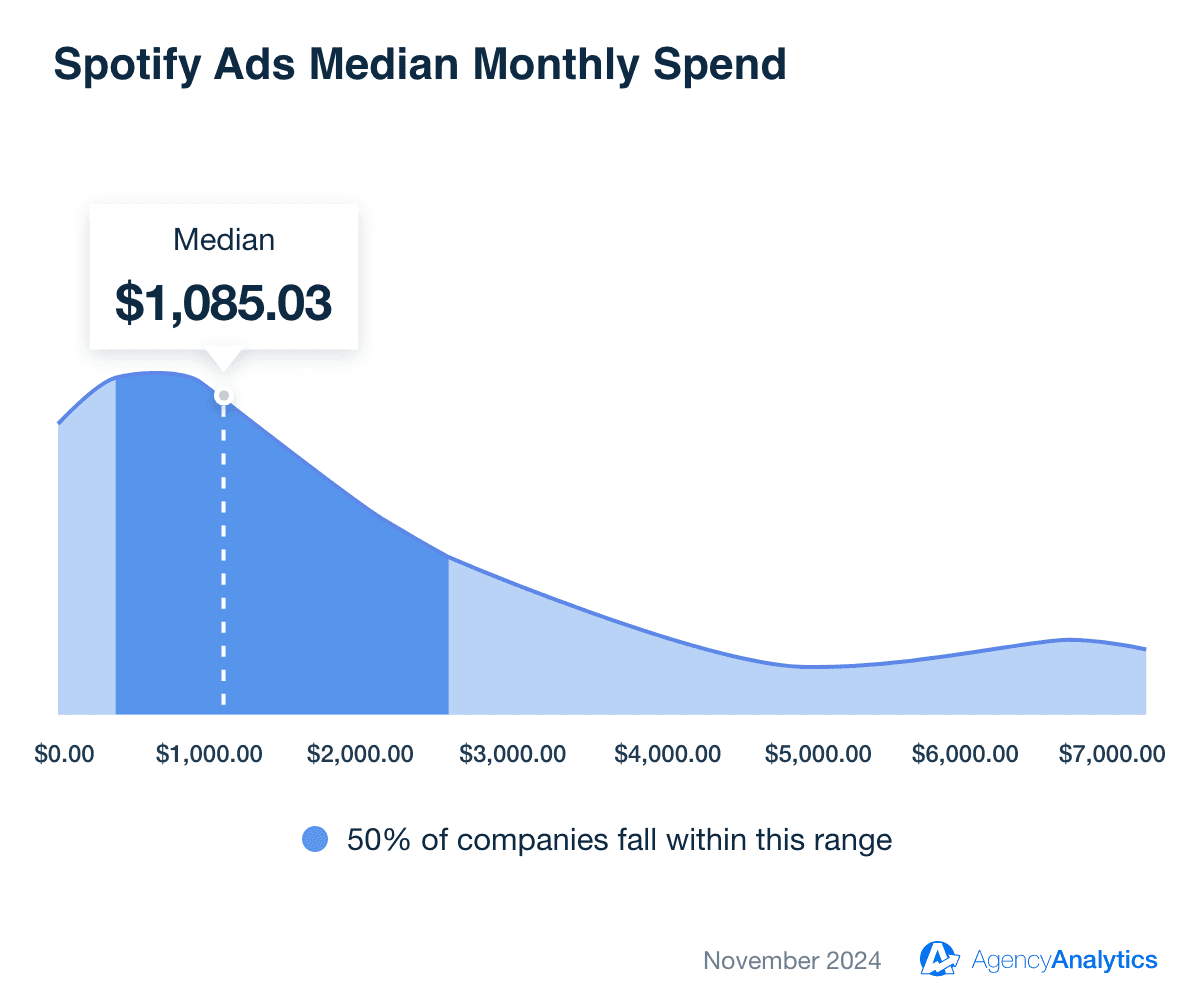
The median monthly spend for Spotify Ads is $1,085.03, emphasizing its value as a platform for audio-first advertising. With its extensive reach and engaged listener base, Spotify offers businesses a unique opportunity to connect with audiences through targeted, non-intrusive ad placements.
Recap: The Average Monthly Ad Spend by Platform Is…
Ad Platform | Average Monthly Ad Spend |
|---|---|
Amazon Ads | $2,484.54 |
Facebook Ads | $784.33 |
Google Ads | $1,024.79 |
LinkedIn Ads | $734.53 |
Microsoft (Bing) Ads | $353.76 |
Pinterest Ads | $990.15 |
Snapchat Ads | $1.442.77 |
Spotify Ads | $1,085.03 |
X (Twitter) Ads | $736.86 |
How To Interpret Ad Spend Benchmarks
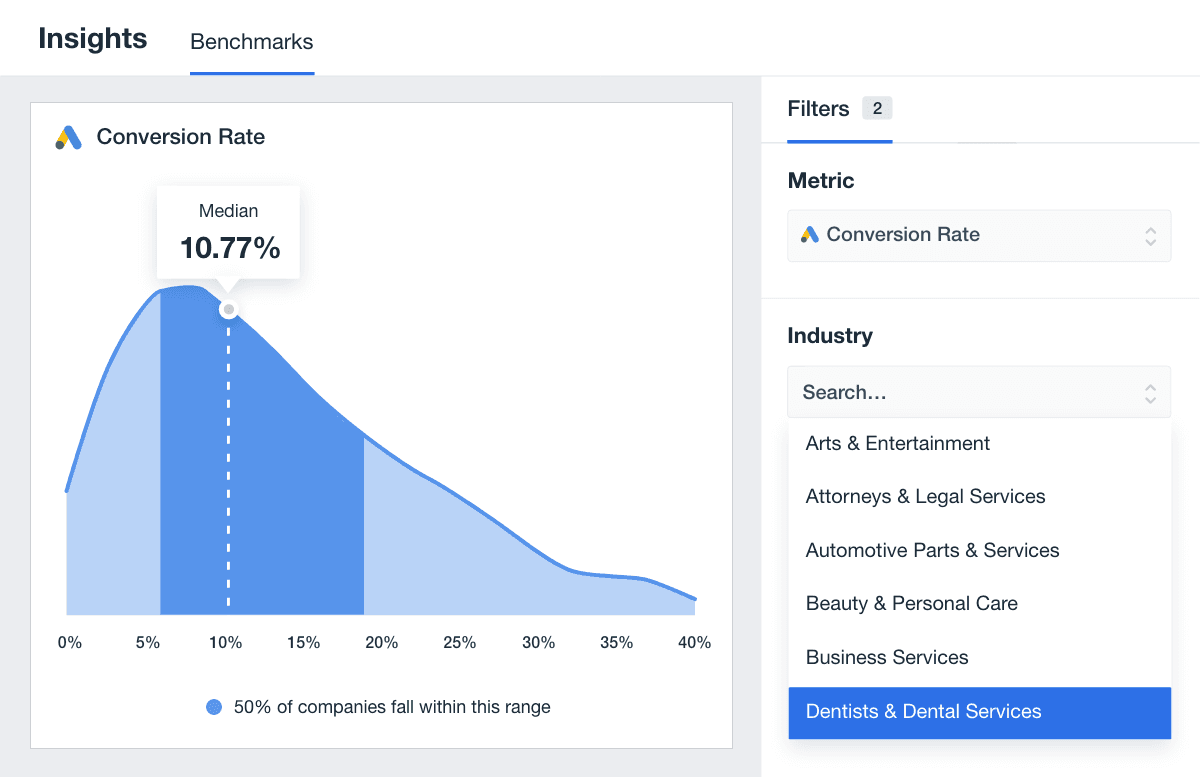
Benchmarks provide valuable context, but understanding their implications is key to making data-driven decisions. Benchmarks are not strict rules—they’re reference points to guide budget planning, performance analysis, and bidding strategy adjustments.
When a Low Ad Spend Isn’t (Necessarily) a Bad Thing
A lower ad spend often aligns with specific strategies or business needs. For instance:
Targeted Campaigns: Campaigns focusing on niche audiences or hyper-local targeting typically require smaller budgets. For example, a business using a carefully tuned bidding strategy for search ads might achieve high ROI even with minimal spend.
Seasonal Fluctuations: Temporary drops in spending during off-peak seasons or market slowdowns are normal and may not reflect inefficiency.
Efficient Performance: A low spend might also indicate optimized campaigns achieving significant results with fewer resources. For example, a Google Ads specialist might implement strategies that increase click-through rates and reduce CPCs, saving money while driving improved performance.
In these scenarios, a low spend is not a red flag but rather an indicator of precision and smart resource allocation.
When a High Ad Spend Might Signal Potential Problems
While higher ad budgets often reflect aggressive goals, they can sometimes indicate inefficiencies or issues, such as:
Broad Targeting: Overspending often stems from targeting audiences too broadly, leading to wasted impressions and clicks.
Lack of Optimization: Campaigns that fail to adjust keywords, ad placements, or creative elements over time will burn through budgets without delivering meaningful results.
Uncompetitive Bidding Strategy: If CPC or CPM is unusually high, the problem may lie in the bidding strategy or ad scheduling settings. For example, unoptimized Facebook audiences can inflate costs.
High spending isn’t inherently bad, but consistent underperformance at elevated costs signals the need for closer analysis and refinement.
Using Benchmarks To Identify Opportunities for Optimization
Ad spend benchmarks provide clear insights into areas for improvement. Here’s how to use them effectively:
Spot Over or Underinvestment: Compare campaign budgets to industry medians to detect where spending is off balance. If a budget is far below the benchmark, consider whether low spending levels will limit visibility or competitiveness. Conversely, spending well above the benchmark may indicate wasted resources.
Evaluate Bidding Efficiency: Review CPCs against industry benchmarks to determine if adjustments can be made to reduce costs and improve effectiveness.
Adjust Platform Priorities: Benchmarks help allocate budgets more effectively across platforms. For instance, if Facebook ad pricing and performance aligns better with client goals than other platforms, prioritizing Facebook could improve overall campaign performance.
By interpreting benchmarks in context, marketing agencies gain a clear perspective on where campaigns excel, where adjustments are needed, and how to align strategies for maximum impact.
Clients want to see value for the services they pay us for. If the data indicates that there are additional opportunities to increase ad spend, the reports we generate with AgencyAnalytics is how we communicate it.
Ryan Hayes, CEO, Sparrow Digital
Benchmarks are tools, not mandates, but when used wisely, they drive smarter decisions and better outcomes.
Using Benchmarks to Position Your Marketing Agency
Ad spend benchmarks are powerful assets for demonstrating your agency’s value and expertise. By leveraging these up-to-date insights, marketing agencies position themselves as strategic partners who deliver data-driven recommendations tailored to client goals.
Here’s how benchmarks enhance your agency’s positioning:
Setting Realistic Expectations: Clients often have unclear or inflated assumptions about ad budgets (and other KPIs). Benchmarks allow marketing teams to ground conversations in real-world data. For instance, highlighting the typical spending patterns on search ads for companies in their industry helps establish a realistic Google ads budget estimate that builds trust and aligns expectations from the start.
Demonstrating Expertise: Referencing benchmarks in client reports or proposals shows that you’re informed about industry trends. For example, using industry median ad budgets, CPCs, and conversion rates, your agency creates an informed proposal based on real data.
Showcasing Success: Comparing your clients’ ad performance to industry benchmarks demonstrates your impact. For instance, if a client’s campaigns achieve above-average ROI at or below the median spend, this highlights your agency’s strategic strength.
Building Trust Through Transparency: Sharing benchmarks alongside campaign performance data reinforces your commitment to accountability and measurable outcomes. Clients value seeing how their investment aligns with industry standards.
By weaving ad spend benchmarks into client reports and dashboards, marketing agencies strengthen their credibility, foster trust, and differentiate themselves as informed, results-driven partners.
We leverage campaign data to identify opportunities and monitor return on investment. Once we have collected enough data, we set a target Return on Ad Spend (ROAS) and adjust it accordingly. With this approach, a PPC budget is not limited as long as the target ROAS can be maintained.
Tim Husband, Co-founder, Blue Flamingo Solutions

Written by
Paul Stainton is a digital marketing leader with extensive experience creating brand value through digital transformation, eCommerce strategies, brand strategy, and go-to-market execution.
Read more posts by Paul StaintonSee how 7,000+ marketing agencies help clients win
Free 14-day trial. No credit card required.


