Salesforce Metrics: Top 12 Analytics & KPIs You Should Track


Table of Contents
7,000+ agencies have ditched manual reports. You can too.
Free 14-Day TrialQUICK SUMMARY:
Salesforce Analytics offers a robust suite for analyzing customer data, sales performance, and business trends. Key to this process are Salesforce metrics and KPIs, which provide data-rich insights into the effectiveness of sales and marketing efforts. This article focuses on the top Salesforce metrics and KPIs essential for agencies to track and report to their clients for improved business outcomes.
Salesforce has earned its reputation as an industry-leading CRM platform. It streamlines the entire lead generation process, allowing you and your clients to track progress at every stage in the pipeline.
Salesforce metrics leverage this data to provide a comprehensive view of sales performance–a vital component in driving business decisions.
While having access to all that data is definitely a good thing, it’s only beneficial if you know how to leverage it. Staring at a block of numbers isn’t the most productive way to spend your time. You need an effective way to interpret and visualize Salesforce CRM analytics to illustrate the bigger picture and provide actionable insights.
If you’re looking for a way to cut through the noise and focus on Salesforce metrics and KPIs that really matter, look no further.
What Are KPIs in Sales?
Before we begin exploring the details of Salesforce data, let’s do a little refresher on sales KPIs as well as a clear definition of a KPI.
A Key Performance Indicator (KPI) is a quantifiable measure that reflects the success of an organization in meeting its strategic goals.
For most clients, sales is a lifeline that keeps their business afloat. It’s what drives revenue, fuels agency growth, and pays the bills.
That said, there must be a strategic approach to monitoring sales or even the steps leading up to it. That’s where CRM analytics and sales key performance indicators (KPIs) come in, and it’s usually the first thing sales leaders want to see.
Generally speaking, sales key performance indicators are data-driven insights that:
Drive sound and informed decisions. For example, sales-driven KPIs may prompt a client to:
Ramp up marketing efforts to drive more revenue
Hire additional reps to handle an overflow of SQLs
Reallocate ad spend towards more profitable activities
Provide an objective measure of sales performance. This is instrumental in determining whether your client’s sales arm is contributing to revenue and overall business success
Helps clients to create clear, actionable targets. This provides sales reps with tangible goals, which can also be tied to performance incentives (e.g., a bonus or commission)
What Are Salesforce Metrics?
Salesforce is a powerhouse when it comes to customer relationship management. This cloud-based platform streamlines lead management and helps clients monitor progress throughout the sales cycle.
With so much intricacy and stages, it's important to understand what's happening on a data level, especially since sales leaders use this for decision-making.
That’s where Salesforce metrics come in–they’re data-rich insights that reflect the effectiveness of your client’s sales and marketing efforts.
Are Salesforce Metrics the Same as Sales KPIs?
Yes and no. Remember that there are key differences between a metric vs. a KPI.

A Salesforce metric is a numerical value that represents an aspect of sales and marketing performance. However, when viewed in isolation, it may lack context and doesn’t always align with your client's specific objectives.
A sales KPI is a predetermined, quantifiable measure of performance that directly ties into your client’s business goals. That means that all KPIs are metrics, but metrics aren’t always KPIs.
For instance, if your client’s sales team is tracking the number of demos presented each month without a clear link to broader business outcomes (e.g., revenue growth), it remains a sales metric. While it provides valuable information about their activity, it doesn’t directly show how they’re achieving meaningful results.
To transform this metric into a sales KPI, it must be tied to a specific business goal (like improving the conversion rate of demos into paying customers). Once this link is established, it creates actionable targets and a bridge to business success.
How To Decide on Sales KPIs
Setting sales key performance indicators ensures that everyone is on the same page and creates a targeted focus. In turn, this empowers your agency to develop tailor-made marketing strategies that achieve the desired outcomes.
Here are some practical tips to decide on the best sales KPIs.
1. Understand What Your Client Wants to Achieve
In your client’s initial discovery call or 1:1 meeting, get a sense of what they’re looking for to guide their overall sales strategy.
To get started, ask insightful questions like:
What do you want to achieve from your sales and marketing efforts (e.g., generating qualified leads, boosting revenue)?
Is there a timeline for meeting these goals?
Do your sales reps have quotas that they’re working towards?
Who is your target audience? Have you developed an ideal customer profile?
Is there a budget you’re working with? Use this to guide your agency pricing strategy and all associated costs (e.g., allocating your client’s advertising budget)
What does your current sales process look like?
2. Outline the Sales Funnel Stages
No two clients are the same, and neither are their sales funnels. Learning about the unique phases of their customer purchasing journey will inform your agency’s strategic approach to reaching those customers at every stage.
Each sales funnel stage represents a different level of engagement and intent. Some prospects may be browsing around, while others are ready to swipe their credit cards. Defining these stages will help you develop meaningful messaging and relevant performance indicators that show what’s happening at every step.
Potential customers are at different stages of the buying cycle. Customers need information to move them to the next buying cycle stage; pushing the right content can do just that. It's all about moving these prospects down your sales funnel–not as quickly as possible, but as efficiently as possible.
Bryan Lozano, Vice President of Operations at Ad-Apt
As a quick refresher, these stages of the buying cycle are:
Awareness: A prospect becomes aware of your client’s products or services (e.g., through social media advertising)
Consideration: This prospect turns into a lead by engaging with your client’s brand and showing interest in some way (e.g., signing up for a product demo)
Conversion: A lead turns into a customer by fulfilling a desired action (e.g., subscribing to a paid mobile app)
3. Determine the Role of Marketing
Next up, clarify how marketing efforts will contribute to your client’s sales goals. After all, the best results are achieved when sales and marketing teams are aligned.

To get the most from this step:
Decide whether sales and marketing have a shared goal. For example, marketing is often focused on building brand visibility. However, assigning revenue goals to marketing teams may result in conversion-driven results beyond brand awareness. In turn, this drives more ROI for your client
Define which marketing channels will be used to meet sales goals (e.g., landing pages on Google Ads, website signup forms)
Ensure that a proper attribution system is in place to assign lead conversion credit to either sales or marketing. For example, Google Analytics 4 has built-in machine learning to attribute this information automatically. Verify that GA4 is properly set up to access these valuable insights
4. Set Clear and Realistic Targets
Now that you’ve pieced the bigger picture together, it’s time to decide on key performance indicators.
You’re already well-versed with the SMART analogy for goal-setting (i.e., specific, measurable, attainable, relevant, and timely goals).
Here’s a neat alternative to consider–MASTER your client’s sales KPIs.

That means:
Creating measurable goals and setting benchmarks to compare against (e.g., setting a target for the number of sales calls per quarter based on historical performance)
Ensuring sales goals are achievable (e.g., aspiring for 100 sales calls per quarter after making 80 sales calls the previous quarter )
Setting specific sales goals that define targets and expectations (e.g., aiming for 100 sales calls per quarter instead of “As many calls as possible!”)
Letting goals transform your agency and client’s teams. Explain the significance and motivate them to hit targets (e.g., emphasizing that 100 sales calls will lead to client success and long-term revenue for your agency)
Allowing goals to evolve when needed (e.g., aiming for 150 sales calls per quarter instead of 100 following an increase in your client’s contract value)
Aligning sales KPIs with business goals so they’re relevant (e.g., deciding on 100 targeted sales calls per quarter, which should lead to a 5% conversion rate and $10K in revenue for your client)
12 Most Important Salesforce Metrics to Track
Now that you’ve established your client’s sales KPIs, it’s time to track progress with Salesforce metrics. Curious about which Salesforce metrics to keep an eye on? Let’s take a closer look.
1. Number of Campaigns Sent
Labeled as “Num Sent,” this Salesforce metric measures how much marketing correspondence was distributed to your client’s existing and potential customers across various channels (e.g., email newsletters sent, number of telemarketing calls made).
Use these insights to understand whether your client’s marketing campaigns are reaching intended audiences. If they’re not, consider:
Exploring relevant opportunities that would result in a higher lead generation rate (e.g., incorporating more in-person events for locally based clients)
Addressing any issues that prevent marketing correspondence from being sent to your client’s customers (e.g., increasing their Salesforce pricing tier to facilitate mass email sending)

See how your client’s marketing and outreach campaigns are progressing with easy-to-understand visuals. Access a range of intuitive data visualizations on AgencyAnalytics–start your free 14-day trial today.
2. Responses
This metric quantifies the number of interactions received from your client’s campaigns (e.g., filling out a website contact form or clicking on an email link).
Use this metric to:
Analyze which campaigns have the highest customer engagement
Replicate campaigns that produce a high number of responses
Understand your client’s overall brand growth and whether their messaging resonates
Great emails are a conversation. The only way to assess how what you are saying is perceived is by studying reactions. Whether someone clicks, shares, or replies, these are the "facial expressions" and "words" that tell you how well your conversation is going.
Seth Giammanco, Principal, Strategy and Technology at Minds On Design Lab
3. Leads
Leads come in during initial contact with your client’s business (e.g., signing up for an online newsletter). This top-of-the-funnel metric indicates how many leads are in the pipeline but haven’t been vetted by you or your client’s sales team.
It’s worth noting that leads aren’t built equally–each client will have different criteria for a good or qualified lead. However, keeping track of the number of incoming leads lets you know whether marketing efforts are working.
If you observe a low number of leads, consider:
Creating content with conversion-oriented messaging (e.g., “Take advantage of this limited-time offer!”) and adding more CTA buttons if necessary
Injecting more ad spend to boost online visibility
Increasing your client’s sales initiatives (e.g., presenting a higher number of demos or ramping calls made)

Keep on the pulse of your client’s lead generation activities and report exactly what’s happening. Give your clients the data they need to make informed sales decisions–it’s all possible on AgencyAnalytics; sign up for a free 14-day trial today.
4. Marketing Qualified Leads (MQLs)
MQLs are a step beyond regular leads and have been initially assessed by your marketing team.
For example, a lead may have first contacted your client’s business via social media. After they filled out a pre-screening questionnaire, your marketing team identified them as an MQL with conversion potential. At this point, they’re passed along to the sales team for further vetting.
If you observe a low number of MQLs, it may mean that:
More ad spend is needed to generate leads (e.g., outbidding competitors on Google Ads)
Demographic targeting needs refinement (especially if lead quality is also a concern)
Other marketing tactics should be explored (e.g., using keyword-driven Google search ads instead of display ads)
5. Sales Qualified Leads (SQLs)
SQLs are one step further than MQLs in the lead qualification process, having demonstrated additional conversion potential. At this point, the sales team would have conducted a more in-depth assessment of this lead (e.g., considering their purchasing power and other qualification checks).
Keep an eye on this insight and use it to:
Determine how many MQLs turn into SQLs. Keep an open communication loop to understand whether the team is bringing in high-quality leads, then use these insights to refine marketing strategies and improve the lead hand-off process
Identify and nurture the most promising leads. This helps your client’s sales team to prioritize which leads to focus on, increasing the chances of securing revenue
Improve lead response time and the overall lead qualification process. If there’s a significant lag, you’ll risk SQLs exiting the pipeline
6. New Customers
At the end of your client’s lead generation pipeline is “New Customers.” This metric represents leads that recently became customers by completing a conversion-oriented action like signing a long-term contract or completing a purchase.
Monitoring new customers is important to:
Measure your client’s success and whether they’re en route to achieving growth or conversion rate goals
See whether there’s a significant drop-off before SQLs become new customers. This will pinpoint any areas for improvement, like cutting down lead response time or reducing the average sales cycle length
Determine whether sales and marketing efforts are contributing to the bottom line
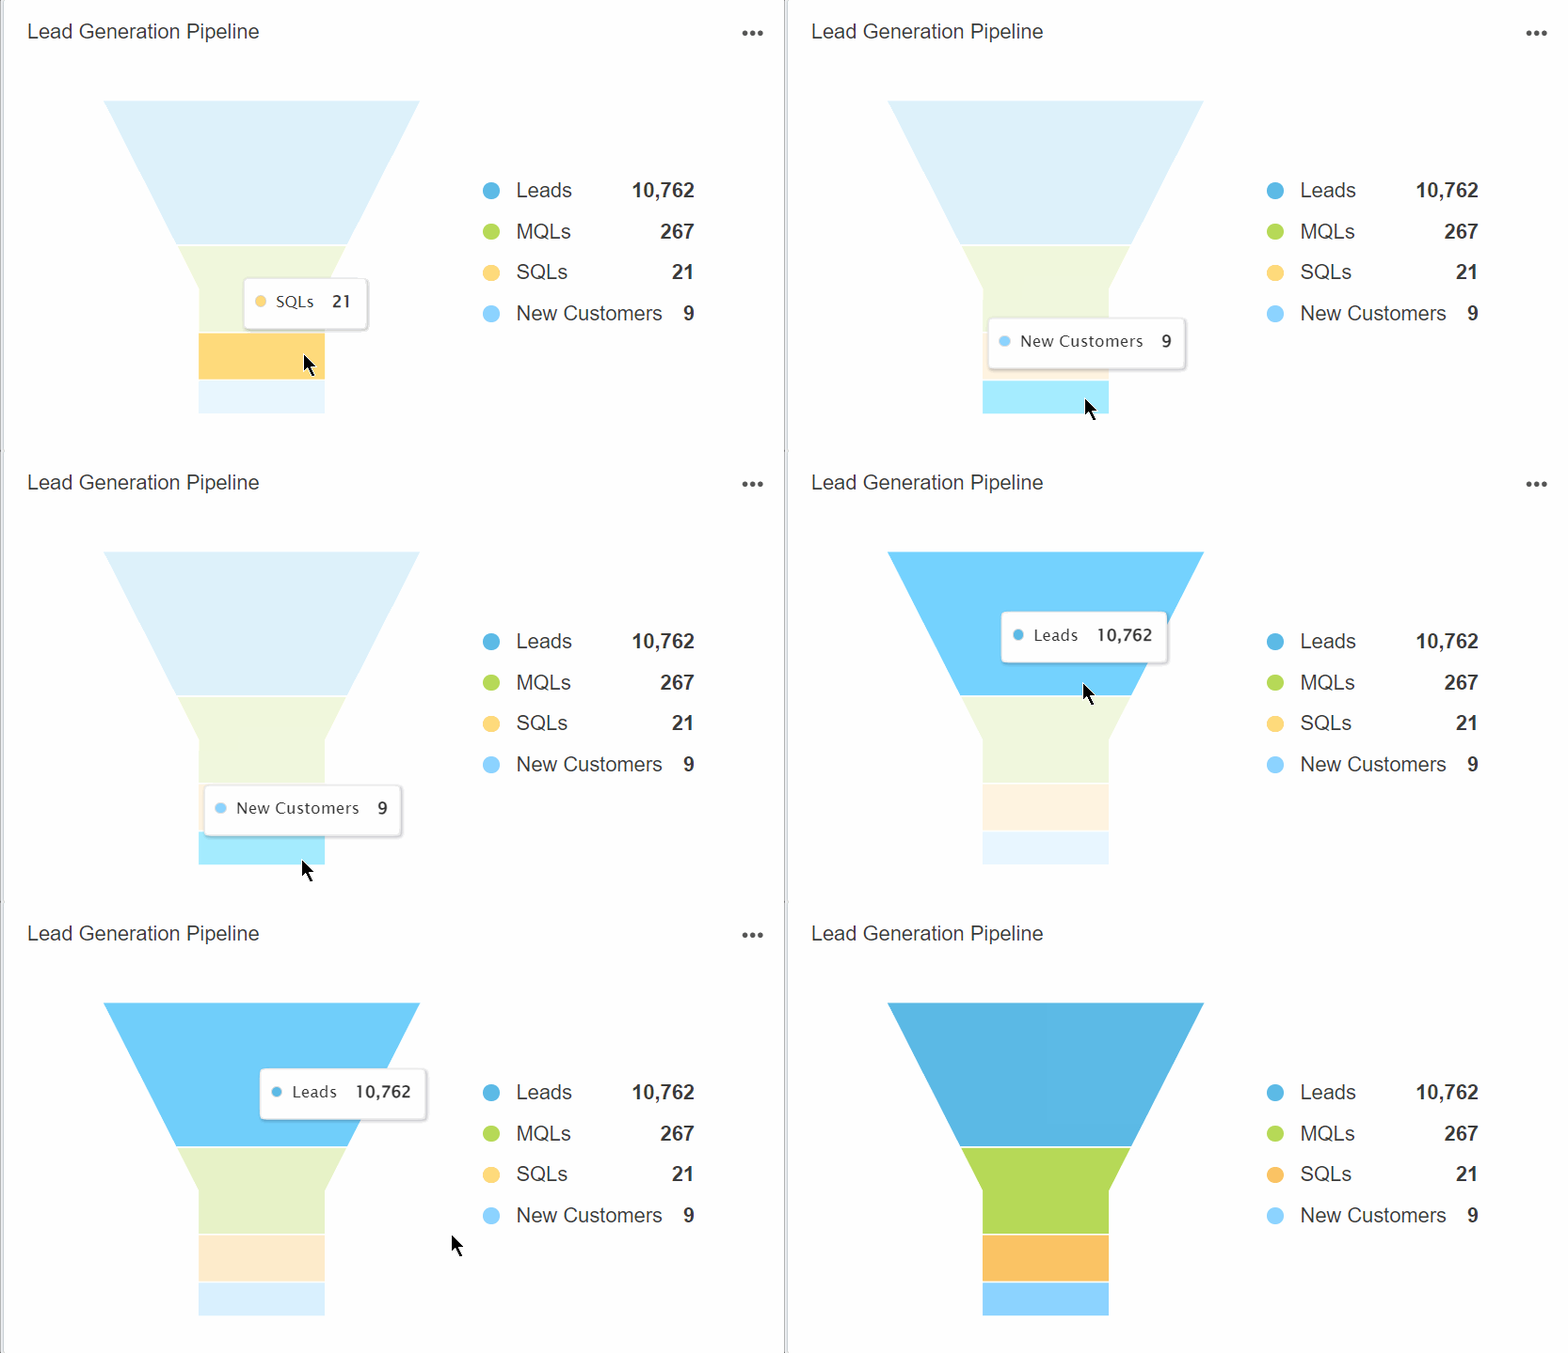
Access a visual lead generation pipeline and quickly identify any areas for improvement. Show your clients how leads are moving through the sales funnel–explore the Salesforce integration on AgencyAnalytics, free for 14 days.
7. Opportunity Win Rate
This metric represents the percentage of sales opportunities won and closed by your client’s sales team. Generally speaking, Opportunity Win Rate is helpful to:
Assess whether your client’s sales team is effective at converting leads into customers
Identify any areas for improvement in the deal-closing process (e.g., offering additional training for new sales reps, sharing strategies for improving lead response time)
Create internal benchmarks for your client’s sales team to aspire towards based on historical Opportunity Win Rate data
8. Conversion Rate
This metric is a percentage measure of how many leads have successfully converted into new customers. Essentially, conversion rate measures how well customers have moved through your client’s sales process.
A high lead conversion rate means your client’s sales team efficiently moves leads through the pipeline and closes deals. Conversely, a low lead conversion rate is a cause for further evaluation. Improve this percentage by:
Identifying where leads drop off before converting
Paying more attention to micro-conversions (e.g., leads that are requesting a sales call may benefit from more nurturing)
Running A/B tests on marketing collateral (e.g., email campaigns, landing pages) to determine what drives conversion behavior and optimize where necessary

Track conversion rate trends and see how your clients perform against historical performance benchmarks. Monitor sales performance and give data-informed recommendations–try it on AgencyAnalytics today! It’s free for 14 days.
9. Expected Revenue
This metric estimates how much revenue will be generated from successfully closing deals in your client’s pipeline. Keep an eye on Expected Revenue to:
Make forecasts and cash flow projections, which help clients plan ahead
Decide which deals sales reps should prioritize. For example, a sales rep may deprioritize unqualified leads and focus on a potential enterprise-level deal with recurring revenue potential. Plus, this average contract value may be higher than the monetary value of other deals in the pipeline
Evaluate whether there are enough potential revenue-generating opportunities. If not, it may be time to invest in more sales activities, improve existing ones, or focus on moving current leads further down the pipeline
11. Amount Won
This metric shows the total revenue your client’s sales team has generated from successfully closed deals. This helps your client to:
Forecast future revenue based on actual cash flow numbers. Over time, it’s helpful to compare to Expected Revenue to see whether their predictions have been accurate
Base sales quotas and commissions on tangible sales performance

Easily report on the number of inbound leads, the average sales cycle length, and the progress of sales activities. Streamline sales processes and measure performance in just a few clicks–it’s free for 14 days on AgencyAnalytics.
12. Amount Lost
On the other hand, “Amount Lost” refers to potential revenue that didn’t come to fruition due to an unsuccessful deal. Use this metric to:
Determine the realistic and financial impact of lost revenue. This could have a trickle-down effect on Expected Revenue and other forecasts
Analyze the reasons for lost revenue opportunities and address them where possible. For example, it may mean:
Cutting down the average sales cycle length
Improving lead response time
Removing unqualified leads earlier in the sales process
Giving more support to prospects with a higher contract value
Adjust your client’s sales strategy if necessary, especially if external factors pop up (e.g., an economic slowdown because of a recession)

Quickly reference what’s in the lead pipeline and whether your client is on track to hit their revenue goals–use the Salesforce integration on AgencyAnalytics, free for 14 days.
Salesforce plays a significant role in delivering detailed lead generation data and measuring revenue impact–there’s no doubt about it. That said, their interface is a bit complicated, making highlighting the most critical insights challenging.
Instead of spending countless hours sifting through a heap of data, there’s a more time-efficient solution–using the Salesforce integration on AgencyAnalytics.
Within a few minutes, it’s easy to parse your clients’ data and stream it into intuitive, streamlined dashboards or reports. That way, you’ll reduce tedious manual work and have more time to focus on meeting client expectations.
How to Use AgencyAnalytics to Build a Salesforce Metrics Dashboard
Setting up an AgencyAnalytics dashboard is a breeze! Here’s a step-by-step guide on how to get started and connect the Salesforce CRM analytics app to client reports and dashboards.
1. Link Your Client’s Salesforce Account to AgencyAnalytics
After signing into your AgencyAnalytics account, head to Integrations on the left-hand menu of the analytics platform. Then, click on Salesforce under the “Analytics” category or “All Collections.” Once connected, you instantly enable CRM analytics to be populated into client dashboards and reports.

2. Select a Dashboard Template
After successfully linking your client’s Salesforce account to AgencyAnalytics, go to “Templates” (also on the left-hand menu).
Head to the “Sections” tab, then click “Create Template”.

You’ll then have the option to:
Start from a template for your agency's CRM analytics (in this case, choosing a pre-built Salesforce dashboard template)
Clone an existing section (i.e., replicating one of your existing dashboards) or
Create a custom dashboard (if you prefer to build your own).

3. Customize the Dashboard as Needed
After selecting a dashboard, it’s time to have fun with it! With AgencyAnalytics, it’s easy to customize as needed. You may want to:
Add annotations directly to your client’s dashboard (e.g., explaining why there was a sudden increase in a sales KPI for a particular month)
Create custom metrics for enhanced CRM analytics and data reporting. For example, you may want to calculate:
Lead to opportunity ratio
Opportunity to win ratio
Total number of inbound leads across different marketing campaigns
Toggle with different data visualizations to bring your client’s Salesforce KPIs and metrics to life
Grant 24/7 client login access to dashboards for greater transparency, combining Salesforce CRM analytics with all your data from client marketing campaigns.
Pull in external data using the Google Sheets integration to complement client reports and dashboards or export data using the Google Sheets app for in-depth analysis.
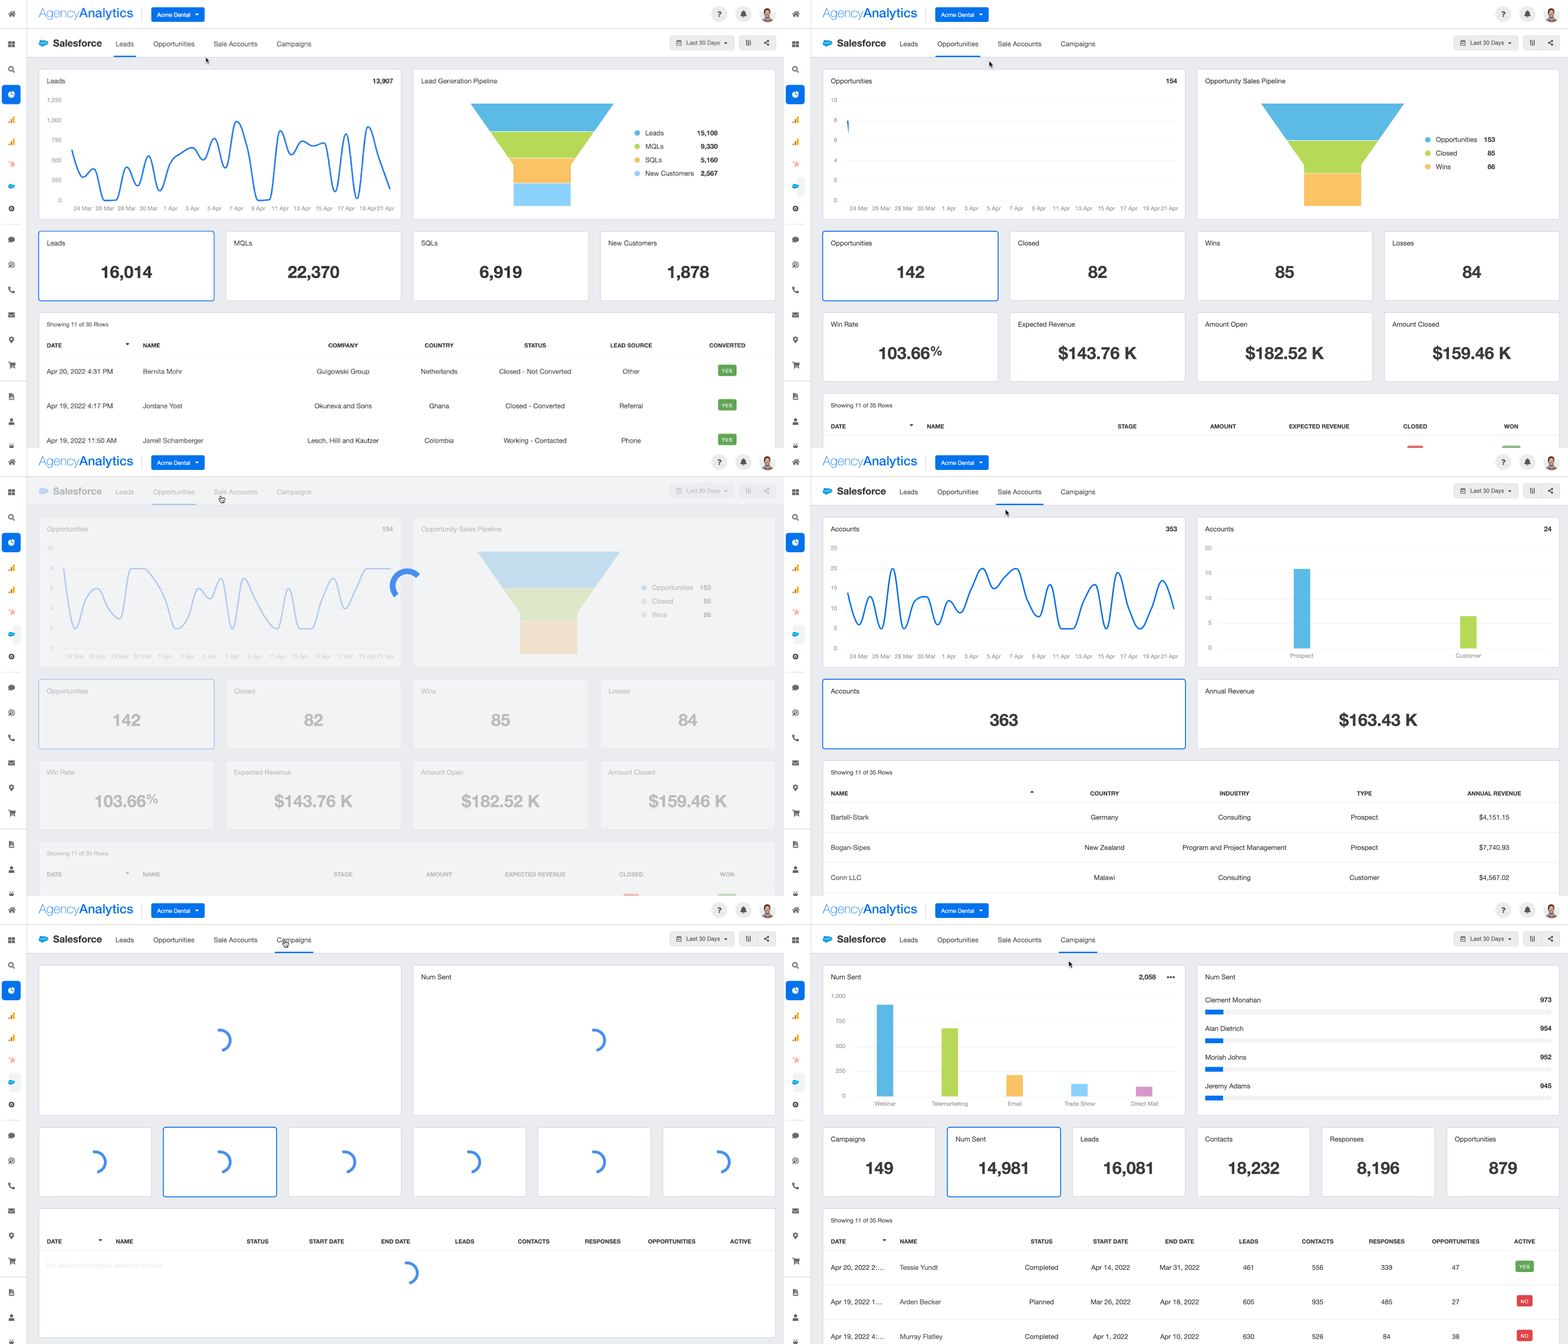
Streamline Salesforce Reporting and Present Intuitive Insights
No more getting lost in a Salesforce customer data vortex.
Investing in AgencyAnalytics means having access to white-labeled dashboard and report templates, which saves you from recreating the wheel each time. To sum it up, use the AgencyAnalytics Salesforce integration to:
Visualize the number of leads you’re driving to a client’s business, including where that lead currently is in the pipeline
Track sales opportunities and key sales metrics (like conversion rate, revenue, and number of inbound leads)
Analyze client accounts at a macro level and identify their top-performing campaigns
Combine Salesforce metrics with data from other marketing channels, including Google Analytics, Facebook, and over 85 integrations
Use AgencyAnalytics to automate data retrieval, present visual dashboards, and send client reports like clockwork with a professional Salesforce report template. Maximize billable hours and easily create an efficient reporting process–sign up for a free 14-day trial today.
Faryal Khan is a multidisciplinary creative with 10+ years of experience in marketing and communications. Drawing on her background in statistics and psychology, she fuses storytelling with data to craft narratives that both inform and inspire.
Read more posts by Faryal KhanWhat other agency experts are reading

Mapping your Sales & Marketing Funnel in HubSpot: Lifecycle Stages, Lead Statuses, and Deal Stages
In this guide, we’ll discuss mapping your sales and marketing funnel in HubSport—including lifecycle stages, lead statuses, and deal stages.

The Complete Guide to Impactful Lead Generation Reports
Learn how to use lead generation reports to demonstrate campaign success to clients. Plus, access customizable report templates and best practices.

Reactivating Cancelled Agency Clients with Win-Back Emails
Discover actionable best practices for sending win-back emails that get replies and help your agency recover lost revenue.