Table of Contents
The era of Universal Analytics (UA) is coming to an end, and soon, it will be replaced entirely by Google Analytics 4. Right now, we’re in that awkward transition phase where Google is supporting both analytics platforms. However, there’s been a big push for agencies and marketers to adopt GA4 sooner rather than later.
To help ease this mandatory transition from Universal Analytics to Google Analytics 4, we’re taking a look at their similarities and differences to give you the lowdown on everything you need to know.
So let’s dive into what’s new, what’s changed, and what’s staying the same with Google Analytics 4.
UA vs. GA4: What You Need to Know
The transition from UA to GA4 reporting is inevitable. As the July 1 deadline quickly approaches, there are no other options (besides switching to a different, non-Google analytics tool). But many agencies prefer to stick with Google Analytics, which is one of the most popular analytics tools out there with almost one-third of the total market share.
Here is a brief rundown of the background and timeline of UA and GA4, along with important dates to keep in mind regarding the transition.
UA: The End is Coming July 1st
The official sunset date for standard Universal Analytics properties is July 1, 2023. Meanwhile, the end of UA 360 is scheduled for July 1, 2024 (in order to give enterprise customers more time to prepare for the inevitable transition).
From those dates on, you will no longer be able to use, collect, or process new data for your clients in Universal Analytics. And while you won’t immediately be cut off from your data in Universal Analytics (Google is planning a six-month grace period in which you can still access it), we strongly recommend that agencies export their important historical reports before the July 1 cut-off or, at the very least, during the six-month grace period before you risk losing that data forever.
Is GA4 Still Free?
Yes, but it depends on what version you’re using. The standard version of Google Analytics 4 is free (much like Universal Analytics), but there’s also a premium, enterprise version called GA4 360 that you have to pay for.
Unlike UA, which was a fixed-fee product (unless you went over your data collection limits), GA4 360 has a minimum base fee of $50,000 USD with variable pricing depending on usage, which means medium-sized businesses and larger should expect GA4 360 to come with a price tag of $150,000 or more.
Is There Any Chance the Mandatory Migration to Google Analytics 4 Won’t Happen?
At this point, it seems unlikely that the mandatory migration to Google Analytics 4 will not happen, but you never know for sure. Just looking at some of the platforms and programs that have been killed by Google over the last few years, it's easy to see that nothing in the Google world is guaranteed.
If they don’t kill it outright, there is a possibility that the mandatory migration deadline could be delayed further. But it's best to plan ahead and begin transitioning your analytics setup as soon as possible so you don't get caught off guard by any unexpected changes down the line.
Google has already announced plans to end support for Universal Analytics and strongly encourages users to transition before the deadline. That, combined with the powerful new features such as improved cross-platform reporting, a unified data model, and AI-driven insights, it's hard to imagine why they would shelve it.
Is Google Analytics 4 Better than Universal Analytics?
In many ways, GA4 is better than Universal Analytics. Not only is GA4 infinitely more customizable than UA, but it also adapts Analytics to this modern era dominated by mobile traffic and apps.
So let’s take a look at some of the major benefits you can expect from GA4 once you make the transition.
1. GA4: Better User Tracking Across Devices and Apps
When Universal Analytics launched in 2012, desktops accounted for over 89% of all web traffic (while mobile traffic made up a mere 10%). Fast forward a decade later to 2022, and desktop traffic has dropped to 40%, while mobile traffic has skyrocketed to almost 60%!
The shift towards mobile has made user journeys much more complicated as marketers have to track customers across different devices, websites, and apps. Since UA was made for a time when desktop traffic was still king, many of its metrics were specific to a device or platform. Google considers UA obsolete because this approach now leads to fragmented user journeys that are very challenging to track and map out accurately.
GA4 makes it easier to track users across multiple devices and apps by focusing on users and their interactions (which are called ‘events’ in GA4), which has the added benefit of allowing greater accuracy in mapping user journeys. Not only does GA4 aggregate web, app, and device data in one place, but it also allows you to apply the same set of metrics and dimensions across your GA4 properties.
2. GA4: Optimized for First-party Data
Much has been said about the importance of first-party data, especially with the imminent death of third-party cookies (aka ‘third-party cookie deprecation’).
In fact, third-party cookies are already in the process of getting phased out, although Google’s original 2023 deadline to kill third-party cookies in Chrome was recently extended to 2024 (which is kind of similar to how Google gave UA an extension, which might make you wonder if it’s all part of Google’s strategy to announce a deadline and then give us an extension to act as the sugar that helps the medicine go down easier).
Now that third-party data and cookies are being phased out, one way that GA4 takes advantage of first-party data is through server-side tracking as an alternative way to process data through a direct connection between GA4’s servers and the servers of your client’s website. So if someone clicks something on your client’s website, GA4 immediately records it as an event.
This helps GA4 to continue collecting and tracking data despite third-party cookie deprecation and tracking blockers on your browser or iOS. Even better, Google Analytics 4 is basically future-proofed (at least for the time being), as GA4 doesn’t need cookies while UA absolutely does.
3. Pick and Choose Your Audiences
Audiences in GA4 make it easier than ever to create, customize, and segment your audiences depending on the needs of your business. You can categorize your audiences based on dimensions, metrics, and events to include basically any subset of users that you want.
This makes it easier than ever to not only analyze user behavior but also allows agencies to control precisely who sees what ads.
For more information on using Audiences in GA4, check out our article: "A Guide to Configuring GA4 Audiences".
Why and How Does Google Analytics 4 Measure Differently?
In this section, we’re going to look at three main areas where GA4 does things differently:
Measurement Model
Event Tracking
Reporting Interface
1. Measurement Model
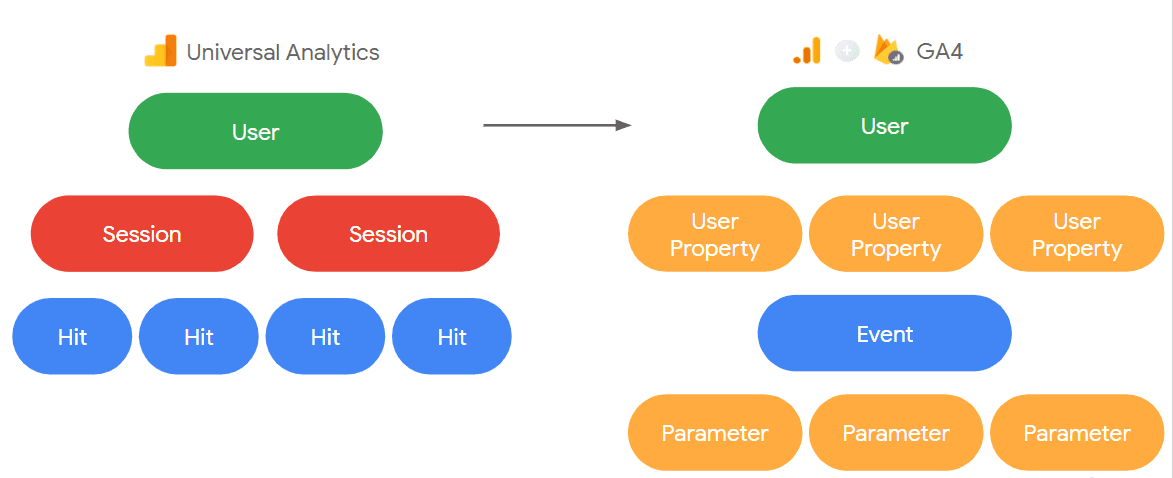
While Universal Analytics was session-based and focused on ‘hits’ (ie. page hits, event hits, ecommerce hits, and social interaction hits), GA4 places a greater emphasis on engagement and customization by being event-based while letting you set the parameters.
Events in GA4 can include everything from watching a video, signing up for a newsletter, clicking a link, viewing a page, and so much more.
2. Event Tracking
While GA4 comes with a number of automatically collected events (such as ad clicks, ad impressions, app removal, and video starts) and recommended events, the most interesting event type is custom events. Custom events are events you define based on your client’s needs, where any interaction can be considered an event if you want it to be.
The table below provides examples of how UA’s hit types are translated into events in GA4:
In a Universal Analytics property, a hit type ... | is captured in a Google Analytics 4 property as an ... |
|---|---|
Event | |
Event | Event |
Social | Event |
Transaction/e-commerce | Event |
User timing | Event |
Exception | Event |
App/screen view | Event |
3. Reporting Interface
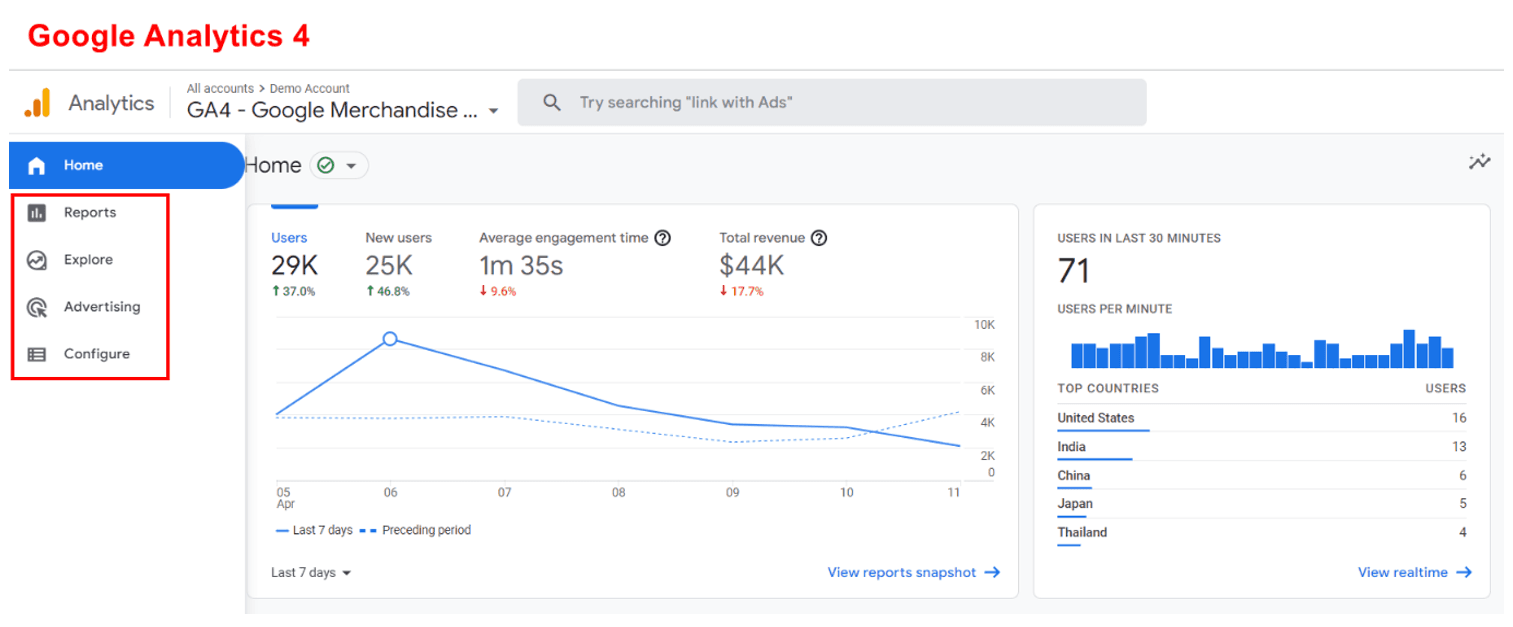
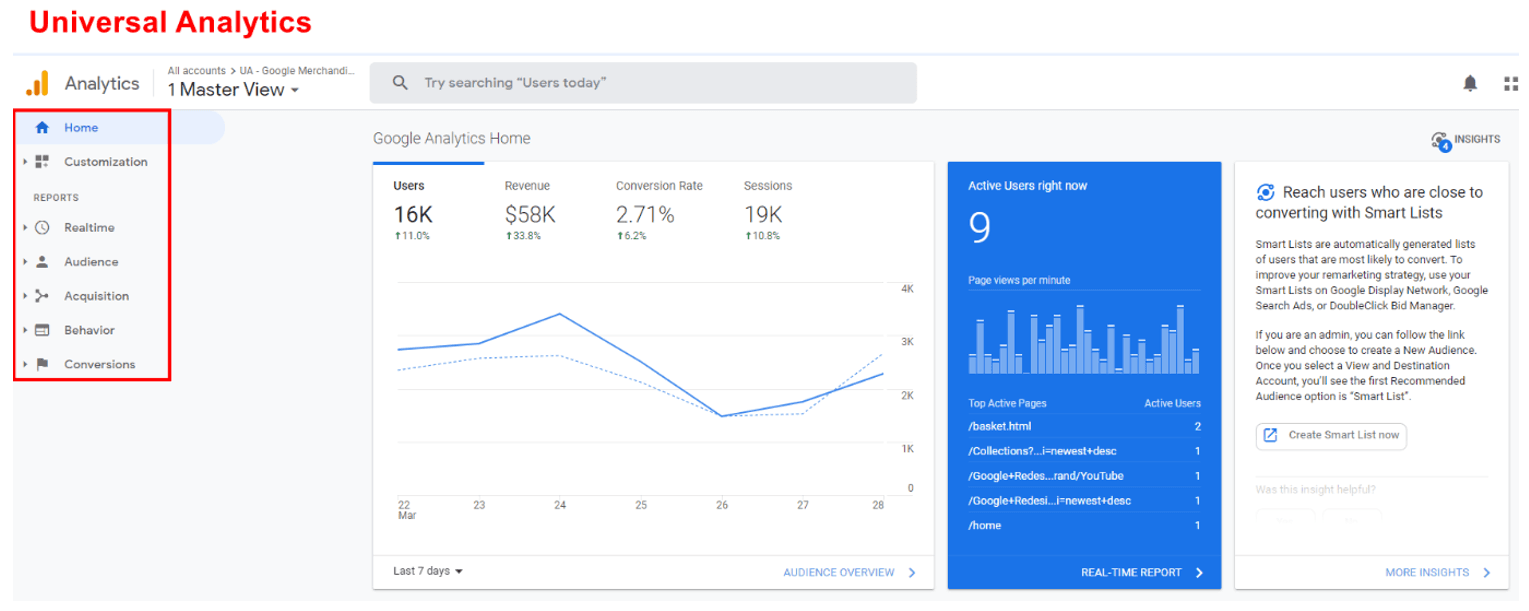
And lastly, of course, switching to GA4 will be a bit of a learning process, as the reporting interface is different.
Here's what it looks like in GA4:
Versus what you're used to in Universal Analytics:
Metrics in Google Analytics 4 vs. Universal Analytics
There are some major differences between GA4 and UA when it comes to the data and metrics. Some metrics, like bounce rate, have had their definitions changed entirely in GA4, while other metrics might only see slight differences between the two analytics platforms.
How To Explain Data Discrepancies Between Universal Analytics and GA4 to Clients
In this section, we’ll take a look at a few of the biggest changes to the metrics in GA4 and go over how you can explain these changes to your clients if they ask what happened to the metrics and numbers they’re used to.
Users
Universal Analytics has 2 user metrics:
Total users
New Users
Meanwhile, GA4 has both of those metrics plus a third one called Active users, which includes the number of users who had an engaged session, first website visit, or first open. This is divided into 3 sub-categories, including Daily Active Users (DAU), Weekly Active Users (WAU), and Monthly Active Users (MAU).
For a side-by-side comparison of users in UA vs. GA4, please see the table from Google below:
Metric | UA | GA4 |
|---|---|---|
Total Users | Primary user metric in UA: Total number of users | Total number of unique users who logged an event |
New Users | Number of users who interacted with your site for the first time | Number of users who interacted with your site or launched your app for the first time The metric is measured by the number of new unique user IDs that logged the first_open or first_visit event. |
N/A | Primary user metric in GA4: Number of distinct users who visited your website or application. An active user is any user who has an engaged session or when Analytics collects: - the first_visit event or engagement_time_msec parameter from a website - the first_open event or engagement_time_msec parameter from an Android app - the first_open or user_engagement event from an iOS app |
The discrepancies in data when it comes to users arise from the differences in the primary metrics in UA and GA4. When reporting, both UA and GA4 refer to ‘users’, but they’re referring to different metrics– UA refers to total users while GA4 refers to active users.
Pageviews
Discrepancies in data when it comes to pageviews are due to the fact that GA4 combines both pageviews and app screen views, while UA only counts pageviews, and app screen views are tracked separately in mobile-specific properties.
This issue is related to how GA4 has the ability to track and monitor users across different devices and platforms while UA does not.
Purchases
Since purchases are such an important metric. The purchase counts shouldn’t differ too dramatically between UA and GA4. If you are noticing some drastic differences, it could be related to the inconsistent application of the transaction_id parameter.
Also, you should make sure you’ve set up your eCommerce events properly, and you’re collecting the right info.
Another thing to keep in mind is that the differences in your recent purchases could be explained by the fact that GA4 hasn’t finished processing the data yet because it can sometimes take up to a week for GA4 to fully process and update the data.
Sessions
The are a number of reasons why your session metric could be different between UA and GA4. While it depends on the business, here are a few of the most common factors, according to Google:
Geography and time zone (the time zone is especially important if your clients are global because sessions in UA automatically end at midnight)
Use of UTMs
Filters
Estimations
Conversions
UA is focused on goals, of which there are five types:
Destination,
Duration,
Page/session,
Smart goals, and
Event goals.
On the other hand, GA4 doesn’t use goals at all. Instead, GA4 is event-based, and this extends to conversions as well (i.e. conversion events).
While GA4 lets you define your own conversion events, you can’t always directly translate UA goals, such as smart goals or duration goals, into GA4. Another reason why your conversions aren’t matching up between UA and GA4 is that “UA counts only one conversion per session”, while “GA4 counts every instance of the conversion event, even if the same conversion event is recorded multiple times,” according to Google.
Bounce Rate
In this new era of single-page applications, the old way of measuring bounce rate in UA is obsolete, and GA4’s emphasis on engaged sessions means that only sessions that are 10 seconds or less have zero conversion events or under two page or screen views are counted towards the bounce rate:
Universal Analytics | Google Analytics 4 |
|---|---|
The % of single-page sessions where there was no interaction with the page. The bounced session has a duration of 0 seconds. Ex. A visitor scrolls around the homepage for 2 minutes but leaves without clicking on any links or triggering any events. | The % of sessions that were not engaged*. Ex. A visitor stays on a website for >10 seconds and leaves without clicking on any links or triggering any events. |
*An engaged session lasts 10+ seconds, has >1 conversion event, or has 2+ page/screen views.
Google Analytics 4 has a greater focus on user engagement, and it even redefined the definition of bounce rate to more accurately track and measure engagement than Universal Analytics ever did.
It’s a long story, but GA4 initially killed off the bounce rate when it first launched, only to bring it back later after a public outcry. For a more in-depth look at what happened, check out our article “How to Track Bounce Rate in Google Analytics 4 (GA4)”.
The gist of it is that bounce rate is defined in GA4 as the “percentage of sessions that were not engaged sessions”, whereas, in UA, bounce rate was defined as the “percentage of single-page sessions in which there was no interaction with the page”.
Client Reporting in Google Analytics 4
While UA won’t stop collecting new data until July 2023, the sooner you set up your client’s GA4 properties, the better. The driving reason behind this is that you can’t backfill a new GA4 property with historical data because GA4 only begins collecting data from the date it is launched.
So if you wait until the last minute to switch your clients over from UA to GA4, you won’t have any data for your client reports for some time, as it can take a week or more for GA4 to collect, process, and update the data. To avoid this issue, we strongly recommend setting up GA4 and running it in tandem with UA so you can still do your year-over-year comparisons.
Once your client’s GA4 properties are up and running, you can effortlessly create beautiful GA4 client reports with AgencyAnalytics’ automated Google Analytics reporting tool and our web analytics report template, which take the pain out of reporting.
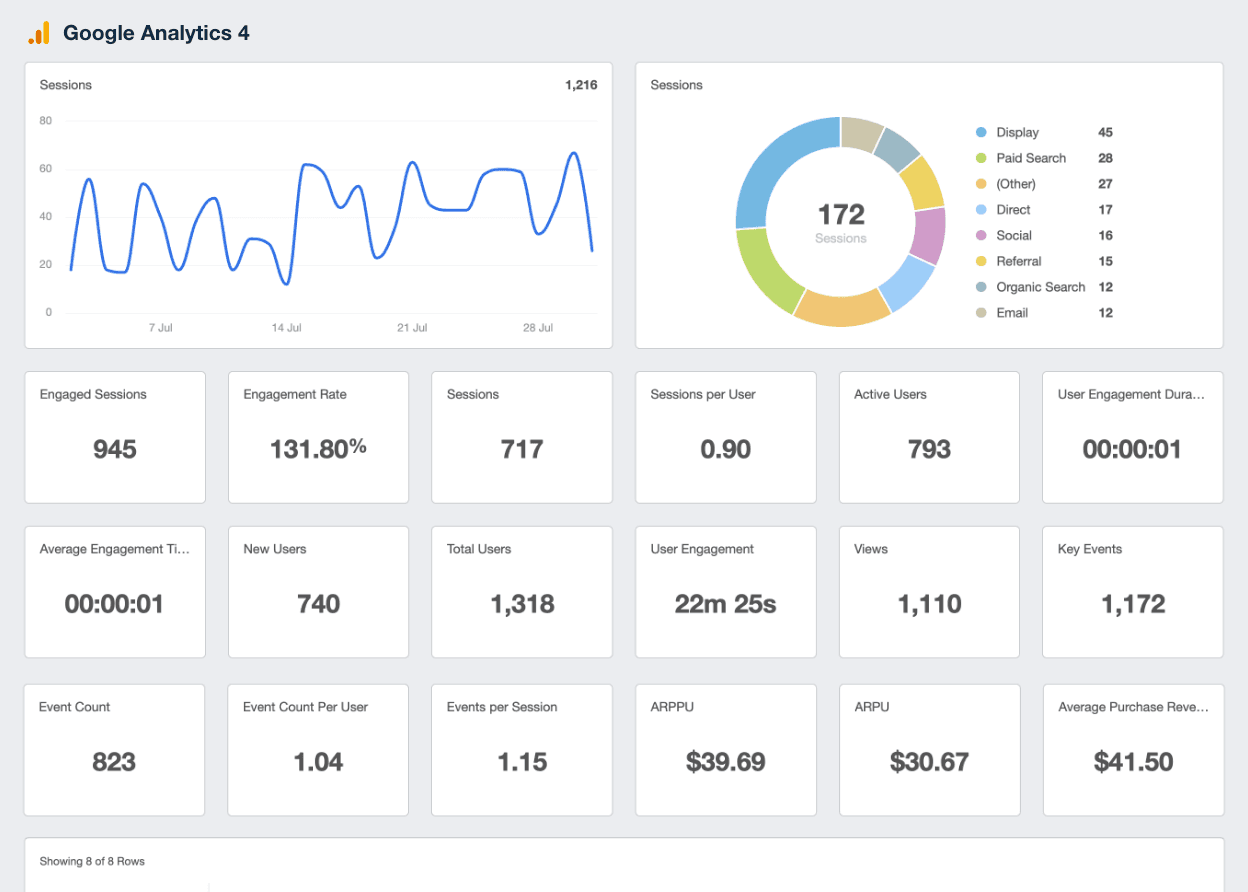
Paired with our white-label web analytics dashboard, you’ll be generating performance reports in no time with critical insights and powerful data visualization options to bring data-driven storytelling to your clients. Start your free 14-day trial today.
Impress clients and save hours with custom, automated reporting.
Join 7,000+ agencies that create reports in minutes instead of hours using AgencyAnalytics. Get started for free. No credit card required.

Written by
Michael is a Vancouver-based writer with over a decades’ experience in digital marketing. He specializes in distilling complex topics into relatable and engaging content.
Read more posts by Michael OkadaSee how 7,000+ marketing agencies help clients win
Free 14-day trial. No credit card required.


