Table of Contents
Table of Contents
- Why clients don’t read reports (And why it’s not their fault)
- Shift the goal—From reporting activity to communicating impact
- Report structure & design: Make it easy to understand at a glance
- Communication style: Write like a human, not a data bot
- Collaboration & presentation: Don’t just send it. Show it.
- Education & trust-building: Help clients feel smart and supported
- Client reports aren’t proof of work—they’re proof of value
- BONUS: The “Is your client report readable?” checklist
7,000+ agencies have ditched manual reports. You can too.
Free 14-Day TrialQUICK SUMMARY:
Agency client reporting is only effective when reports are actually read and understood. Even the most detailed insights go to waste if they’re ignored. This guide shares simple, real-world tactics to improve client engagement with reports—so the work behind them drives action instead of getting skipped.
You’ve spent hours building the perfect client report. The numbers are there. The insights are solid. You’re proud of the work your team has delivered.
But when it’s time to review the report with your client, you’re met with a quick skim, a few nods, and maybe—just maybe—a question about the bounce rate.
Sound familiar? You’re not alone.
Most of our clients don't read the reports. For them, we like to provide them with insights and actionable recommendations about the data they're not going to read.
Ruben Roel, President, Investigator Marketing
On the surface, it looks like a reporting problem. In reality, it’s a communication gap.
For many marketing agencies, client reporting is one of the job's most time-consuming yet underutilized tasks. And the truth is, even the most beautifully designed report doesn’t mean much if your client isn’t reading it—or worse, doesn’t understand it.
The good news? There are small but powerful changes to get your reports opened, read, and acted on.
This guide shares practical tips to turn your reports into something your clients will look forward to. Whether you're trying to get more engagement during monthly calls or help clients see the value of your work without needing a degree in analytics, these tips are designed to work in the real world—where time is short, expectations are high, and clarity is everything.
Why clients don’t read reports (And why it’s not their fault)
Let’s start with the uncomfortable truth: your clients don’t always read your marketing reports.
Not because they don’t care. Not because they don’t value your work. But because most reports weren’t designed with them in mind.
Marketers are deeply familiar with the data. You understand the nuance between impressions, reach, and CTR. You know what “quality score” means and why it matters. But your clients? They’re juggling sales calls, staffing issues, customer service challenges—and they’re looking for answers, not data dumps.
Here’s what often happens:
Reports are packed with data but light on interpretation.
Key metrics are buried between platform screenshots and spreadsheets.
Every tool gets equal airtime—regardless of how much it matters to the client’s goals.
The result? Clients tune out. And the agency’s hard work gets overlooked.
Clients want to see real-time data and analytics, but they don't understand metrics or look at metrics the same way we do... A conversion to them is money in the bank.
Ruben Roel, President, Investigator Marketing
That gap between what we show and what they want to see is exactly where client engagement breaks down, and it’s a missed opportunity.
Without transparent reporting, clients struggle to see the value you’re delivering. That can lead to unnecessary questions, misaligned expectations, and—eventually—churn. The exact opposite of what you want your reporting system to achieve.
With clear, consistent reporting, we’re able to show the results of our efforts and back up the work we’re doing in a way that builds trust. Clients feel more confident, more informed, and ultimately, they stick around longer.
Sarah Achler, Founder, Burnt Waffle Marketing
So, if clients aren’t reading reports, it’s not a reflection of their interest—it’s a signal to shift how we communicate. The goal of a report isn’t to detail the raw metrics; it’s to connect, clarify, and build trust.
And that starts by changing the way we think about what a great report really does.
Shift the goal—From reporting activity to communicating impact
Most client reports focus on what happened. Traffic was up. Bounce rate was down. Ad spend hit its limit. But what clients really want to know is:
Did it work? Are we on track? What should we do next?
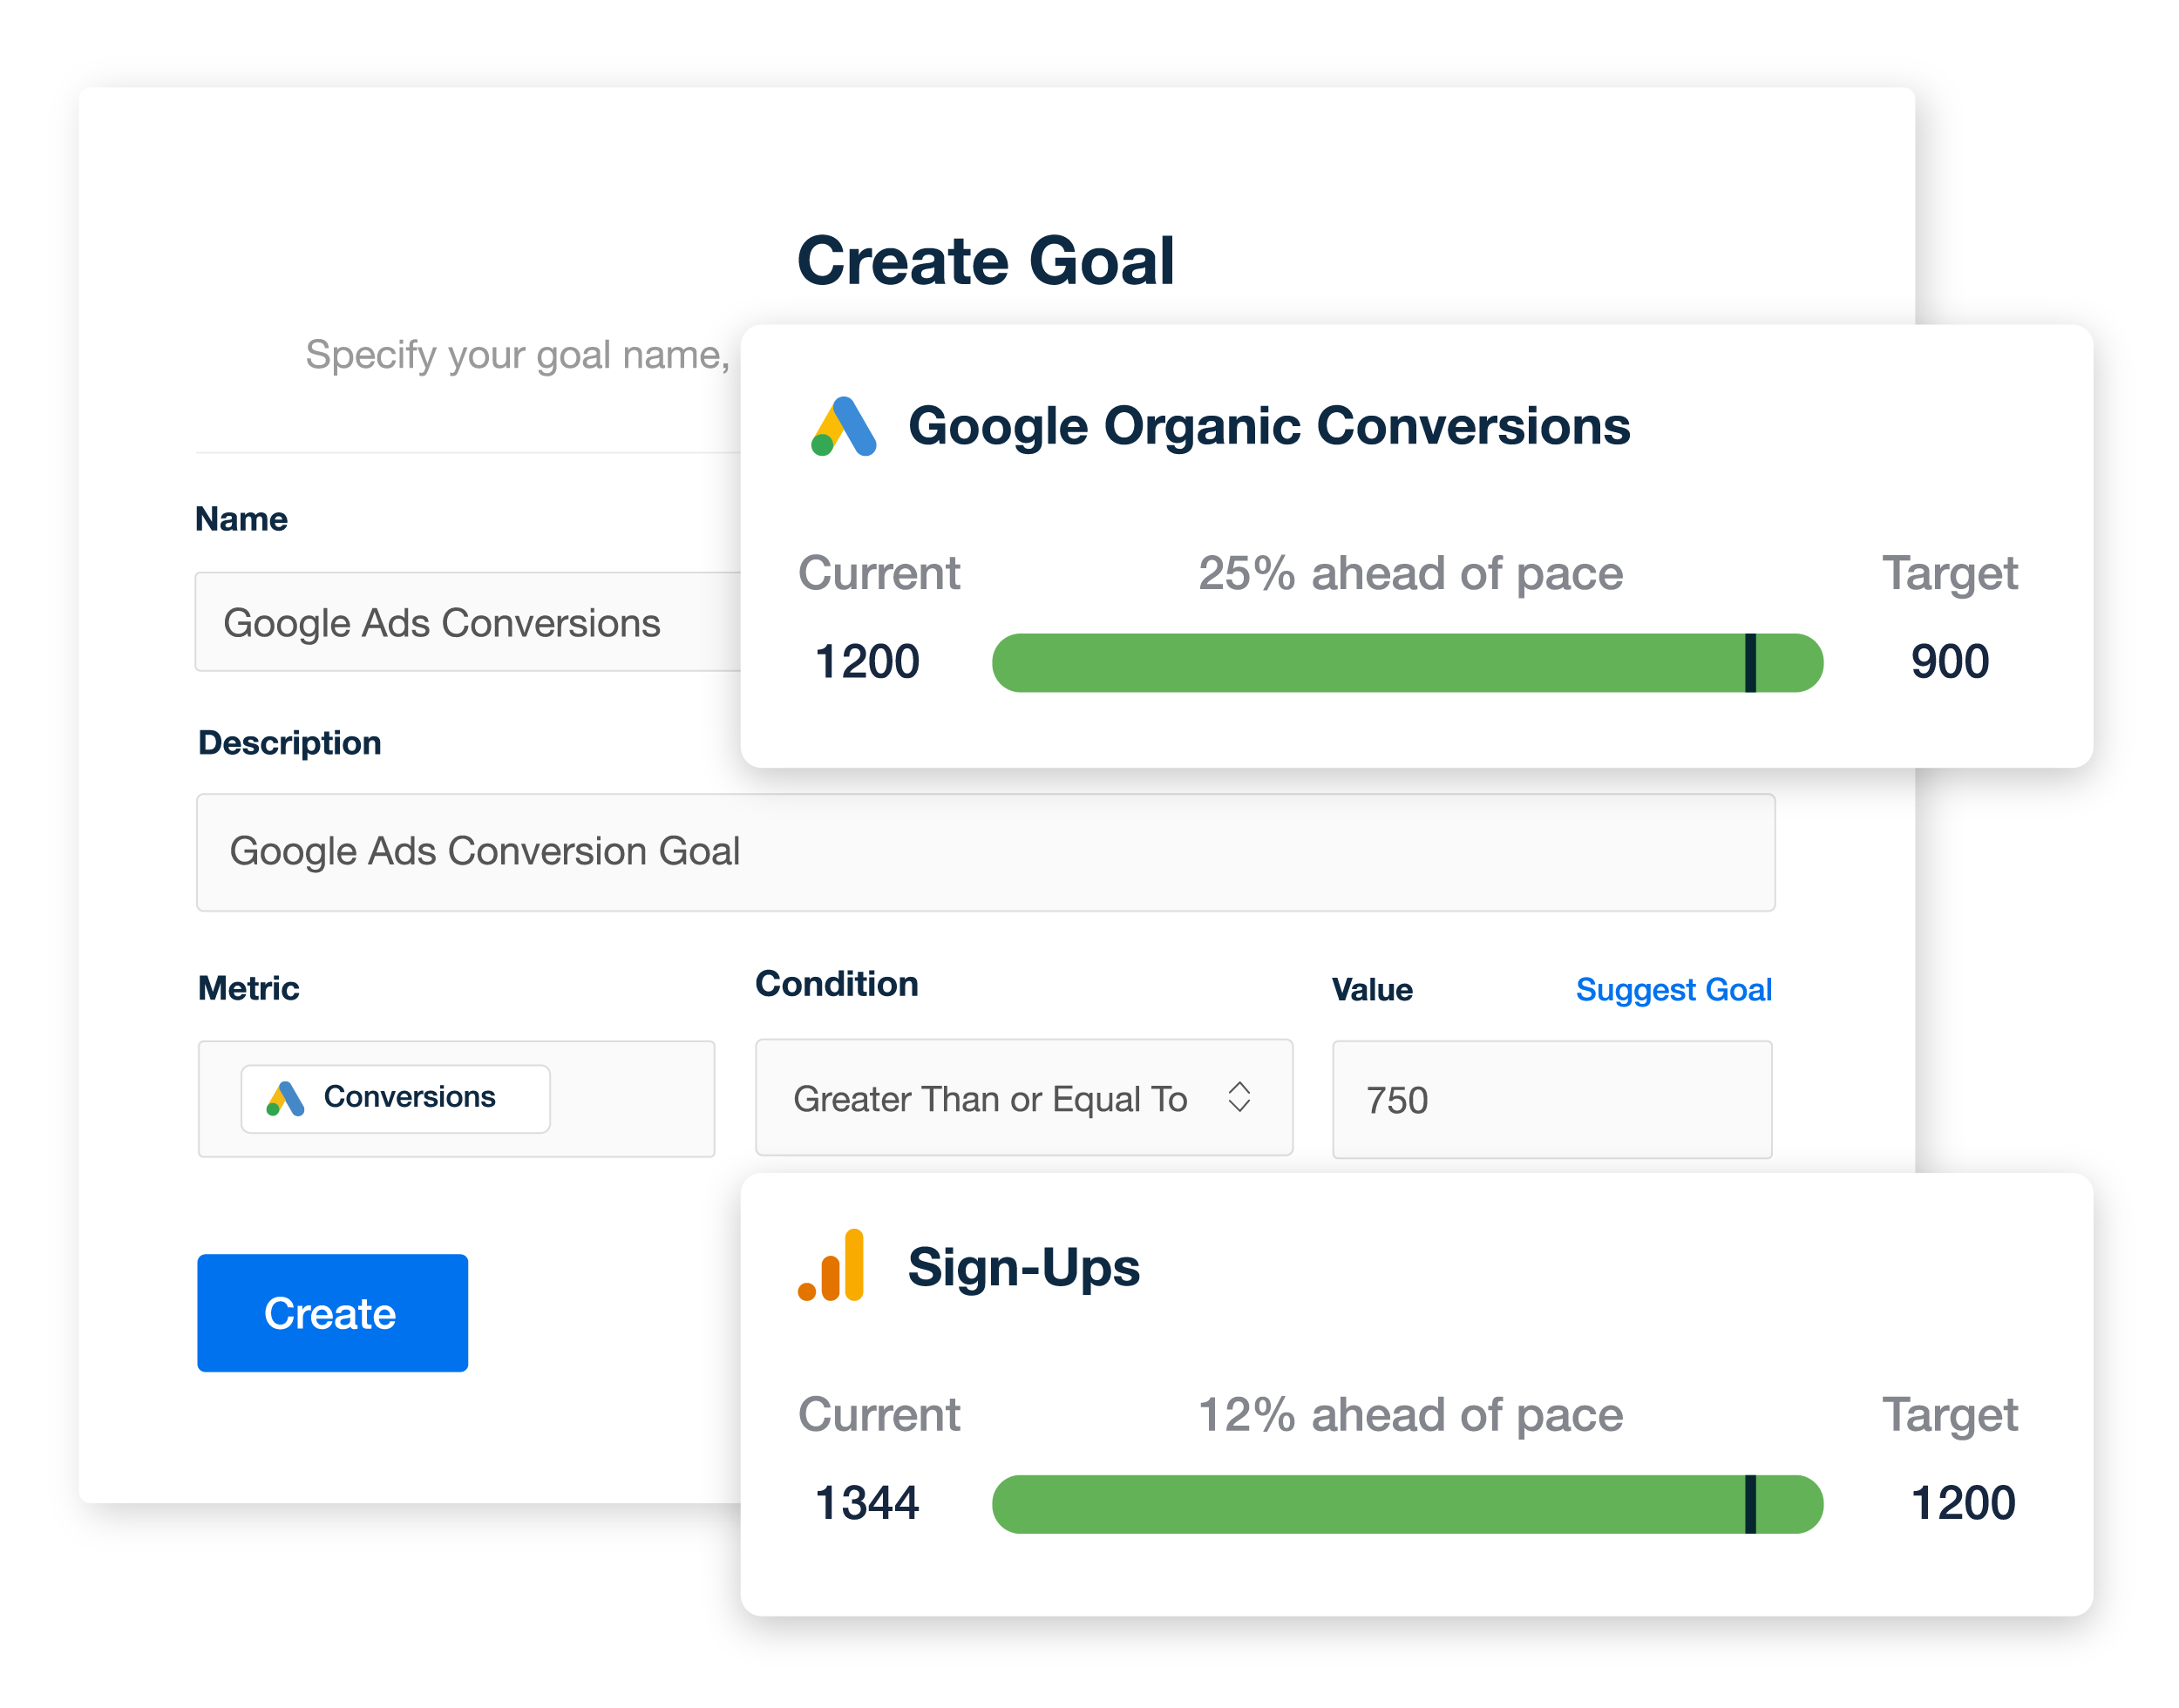
Set custom goals inside AgencyAnalytics and make it easy for clients to understand how campaigns are trending against targets. Try AgencyAnalytics free for 14 days!
Reporting activity is easy. Communicating impact is harder, but it also builds lasting client relationships.
Insights add significant value by offering clients a roadmap on how to read the data. We want to avoid giving our clients a data dump... actionable insights explain the ‘so what,’ and our recommendations explain the ‘now what.’
Ruben Roel, President, Investigator Marketing
The goal isn’t to show everything. It’s to show what matters—and why it matters to the client’s business goals.
Instead of asking, “What data should we include in this report?” Start by asking, “What does the client need to see to feel confident in our work and make informed decisions?”
When we're onboarding a client, we ask what their KPIs are, then we ask them to help us connect their accounts to our system. We show them what we're going to track, how we're going to track it, and what they can expect.
Ruben Roel, President. Investigator Marketing
When reports speak the client’s language and connect directly to their outcomes — leads, sales, revenue—they stop being a technical exercise and become a strategic tool.
This is especially important when managing campaigns across multiple platforms. Clients don’t want to be buried in seven different dashboards—they want clarity.
They want everything condensed into one, easy-to-read report, where they can view all of their most significant marketing data in one place. The clients love them, and we do too.
Graham Lumley, Director of Growth Marketing, Blackhawk
The best-performing agencies don’t just deliver raw numbers; they translate results into real business impact.
That’s the kind of reporting clients pay attention to.
Report structure & design: Make it easy to understand at a glance
The fastest way to lose a client’s attention is to give them a report that feels like work.
It creates friction if your report layout is dense, cluttered, or filled with unexplained metrics. And busy clients don’t have the time (or patience) to decode it.
The solution? Structure your reports like you would a good story—one with a clear beginning, middle, and end. It should guide the client through the performance data, highlight what matters most, and leave them with a sense of clarity.
Here are a few report structure and design tips to get clients engaged from the first scroll:
1. Start with a visual summary
Open with an executive summary or visual snapshot. This might include top-line metrics, key wins, and short commentary on what worked (and what didn’t).
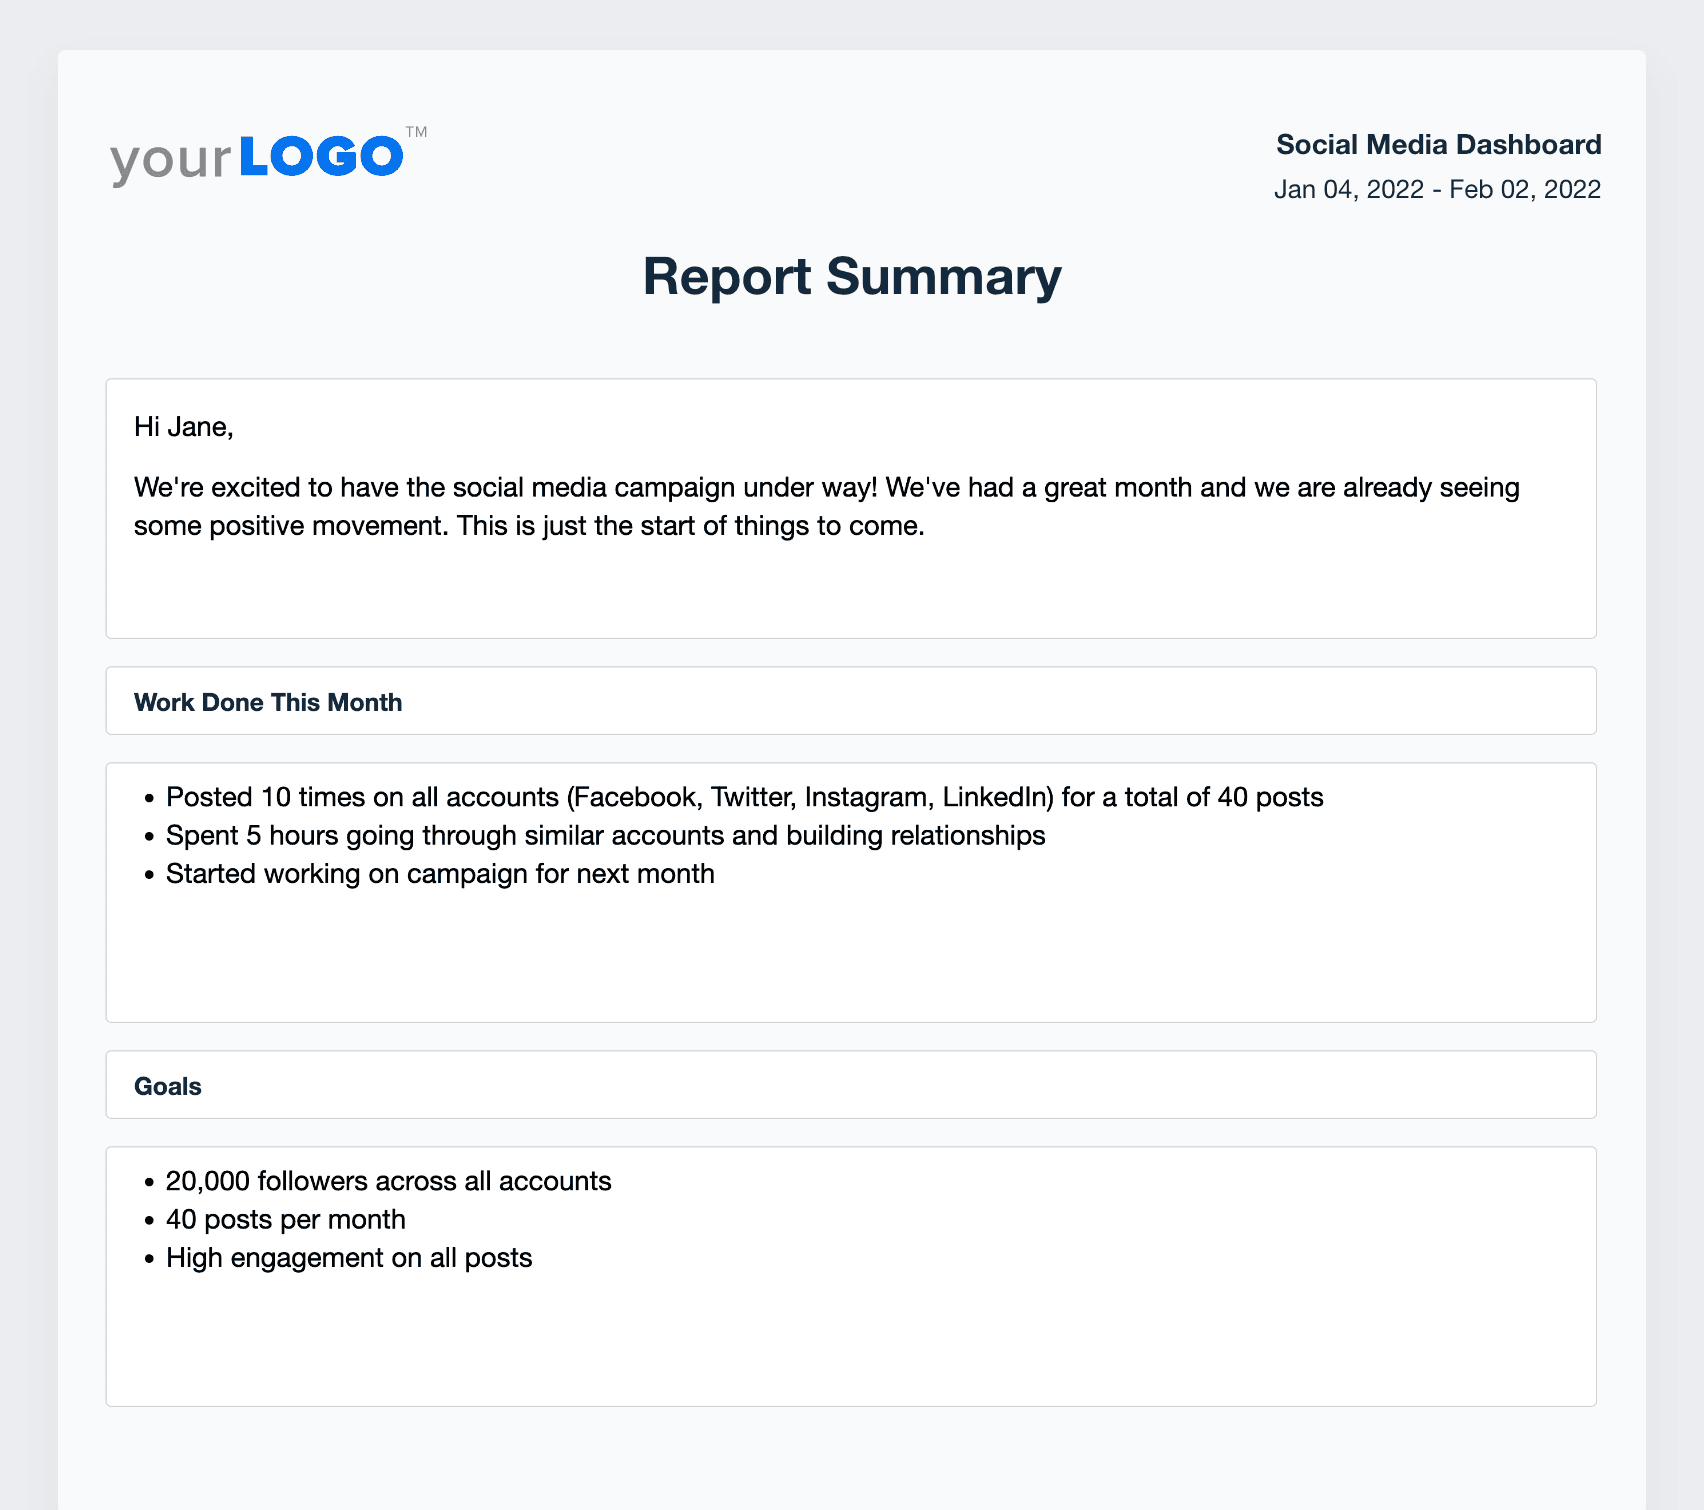
This helps leadership teams or time-strapped clients quickly understand the big picture without digging.
2. Use clear section headings and logical flow
Break the report into consistent, labeled sections like:
Overview / Executive Summary
Channel Performance (e.g., PPC, SEO, Email)
KPIs vs. Goals
Recommendations or Next Steps
Consistency in format makes reports easier to scan and compare month over month. If clients know where to find what they care about, they’re more likely to return to the report independently.
3. Only include the metrics that matter
Just because a tool gives you 30 charts doesn’t mean you must include them all. Filter down to the 5–10 KPIs that reflect the campaign’s performance in the context of the client’s goals.
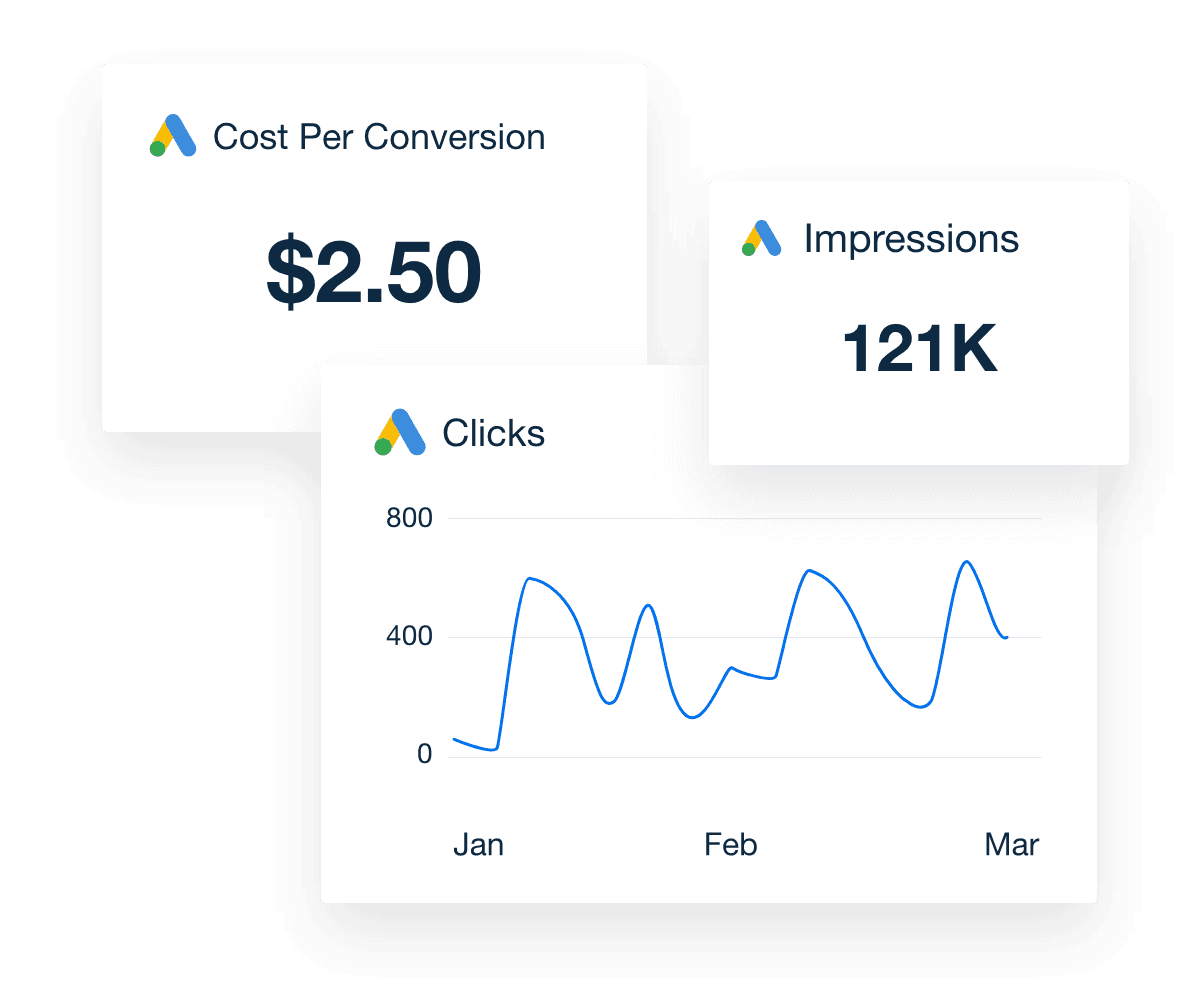
Ask yourself:
Would the client know what this number means?
Does this metric connect directly to business outcomes?
If it dropped next month, would it require action?
This approach keeps the report focused and avoids overwhelming your audience with noise.
4. Use visuals that tell a story
Bar charts, line graphs, and comparisons over time are powerful—when used well.
Add trend arrows or light commentary to explain the visual. For example: “Traffic dipped mid-month due to paused ad spend but rebounded after reactivation.”
Clear, concise, and visually engaging reports enable our clients to understand the data, metrics, and insights effectively, fostering better communication and alignment.
Alexa Rees, SEO Manager, seoplus+
5. Make it mobile-friendly and skimmable
Some clients will open your report on their phones, while others will scroll through it quickly, looking for a few key insights.
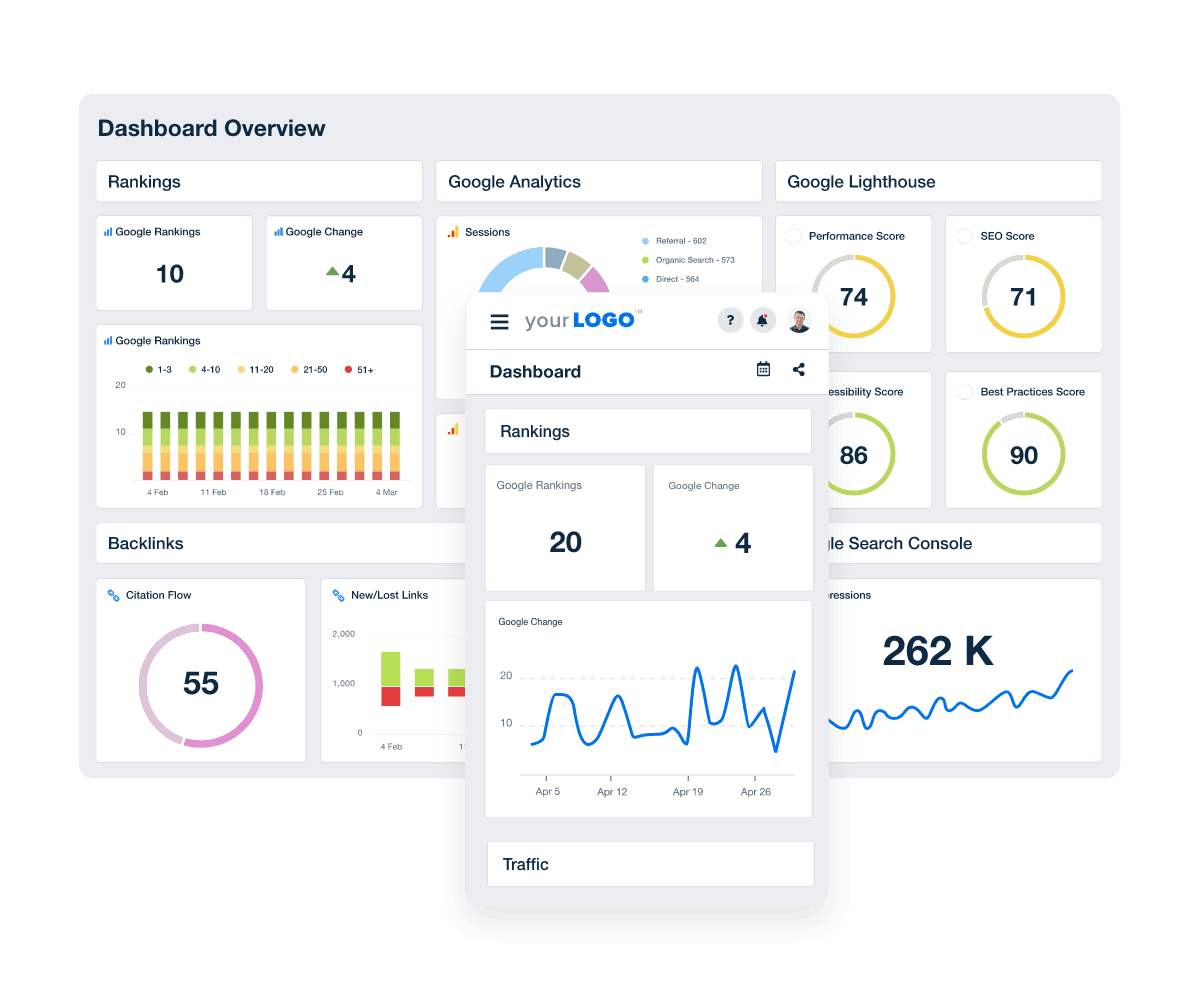
Keep paragraphs short, use bullet points where appropriate, and avoid cramming everything into one section. Headers and white space are your friends.
When reports are thoughtfully structured and visually clean, clients don’t have to work hard to find meaning. And that’s the first step to getting them to engage consistently.
Communication style: Write like a human, not a data bot
You can have the best-designed report in the world, but clients will still tune out if the commentary reads like a tech manual. The irony is that it’s easy to use AI tools to create summaries in seconds.
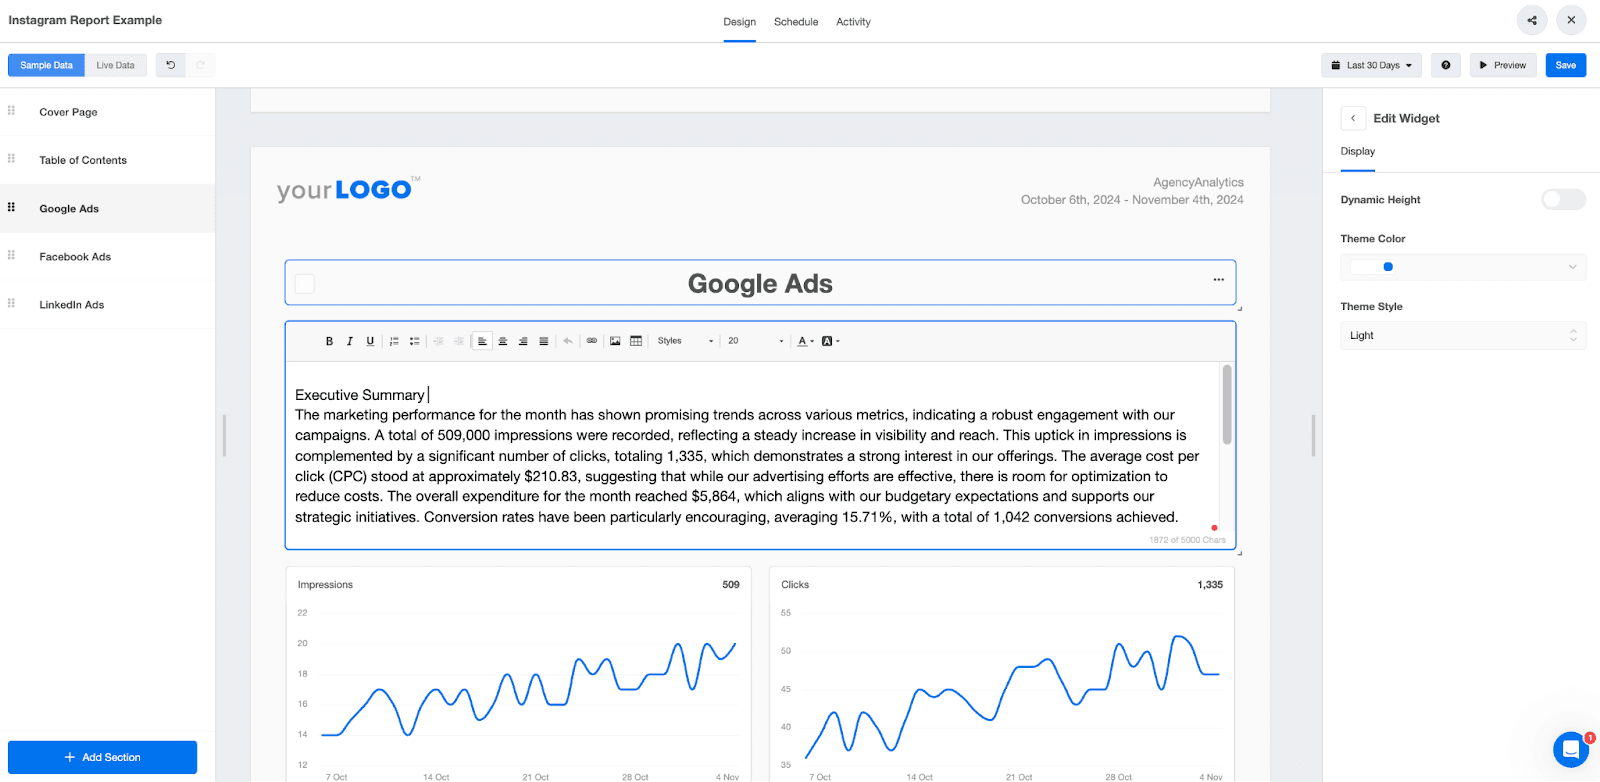
But remember to edit them so that they are relevant to your client. After all, your clients aren't data analysts. They're business owners, marketing managers, or executives who need clarity—not complexity. Your commentary, summaries, and insights should sound more like a conversation and less like a spreadsheet.
Here’s how to improve your communication style so your reports actually resonate:
6. Add simple explanations for each metric
Don't assume your client knows what "CTR" or "ROAS" means—especially in context. Use brief, plain-language explanations to clarify what's being measured and why it matters.
Instead of: "CTR increased 12% MoM."
Try: "More people clicked your ads this month—12% more than last month. This means your headlines and creative are working well."
7. Use plain language and a conversational tone
Jargon creates distance. Clients may nod along, but they won’t absorb what they don’t fully understand.
Keep your tone warm, confident, and accessible. Write like you’re walking the client through the results during a call—not presenting to a boardroom.
Avoid phrases like:
“Data indicates…”
“Key performance indicator fluctuations…”
Instead, say:
“Your email open rate increased slightly this month, likely due to the new subject line test.”
“We noticed Facebook ad clicks went down—this could be due to audience fatigue. We’re testing new creatives next.”
8. Use color and labels to reinforce meaning
Green for improvement, red for decline, gray for neutral—simple color cues help clients interpret data at a glance.
Pair colors and emojis with short, labeled insights like:
“↑ 28% New Leads This Month”
“↓ Ad Impressions: Budget Maxed Out Early”
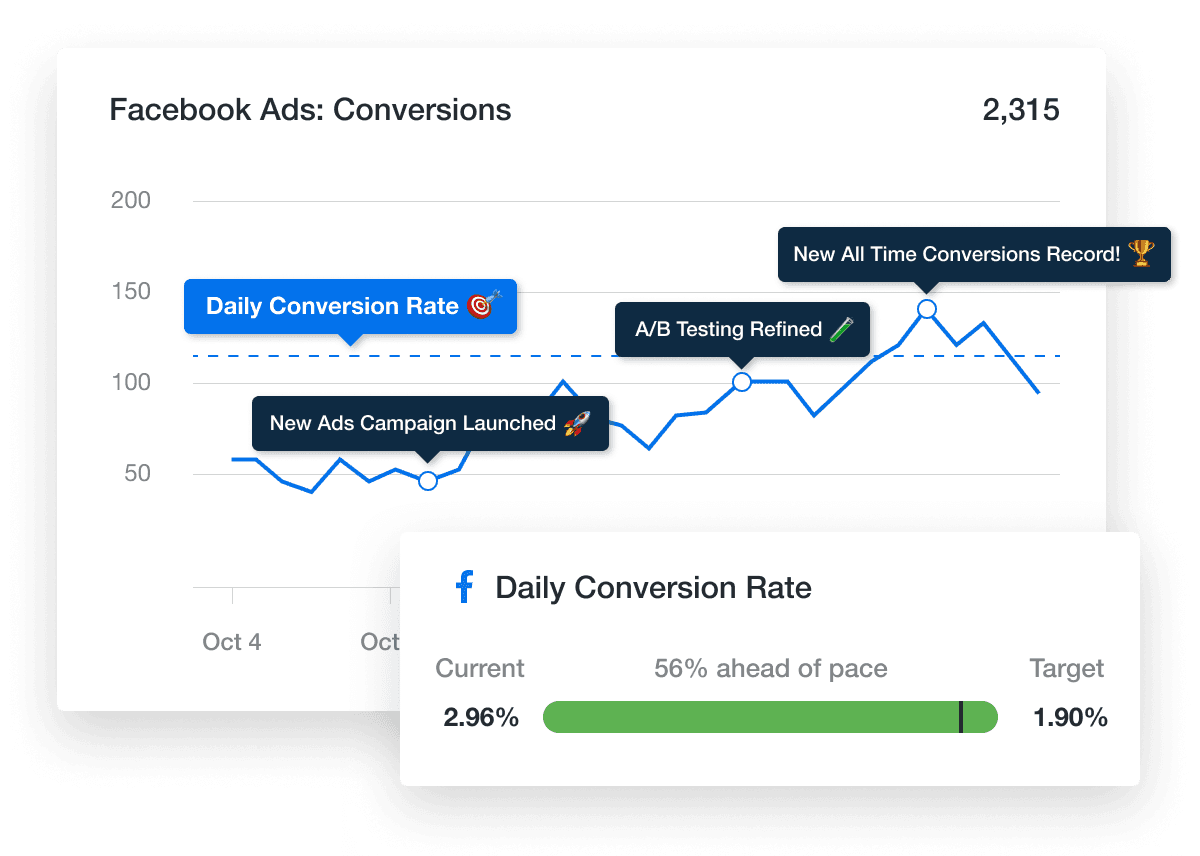
Small visual signals make a big difference in how quickly and confidently a client can assess performance.
9. Reuse language from previous conversations
Pay attention to how your clients talk about success. Do they care about “qualified leads” or “phone calls”? Are they focused on revenue, conversions, or booked consultations?
Mirror that language in your commentary. When clients see familiar terms, the report feels personalized—and more relevant.
At the beginning of each month, our account managers compile notes on their clients' campaigns... This may involve adding commentary, highlighting key trends, and making sure that the reports are easy to read and understand.”
Ben Paine, Managing Director, Digital Nomads HQ
10. Embed a Video Walkthrough of the Results
Sometimes, the best way to ensure a client understands the report is to explain it directly—without needing to schedule a meeting.
Recording a short video walkthrough using a screen recording tool (like Loom or Vidyard) allows you to highlight key wins, flag issues, and explain what’s coming next. Clients can watch it on their own time, replay it if needed, and forward it to internal stakeholders.

Even a quick 3–5 minute video can go a long way in reinforcing your value, especially for clients who prefer to listen instead of read.
Our reports are an important tool to show value in what we've done, but also the platform where we demonstrate potential opportunities for our clients. We like to include written summaries and walkthrough videos directly in the reports that help to qualify the data and highlight key points.
Ryan Hayes, CEO, Sparrow Digital
When your reports are written like a trusted advisor instead of a data dump, clients stop skimming and start paying attention.
Impress clients and save hours with custom, automated reporting.
Join 7,000+ agencies that create reports in under 30 minutes per client using AgencyAnalytics. Get started for free. No credit card required.
Already have an account?
Log inCollaboration & presentation: Don’t just send it. Show it.
You’ve spent time structuring the report, writing clear commentary, and highlighting wins. But if your report is just emailed out with no context or conversation, it’s easy to end up unread—or misunderstood.
Don’t think of reports as busywork; think of them as opportunities to build trust, align on strategy, and deepen your client relationships. When you treat reporting as a two-way exchange, not a one-sided download, you shift it from data delivery to client collaboration.
Here’s how to make that shift:
11. Schedule a walkthrough, even if it’s brief
A short call—just 15 to 20 minutes—can transform how your client engages with the data. It gives you space to highlight key insights, answer questions in real time, and pivot the conversation toward strategy.
Clients don’t always know what questions to ask until they’re looking at the data with you. By making this a regular part of your reporting cadence, you make space for better feedback, stronger relationships, and more shared wins.
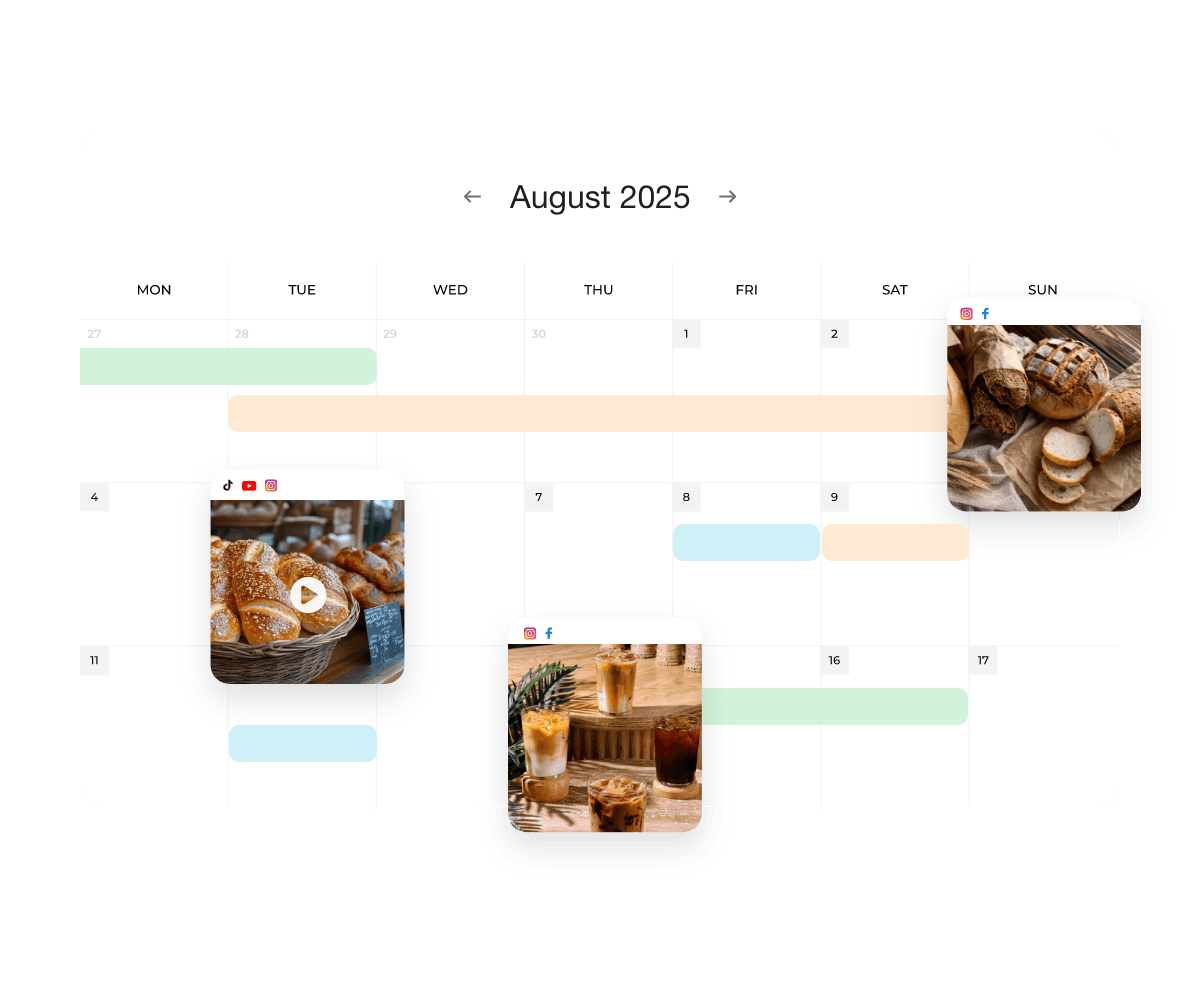
Embedding your agency’s calendar into your reports and dashboards makes it easy for clients to book follow-up meetings to discuss the next opportunity for growth.
Agency tip: Connect your preferred client messaging tool to discuss reports, share insights, and answer questions without leaving your reporting platform.
12. Let clients customize what they see
Not every client cares about the same metrics. Leadership might want revenue and ROI, while a marketing manager may want deeper channel performance.
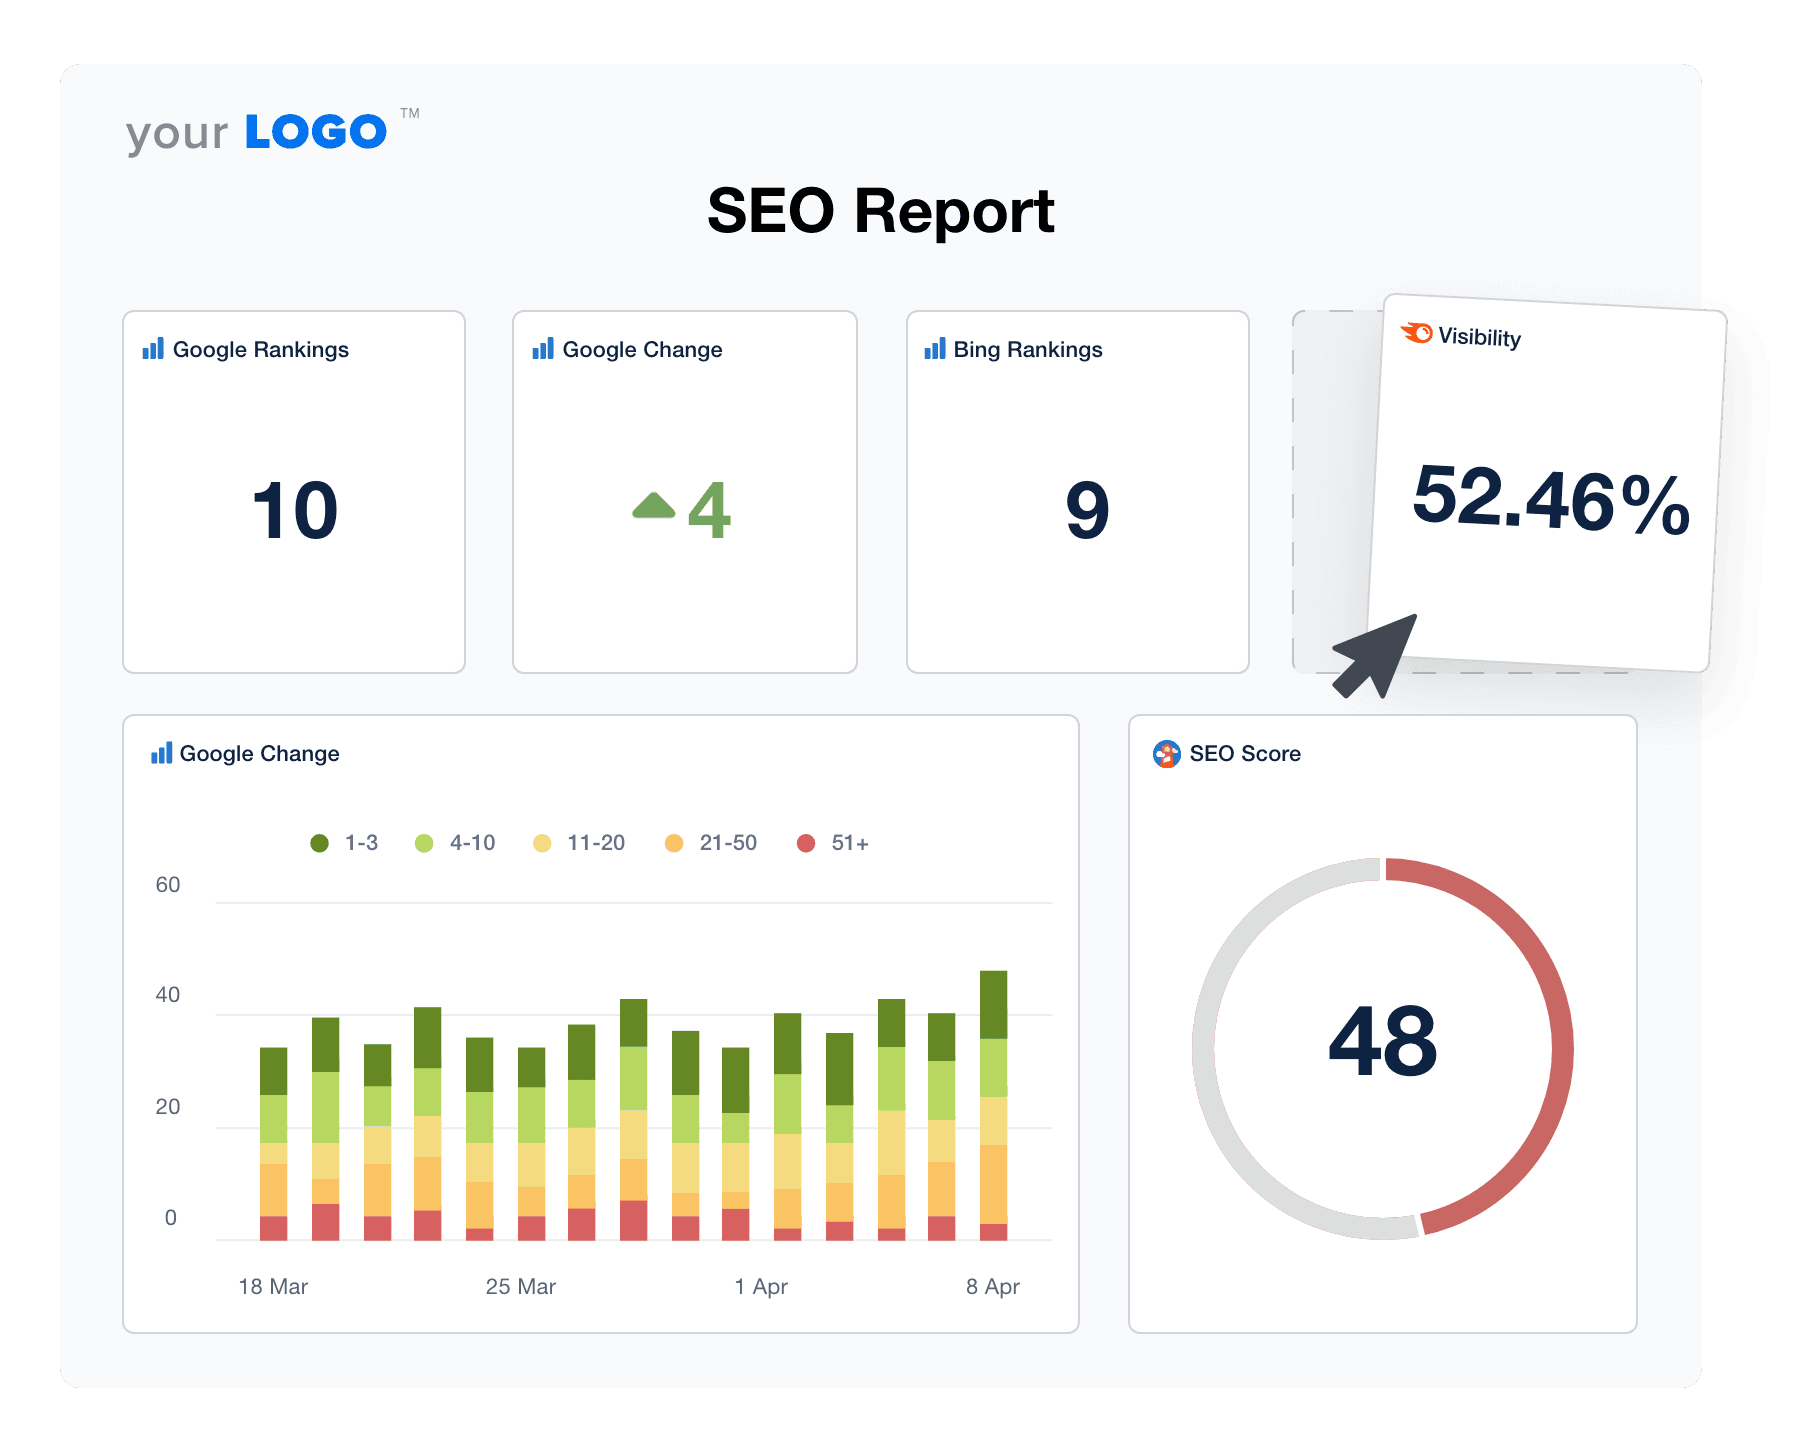
Use customizable dashboards or templated reports that can be tailored by role or goal. This creates buy-in and helps stakeholders get precisely what they need—without being buried in irrelevant data.
Many of our client relationships require customized reports because we're managing multiple marketing channels for them at once... They want everything condensed into one, easy-to-read report, where they can view all of their most significant marketing data in one place.
Graham Lumley, Director of Growth Marketing, Blackhawk
13. Include clear next steps and recommendations
Reports are a springboard to action. But if they end with a summary and no direction, your client may wonder, “So... now what?”
Close every report with 2–3 simple recommendations. Whether it’s “increase budget on top-performing campaigns” or “test new landing page copy,” these action items show that you're not simply tracking results—you’re actively thinking about how to improve them.
Build out templates that focus on the metrics each client needs to see - report on what’s necessary rather than everything and anything because after one view, they are rarely looked at again so make your reports meaningful, understandable and don’t forget to include the most important pieces - WE DID THIS - AND THE RESULT WAS THAT or WE NOTED THIS and will be taking THIS ACTION in the next month.
I always look at data and ask myself SO WHAT? If the report doesn’t answer the SO WHAT question then don’t send it.
Cheryl Ingram - Managing Director, TDMC
14. Use reporting to reinforce strategic value
Too often, reporting becomes a passive formality. But when used well, it’s a strategic differentiator.
Clients want to feel like you're paying attention, that you're driving the work forward—not just measuring what already happened. When you show up with data and a plan, they see you as a proactive partner, not a reactive vendor.
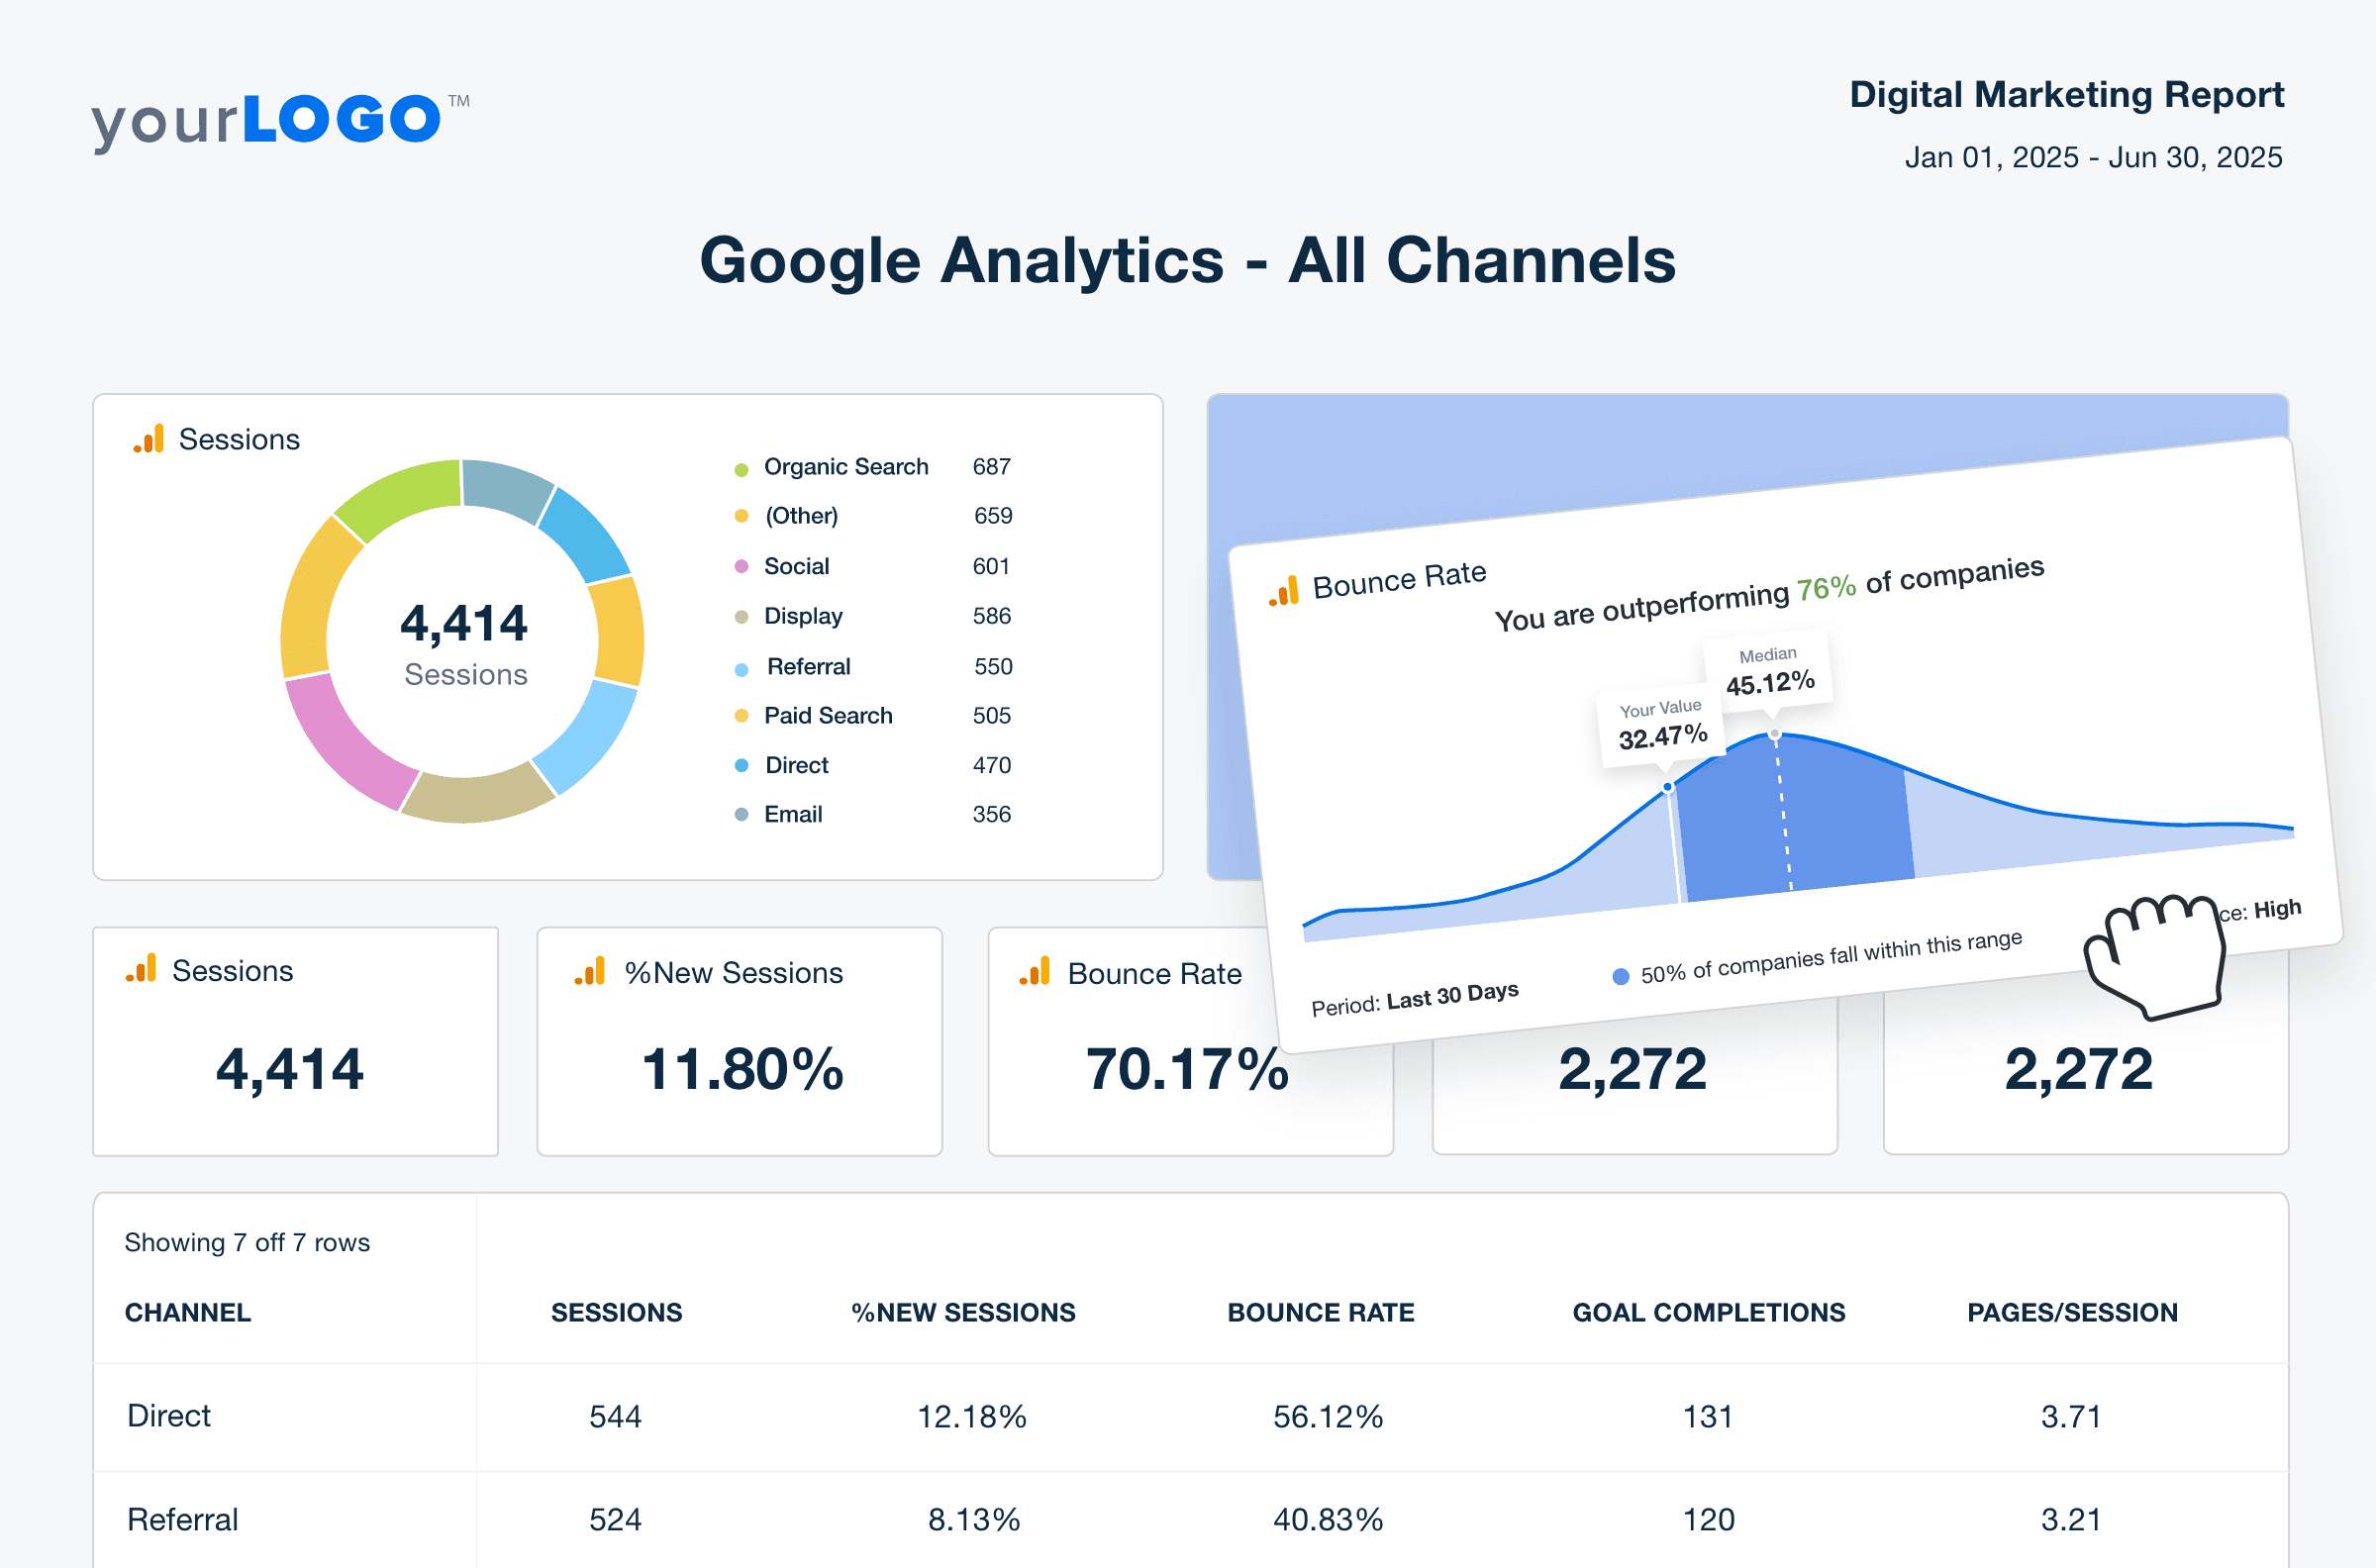
Instantly compare key metrics to industry benchmarks and include this data on digital marketing dashboards. Try AgencyAnalytics free for 14 days!
Well-built reports create space for better conversations. They help you get ahead of questions, turn insights into action, and build stronger client partnerships over time.
15. Send a reminder if the report hasn’t been opened
Sometimes, clients simply miss the report in their inbox—or intend to look at it later and never circle back. If your reporting tool tracks opens or engagement, use that insight to follow up with a quick, friendly reminder.
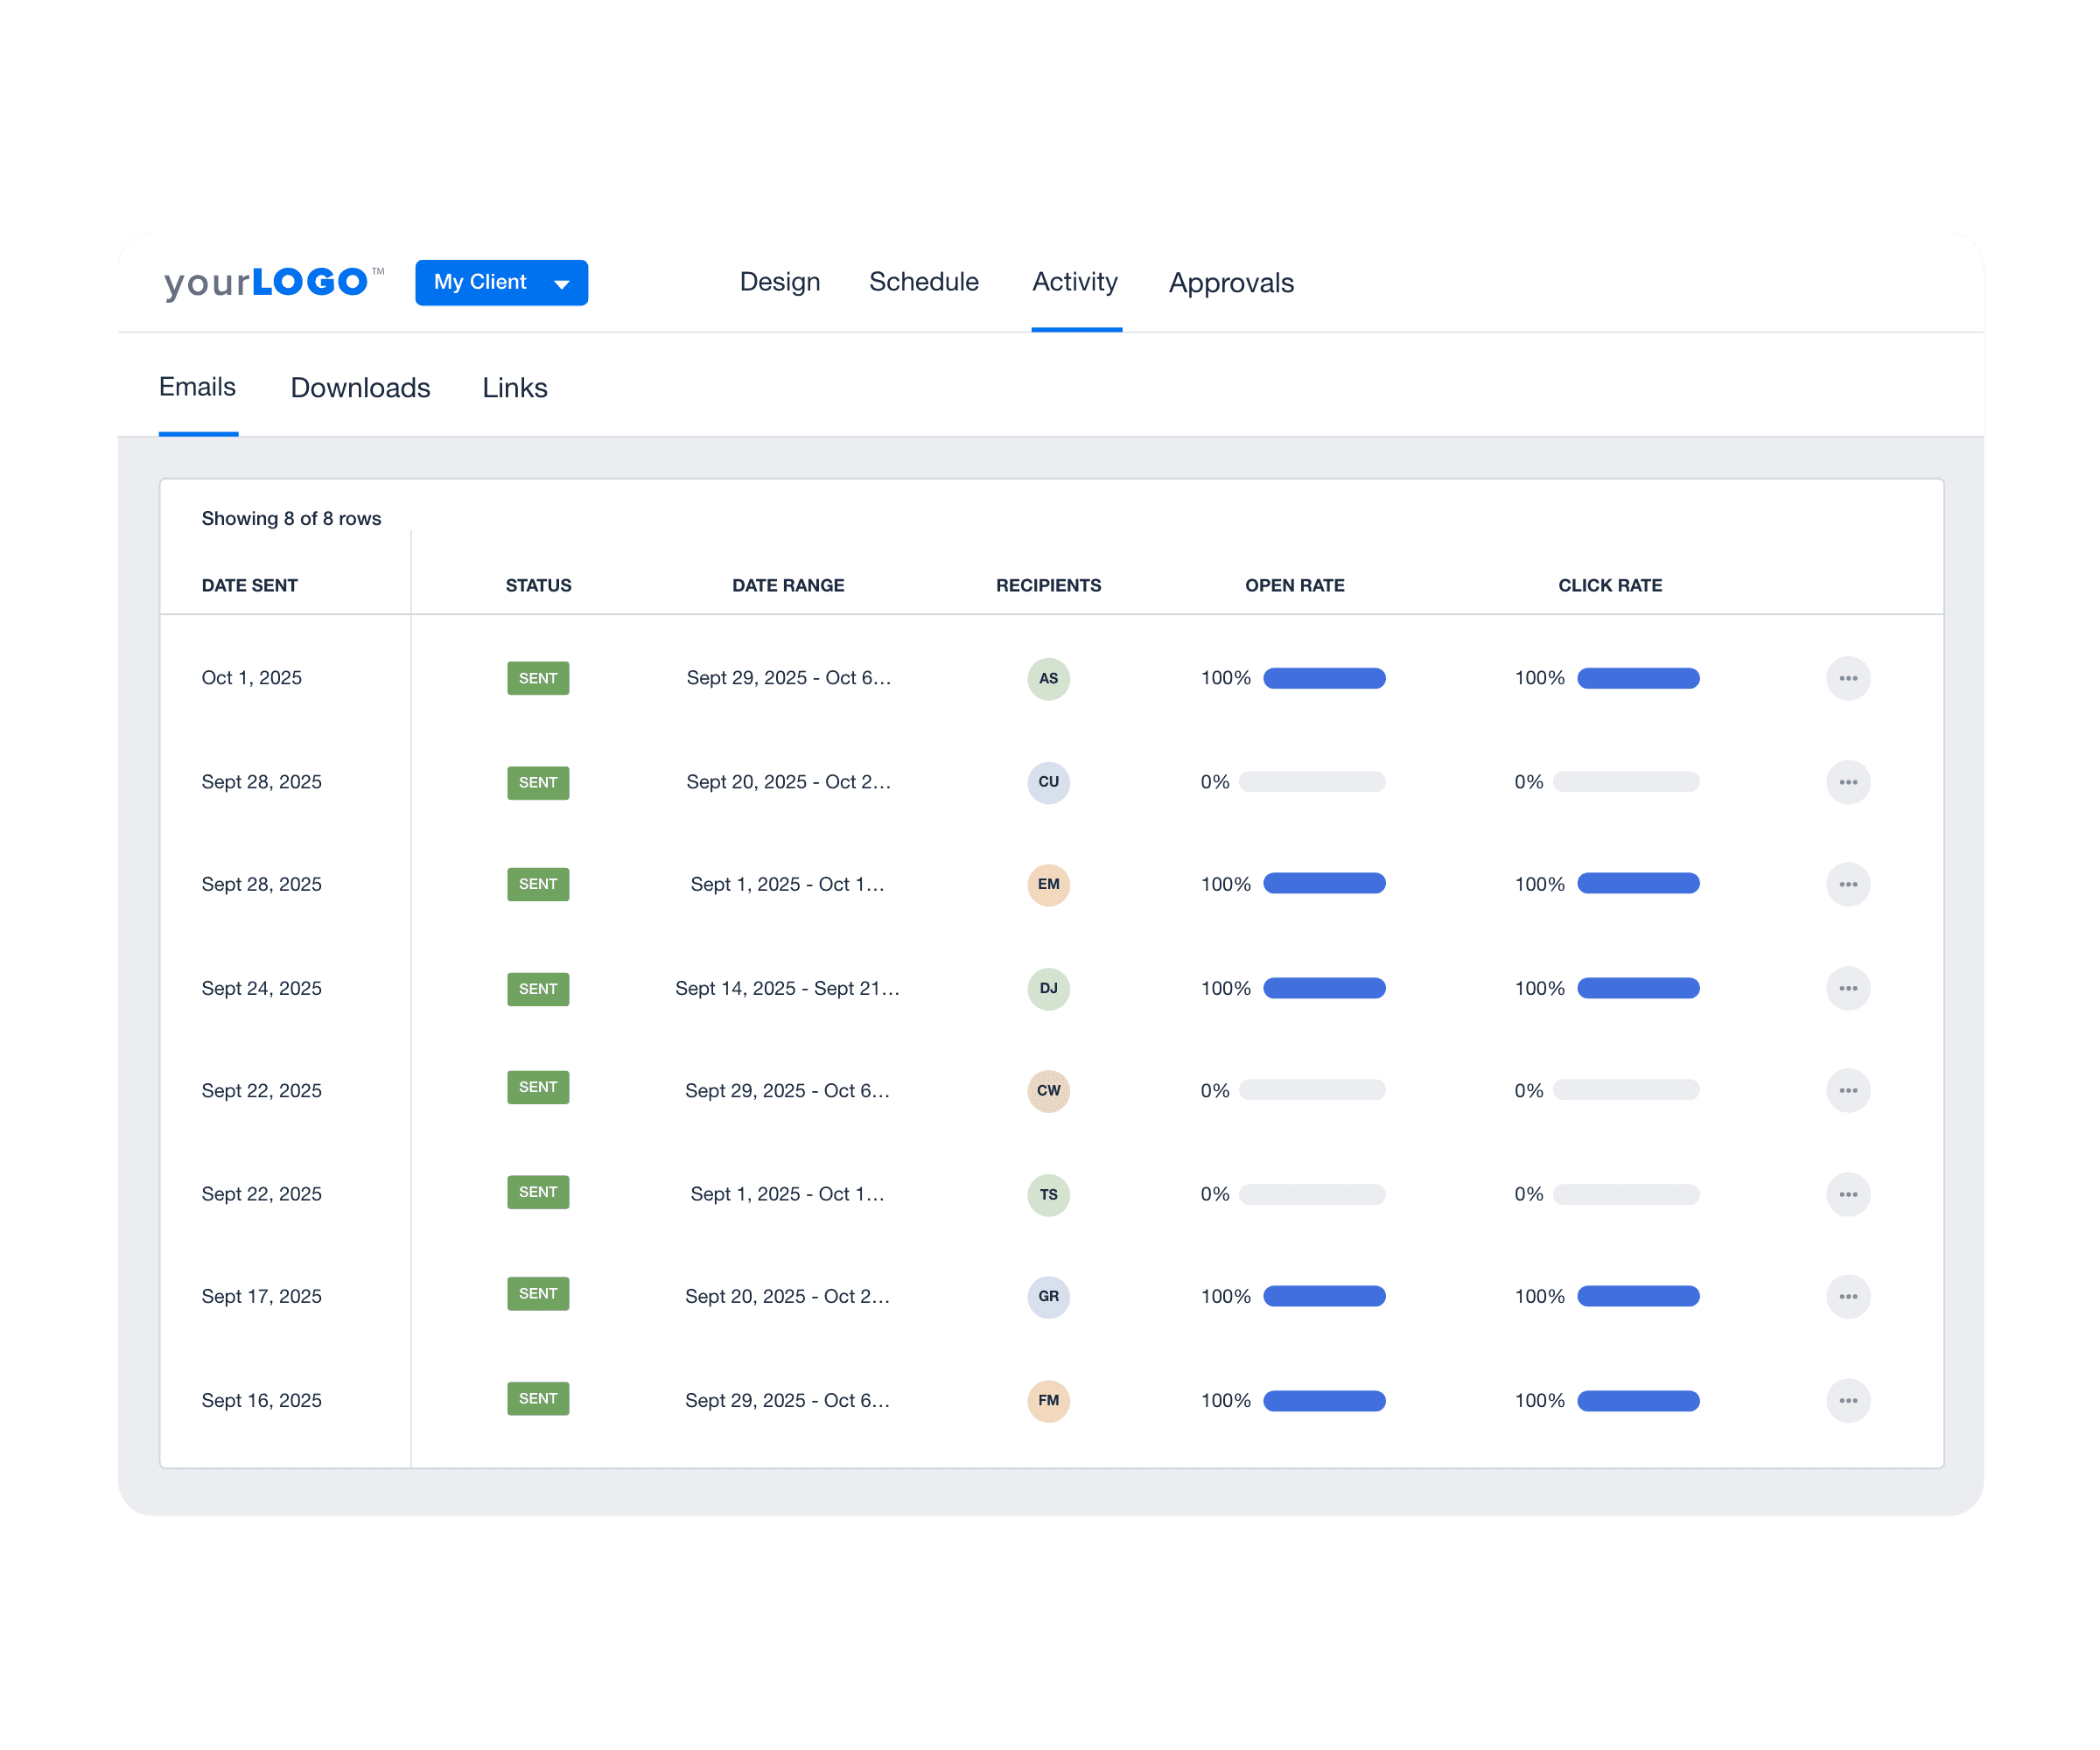
You don’t need to nudge aggressively. A short message like “Just checking in—wanted to make sure you had a chance to look at this month’s results. Let me know if you’d like to walk through anything together” keeps the tone collaborative and helpful.
This small step reinforces that you care about transparency and want your work to be seen. It also opens the door to valuable client conversations that might be missed.
Education & trust-building: Help clients feel smart and supported
Not every client knows how to read a report—and that’s okay. An agency’s job is about more than numbers; it’s about making those numbers meaningful.
It's our job to tell a simple story through reporting to our clients. The report is the client's proof that what we are doing is benefiting their business in a positive way. AgencyAnalytics allows us to quickly create beautiful reports that tell a story in a way our clients can understand.
Brian Ferritto, Partner, 42connect
The more you guide your clients through the why behind the data, the more trust you build. And when clients trust the numbers, they trust your recommendations.
Here’s how to build education and trust into your reports without overwhelming your clients:
16. Include mini-glossaries for newer clients
Not every client is fluent in marketing metrics, especially if they’re early in their digital journey. A simple glossary at the end of the report—or tooltips built into a live dashboard—remove guesswork and help them feel more confident.
Define things like:
Even better, provide a plain-language definition and a sentence about why it matters on paper or in person.
Walk them through the first report! Especially if you are working with contacts that don’t have a marketing background. We might know what CPC, CPM, etc. mean, but they may not. Tell them why you picked specific subjects to show on their monthly report and what numbers are ‘good’ or ‘bad’. This way, you show them the value of the report and you’ll see higher open-rates.
Nico de Jong, CEO, Forward Marketing
17. Show trends over time, not just current snapshots
Point-in-time data (like this month’s numbers) is useful—but limited. Clients may overreact to normal fluctuations or miss the bigger picture without context.
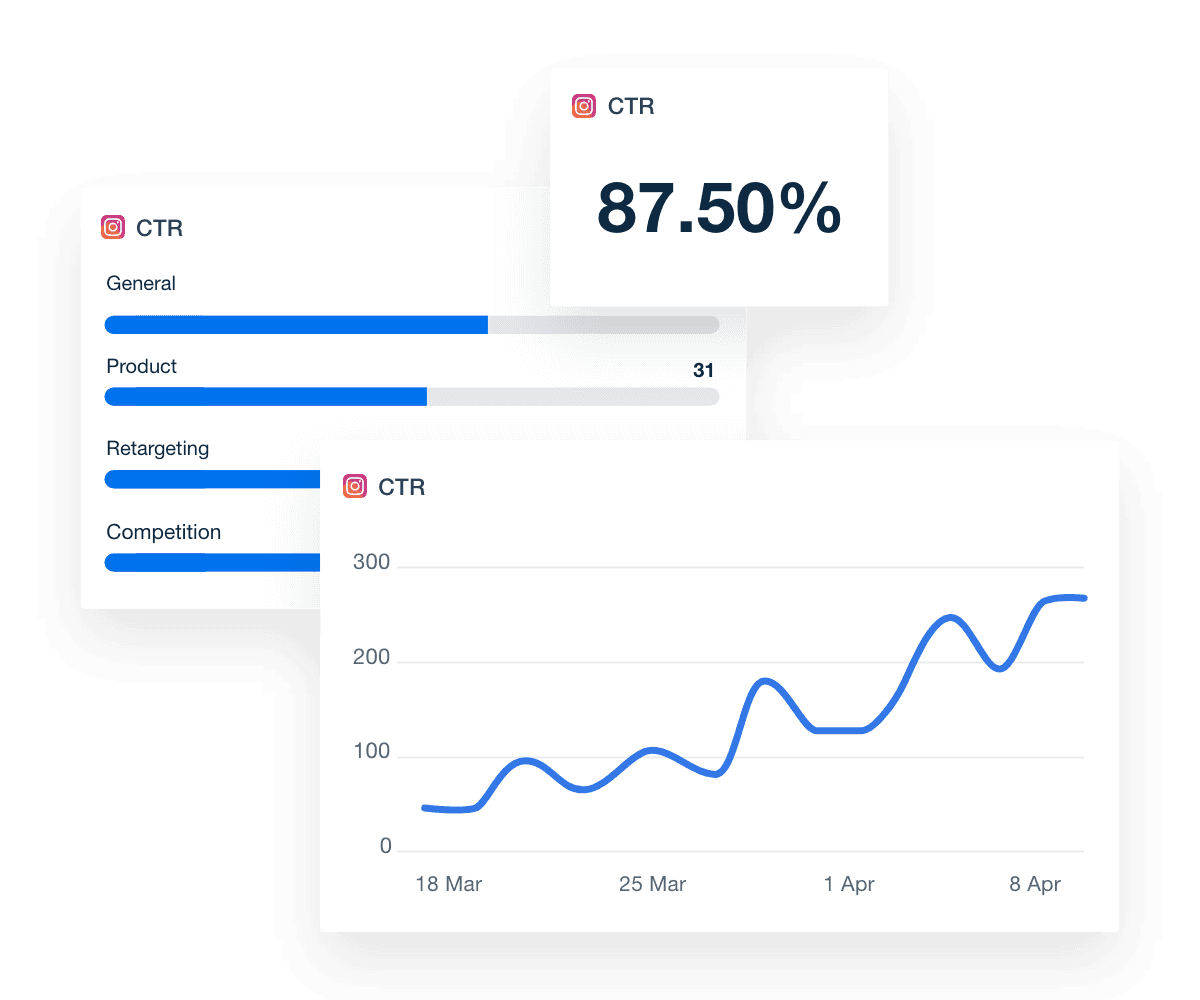
Help clients spot patterns by showing data over time:
3-month and 6-month trends
Year-over-year comparisons
Before/after snapshots tied to major changes (like new campaigns or landing pages)
This reinforces the idea that marketing performance is a journey—not just a series of isolated data points.
18. Explain what didn’t go well (and what you’re doing about it)
Clients don’t expect perfection. But they do expect transparency.
When you acknowledge underperformance—and immediately follow it with a plan to improve—you build credibility. In fact, sharing setbacks openly often builds more trust than only highlighting wins.
For example:
“Email open rates dropped this month, likely due to audience fatigue. We’re testing new subject lines and cleaning up the list to improve performance in Q2.”
There's trust that comes with the agency/client relationship when you offer complete transparency instead of just a white sheet once a month with some numbers on it.
Brooke Lamberti, Director of SEO, RiZen Metrics
19. Highlight wins (and opportunities) that tie directly to client business goals
Vanity metrics (like impressions or likes) can be misleading if they’re not connected to something meaningful. Use reporting to draw a clear line between your work and your client’s business outcomes.
Clients want to know their investment is paying off, and that you’re paying attention. Make it easy for them to see that connection, and they’ll be more likely to stay, grow, and refer.
By prioritizing professional and user-friendly reports, we consistently uphold our commitment to delivering exceptional quality and ensuring a positive client experience.
Alexa Rees, SEO Manager, seoplus+
20. Ask someone to review your report for clarity
When you're deep in the data, it's easy to overlook what might confuse someone else. Before sending a report—especially for a new client or a complex campaign—ask someone outside the immediate project to review it.
This could be:
A team member who wasn’t involved in building the report
A colleague from another department
Even a friend who doesn’t work in marketing
If they can understand the report quickly and confidently, chances are your client will too.
Clarity isn’t about dumbing things down—it’s about respecting your client's time and mental load.
AgencyAnalytics gives our clients clarity and confidence because of how easily we can communicate our efforts and results to them on a frequent, consistent basis.


Client reports aren’t proof of work—they’re proof of value
When clients don’t read your reports, it’s a missed opportunity and a missed connection. The data you share is more than proof of performance. It’s a tool to build trust, spark conversations, and show clients exactly how you’re helping their business grow.
Excellent reporting isn’t about cramming in more metrics. It’s about clarity, context, and confidence. It’s about helping clients see what matters, understand why it matters, and feel good about what’s next.
And the best part? It doesn’t have to add more work to your plate.
Tools like AgencyAnalytics were built for exactly this—so you:
Create clean, professional reports that match your agency’s brand
Pull in data from every platform your clients care about
Customize views by client, campaign, or stakeholder
Schedule delivery, add commentary, and even embed video walkthroughs
Include AI-powered insights or set up a structure that your whole team can follow
Whether you’re managing 20 clients or 200, your reports are one of your agency’s strongest retention tools—without burning your team out in the process.
Because at the end of the day, most clients don’t want raw data for data’s sake. They want confidence. They want clarity. And they want to know they’re in good hands.
BONUS: The “Is your client report readable?” checklist
Before you hit send, run your report through this quick checklist. If you confidently say yes to most of these, you’re on the right track:
📑 Structure & Clarity
Does the report begin with a summary of key results?
Are the sections clearly labeled and easy to scan?
Have you removed any unnecessary charts or data points that don’t reinforce value?
Can someone outside your agency understand the flow?
🗣️ Language & Tone
Are your explanations written in plain, conversational language?
Did you avoid jargon, buzzwords, acronyms, or overly technical terms?
Are key metrics followed by a short “what this means” for new clients?
Are the next steps or recommendations clearly spelled out?
🎨 Design & Visuals
Are charts, tables, and graphs visually clean and not overcrowded?
Are you using color or visual cues to signal performance trends?
Is there enough white space to make the report easy on the eyes?
Does the report look good on both desktop and mobile?
🤝 Collaboration & Trust
Have you included a way for the client to ask questions or follow up?
Did you acknowledge any areas of underperformance (with a plan)?
Is the report customized to reflect the client’s specific goals?
Did you check that the report aligns with their business language?
✅ Final Step
Are you checking the report statistics to see if reports are opened?
If the report goes unread, is there a reminder process in place?
Agency tip: Use task management software to build this checklist directly into your AgencyAnalytics workflow. Use internal templates, comments, and scheduled reminders to ensure each report checks all the right boxes—every time.
FAQs About Agency‑Client Reporting
Wondering how to manage reporting for your marketing agency clients? These FAQs cover what agency client reporting means, how to choose the right tools, and what making reports clear and valuable involves.
Agency client reporting refers to the periodic presentation of your work and results to each client—demonstrating how your marketing services align with their goals and business growth.
It typically includes insights into key performance indicators (KPIs), analysis of campaign performance, and next‑step recommendations. Because client reports serve as a foundational touchpoint in the agency‑client relationship, they help build trust, improve transparency, and reduce churn.
A marketing agency should use a robust tool or platform like AgencyAnalytics that centralizes data from multiple marketing channels (SEO, PPC, social media, email, etc.), automates report generation, and supports customization and white‑labeling for clients.
The right platform will allow you to pull in data easily, create dashboards for both internal team use and client‑facing views, and reduce manual data entry so you can allocate more time to analysis and strategy.
Clients value reporting capabilities that offer clarity, relevance, and strategic insight. This means dashboards or reports that:
Present key metrics tied to their business goals (not just every number possible)
Use visualizations and narrative commentary to make data understandable to non‑marketers
Provide multi‑channel views so clients can see how efforts across SEO, PPC, social media, etc. combine to drive results
Features like automated report scheduling, custom branding, and client portal access also enhance perceived value and trust.
Clear client reporting doesn’t just present metrics—it delivers a story that clients can understand, trust, and act on.
The report structure should reflect the client’s business priorities, not just campaign activity. Every section must answer the unspoken question: “Why does this matter to me?”
Use consistent formatting and visuals across reports to build familiarity. Instead of overwhelming with data, highlight key indicators and show progress over time.
Include simple but strategic commentary—avoid jargon, and frame results in terms of outcomes and recommended actions.
Above all, make your reports predictable in schedule, digestible in format, and purposeful in message. When reports check those three boxes, clients feel informed, not fatigued.
A well‑structured agency client report often includes five essential parts:
Executive Summary/Cover Page – a branded overview introducing what the report covers.
Performance Review – data on how campaigns are matching or surpassing KPIs (e.g., conversions, lead volume, spend efficiency).
Channel Breakdown – insights by marketing channel (SEO, PPC, social, email) showing what's working and what needs adjustment.
Insights & Recommendations – your expert interpretation of the data, including actionable next steps and strategy pivots.
Optional Appendix or Data Dashboard – detailed results, charts or raw data for clients who want deeper exploration, along with notes on methodology.

Written by
Paul Stainton is a digital marketing leader with extensive experience creating brand value through digital transformation, eCommerce strategies, brand strategy, and go-to-market execution.
Read more posts by Paul StaintonSee how 7,000+ marketing agencies help clients win
Free 14-day trial. No credit card required.


