Table of Contents
QUICK SUMMARY:
LinkedIn Ads benchmarks provide valuable insights into key metrics like CPC, CTR, impressions, and engagement across industries. Understanding these numbers helps agencies optimize LinkedIn ad campaigns and accurately assess industry standards. Explore the median values for key benchmarks like CPC and CTR, backed by data from 150,000+ campaigns on the AgencyAnalytics platform. Learn how to leverage LinkedIn ad benchmarks and make sure your agency’s results are meeting–or ideally exceeding–the industry standard set by agencies just like yours.
Looking to achieve LinkedIn Ads success? Unsurprisingly, it’s all about the numbers.
From identifying cost trends to measuring audience engagement, agencies rely on data-rich insights to help clients meet (or even surpass) their goals. That said, it’s just one piece of the puzzle. To truly understand performance in a macro sense, agencies must also look at what’s happening on the outside.
That’s exactly where benchmarks come in. Think of them as a guide–one that lets your agency see how campaigns compare to industry standards. It’s a way to highlight notable trends, identify gaps, and show where data-driven adjustments should be made to achieve solid results.
Here’s another thing–what sets LinkedIn apart is its focus on B2B audiences, like Financial Services or Advertising & Marketing. It’s often a go-to advertising platform for these professional businesses, offering a way to connect with decision-makers and attract high-quality leads.
Metrics like cost per click (CPC), click-through rate (CTR), and engagement all reflect the effectiveness of campaigns across industries. And with exclusive first-party data through our extensive database of 7,000+ marketing agencies, we’ve got a reliable way to analyze these trends and refine ad strategies.
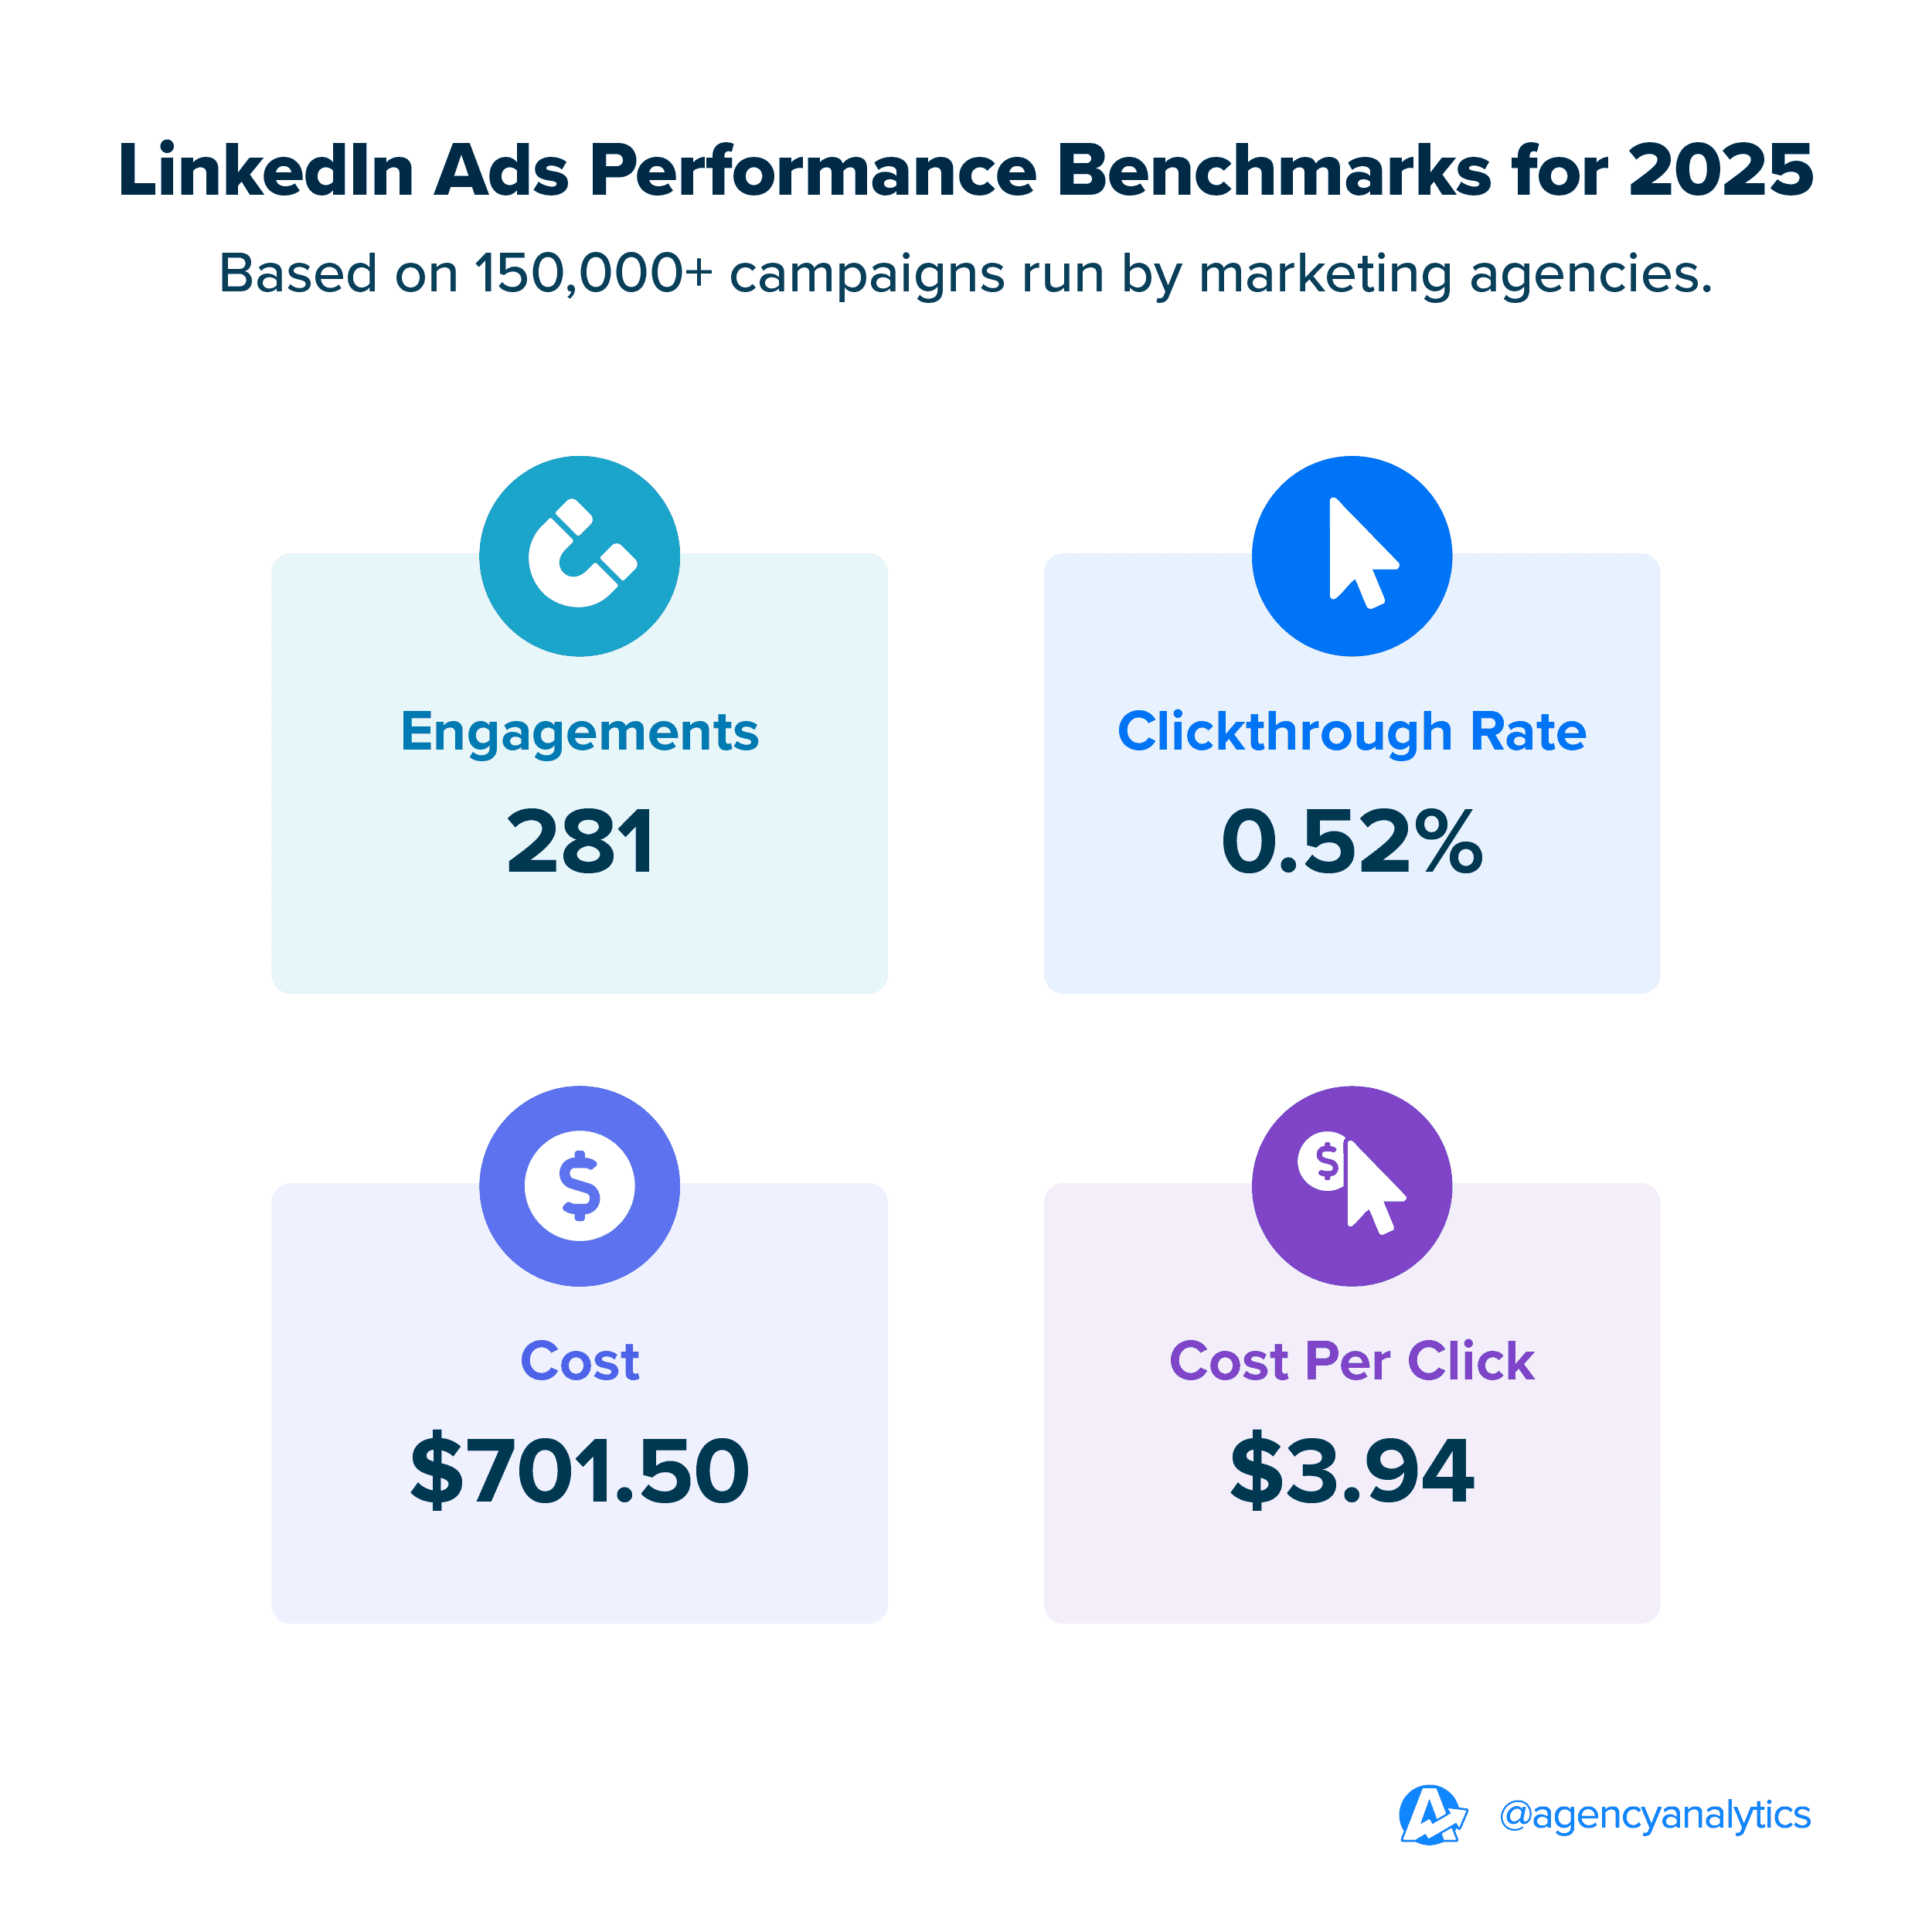
Curious about these findings? Here’s a quick look at the most important benchmarks across the LinkedIn Ads platform:
In this article, we’re diving into insights from over 150,000 marketing campaigns to reveal the LinkedIn Ads standards set by top agency professionals like you. Learn how to use these benchmarks to improve campaign planning, optimize strategies, and increase your agency’s value proposition.
Why LinkedIn Ads Benchmarks Matter
LinkedIn benchmarks are the go-to reference for measuring ad performance. They provide a clear comparison of campaigns against industry norms, making it easier to spot what’s working and what needs improvement.
By focusing on metrics like click-through rates (CTR), cost per click (CPC), and engagement, benchmarks help fine-tune strategies and drive better results.
How LinkedIn Advertising Benchmarks Shape Campaign Performance
LinkedIn Ads benchmarks provide a reality check for campaign results. For example, if the average CTR in your client’s industry is 0.5% and their campaign sits at 0.3%, it’s a signal to rework targeting or ad creatives.
Alternatively, if the CPC is lower than the benchmark, it’s a clear sign that their LinkedIn Ads are cost-effective and connect well with the target audience. Benchmarks are a must-have for helping clients stay one step ahead and achieve their objectives.
Why LinkedIn Ads Benchmarks Keep Clients Happy
Clients want more than generic reports–they want context. Benchmarks provide exactly that, showing how their campaigns compare to industry peers, which also demonstrates the value of your services.
For instance, if your client’s campaigns consistently beat industry benchmarks, it’s a powerful way to prove ROI and build trust. Conversely, benchmarks also help explain underperformance objectively, providing a frame of reference for areas that need improvement.
Instead of vague explanations, they highlight specific metrics—like a higher-than-average CPC or lower engagement rates—leading to more transparent discussions about the way forward.
How LinkedIn Ads Benchmarks Drive Campaign Success
LinkedIn Ads benchmarks ensure marketing strategies remain effective and results-driven. Use them to:
Optimize Ad Spend: Comparing costs against benchmarks makes it easier to allocate budgets to what works and yields ROI.
Refine Audience Targeting: Engagement metrics help identify how well ads resonate with LinkedIn's professional audience, leading to better targeting and messaging.
Track Progress Over Time: Benchmarks serve as a baseline to assess ongoing improvements, ensuring campaigns remain competitive.
Interested in exploring the ins and outs of this platform even more? Check out this comprehensive LinkedIn Ads guide.
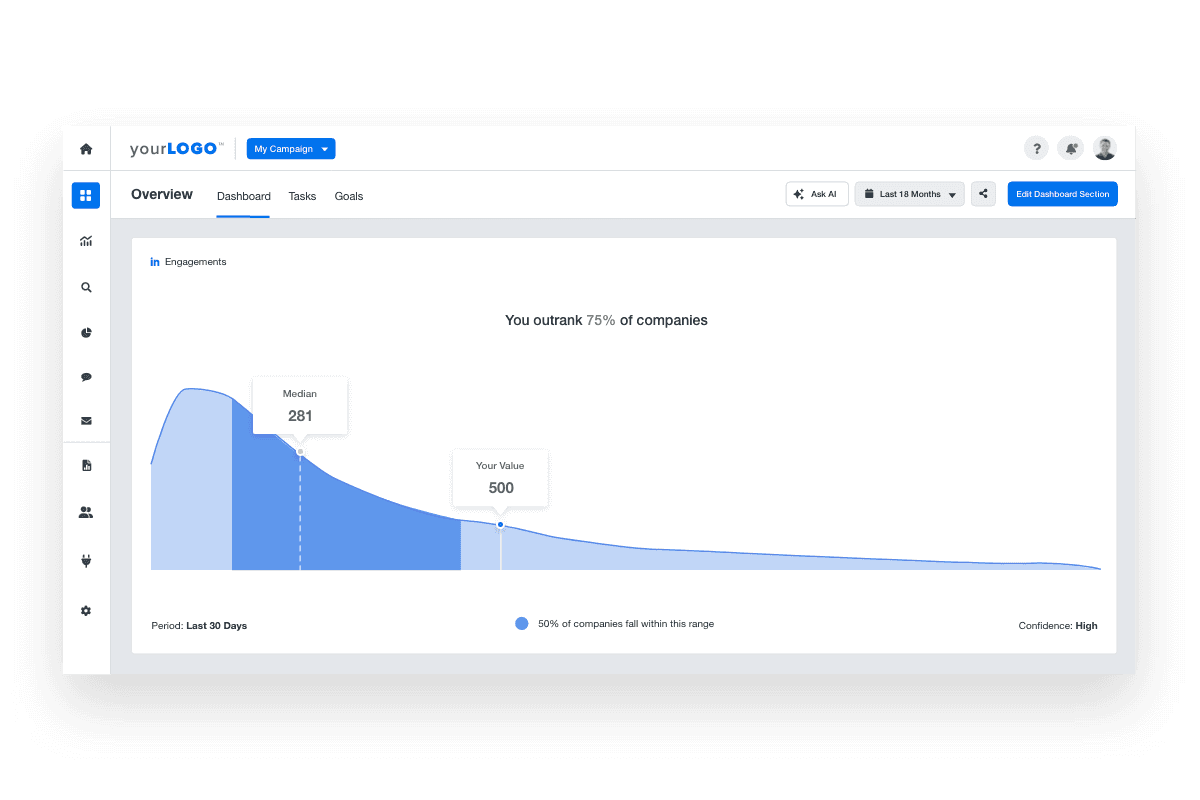
View industry-specific benchmarks directly in your AgencyAnalytics dashboard–no extra analytics tools required. Explore these agency-centric features by signing up for a free 14-day trial today.
The Value of Industry Benchmarks
Industry benchmarks are the foundation for evaluating marketing performance.
When used effectively, they guide decision-making, improve campaigns, and build client confidence–let’s explore further.
Average vs. Median Benchmarks: What’s The Difference?
While averages are popular, medians are actually more reliable for evaluating performance. Consider that:
Averages are calculated by adding all data points and dividing by the total. However, they’re often skewed by outliers (e.g., one-off ad campaigns with unusually high or low performance).
Medians, on the other hand, represent the middle-value across multiple campaigns. Therefore, these values provide a more accurate picture of typical performance across LinkedIn advertising campaigns.
AgencyAnalytics focuses on medians because they provide realistic benchmarks that reflect most campaigns. For example, if most campaigns in an industry have a CTR of around 0.4%, but one outlier hits 5%, an average would inflate expectations. Medians avoid this issue, ensuring the data is grounded in what agencies are likely to experience.
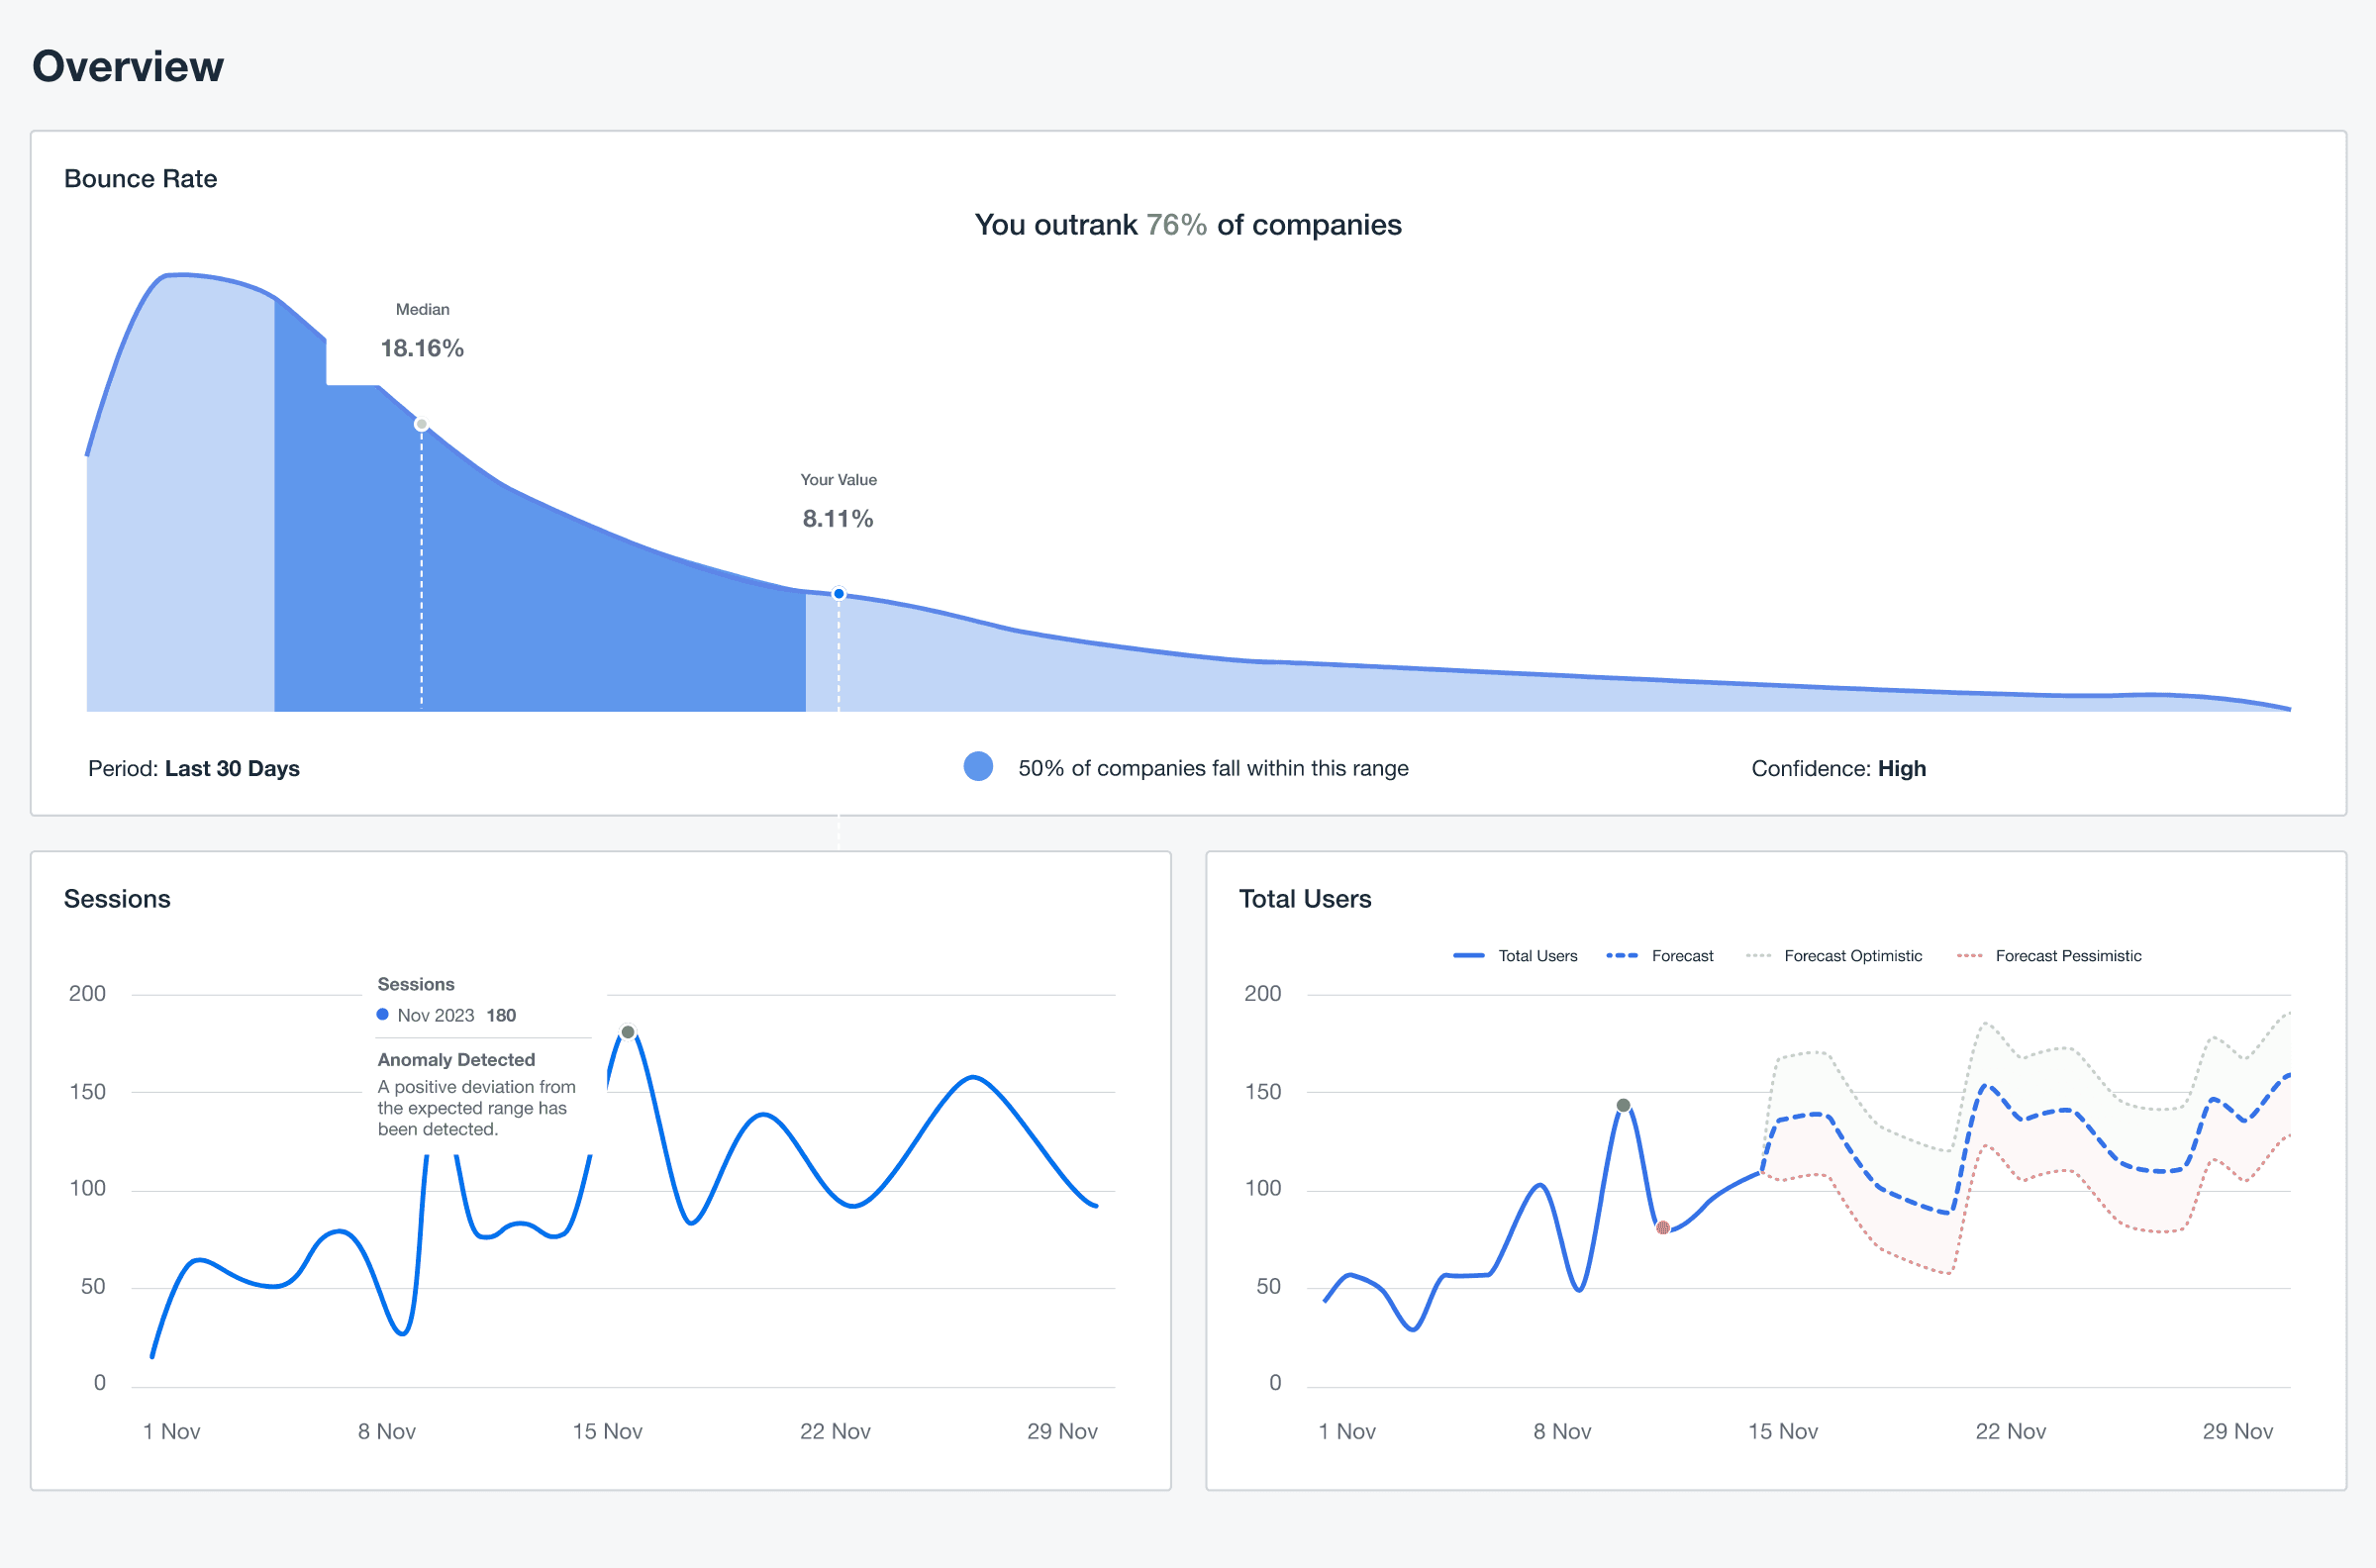
Wondering how your client’s performance compares to industry peers? Eliminate second guesses and lean on reliable industry benchmarks. Check out Marketing Performance Insights in AgencyAnalytics, free for 14 days.
Debunking Common Myths About Industry Benchmarks
Benchmarks are powerful tools, but their purpose and use cases are often misunderstood. Here are a few things to watch out for:
Myth #1: Benchmarks Are Fixed Goals: It’s tempting to view benchmarks as rigid targets, but they’re not. Instead, think of them as reference points to assess performance. For instance, a CTR below the benchmark may still signal success if the campaign reaches a niche B2B audience with high conversion rates.
Myth #2: Benchmarks Apply Universally: Benchmarks for LinkedIn Ads differ significantly by industry, audience, and campaign objectives. For a more accurate picture, always align benchmarks with your client’s vertical and goals.
Myth #3: Benchmarks Replace Campaign-Specific Metrics: While benchmarks are helpful, they don’t replace campaign-specific metrics. A high CTR might look great compared to benchmarks. However, if it doesn’t translate to meaningful leads or conversions, the campaign’s true effectiveness is questionable.
Understanding these nuances ensures benchmarks become a tool for smarter, informed decision-making.
How Agencies Use Key Benchmarks To Improve Campaigns
Benchmarks are more than numbers; they’re a way to ensure targets are on the right track. More specifically, they’re used to:
Set Clear Expectations: Realistic benchmarks help your agency explain what’s achievable and avoid overpromising to clients.
Spot Opportunities: Compare campaign results to benchmarks to highlight areas for improvement (e.g., using more relevant ad content or messaging).
Prove Value: By outperforming benchmarks, you’ll demonstrate success and assure clients that their digital marketing campaigns are in good hands.
Additionally, use a tool like AgencyAnalytics to track these dynamic goals and keep an eye on key benchmarks–all in one place.
That way, you’ll be equipped to make course corrections if campaigns aren’t performing the way they should.
Help your clients make solid, data-driven decisions. Monitor conversion metrics, cost per lead, and other marketing insights–explore AgencyAnalytics today, free for 14 days.
What Makes AgencyAnalytics Benchmarks Different
Not all benchmarks are created equally.
AgencyAnalytics benchmarks are built specifically from first-party data collected across 7,000+ agencies and 150,000+ campaigns. This makes our benchmarks far more relevant than generic averages from mixed or irrelevant sources.
They’re also segmented by industry, so agencies can compare client results to industry-specific data. Confidently assess performance and show clients how their campaigns measure up against real-world standards—not inflated or irrelevant averages.
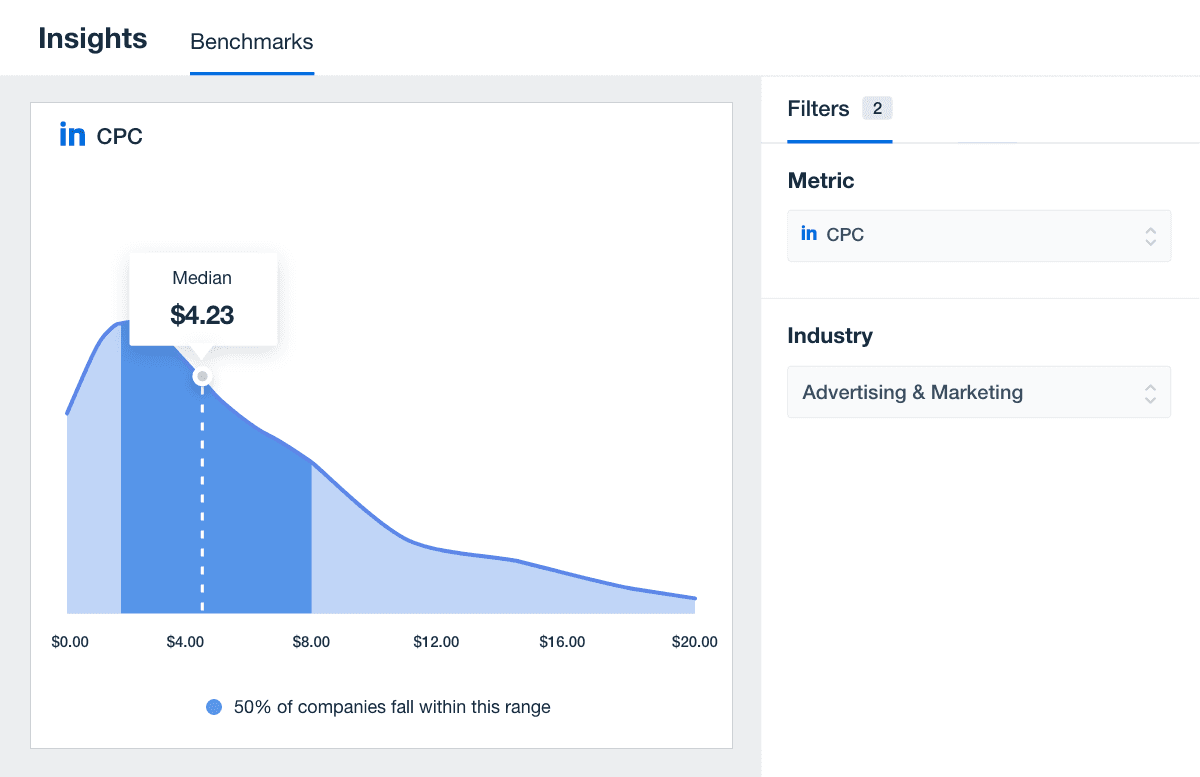
LinkedIn Ads Benchmarks for 2025
In this section, we break down key LinkedIn Ads benchmarks, using data from 150,000+ campaigns across the AgencyAnalytics platform.
Average Number of Engagements
The median number of engagements for LinkedIn Ads comes in at 281 across all industries. This suggests that LinkedIn’s professional audience is actively engaging with ads, which makes it even more important to create relevant sponsored content.
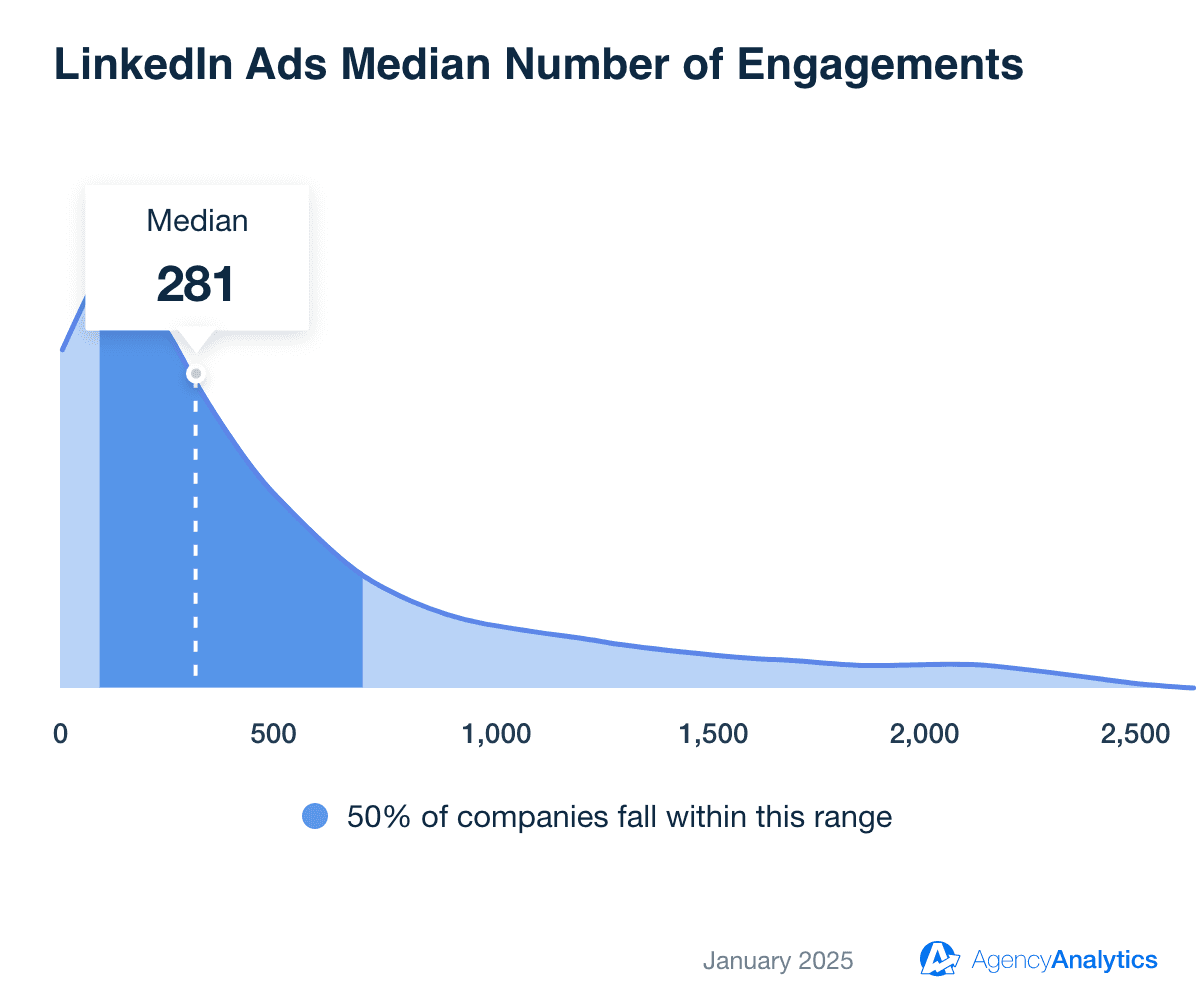
Finance & Insurance leads with the highest median engagement of 393. This could stem from ads that address financial planning, investment opportunities, or industry-specific pain points. For best results, monitor which topics are driving engagement and attracting the most attention.
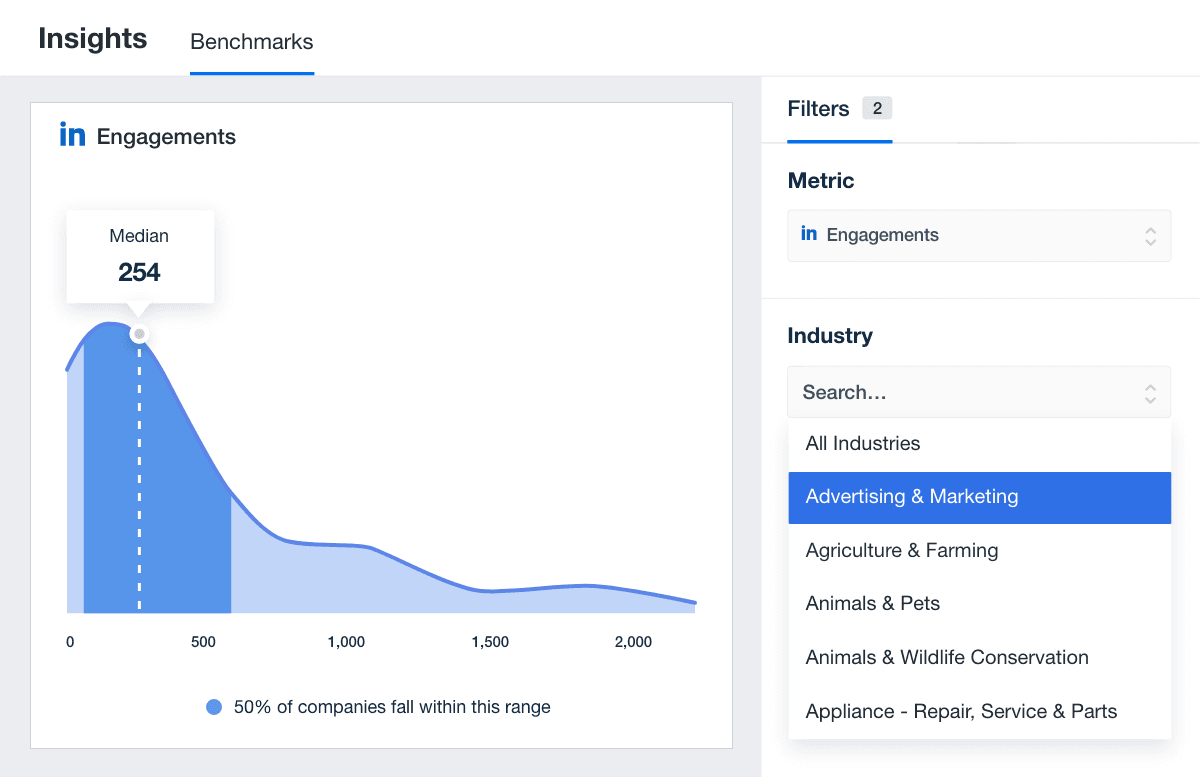
Conversely, Advertising & Marketing reports the lowest median engagement at 254. This could indicate higher competition within that sector, where audiences are often saturated with similar messaging and ads.
Average Number of Engagements by Industry
Industry | Median LinkedIn Ads Engagements by Industry |
|---|---|
Advertising & Marketing | 254 |
Business Services | 343 |
Education | 348 |
Finance & Insurance | 393 |
Health & Fitness | 373 |
Average Click-through Rate (CTR)
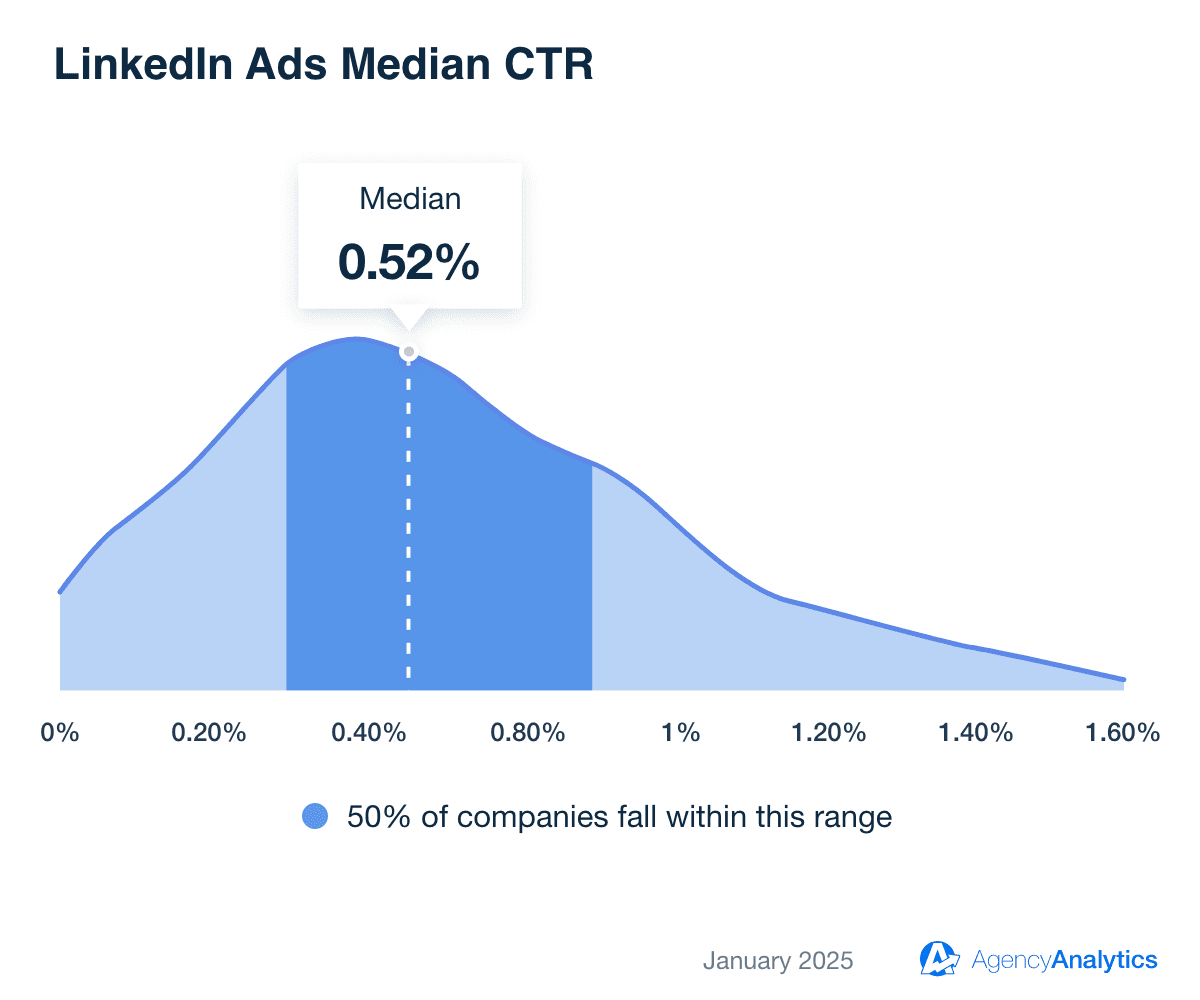
The median click-through rate (CTR) for LinkedIn ads averages 0.52% across industries, offering a baseline for assessing engagement and audience interest.
Finance & Insurance leads the pack with a slightly higher CTR (0.56%). This industry also has the lowest CPC (which we’ll touch on soon), suggesting that LinkedIn Ads may be a highly cost-effective advertising solution.
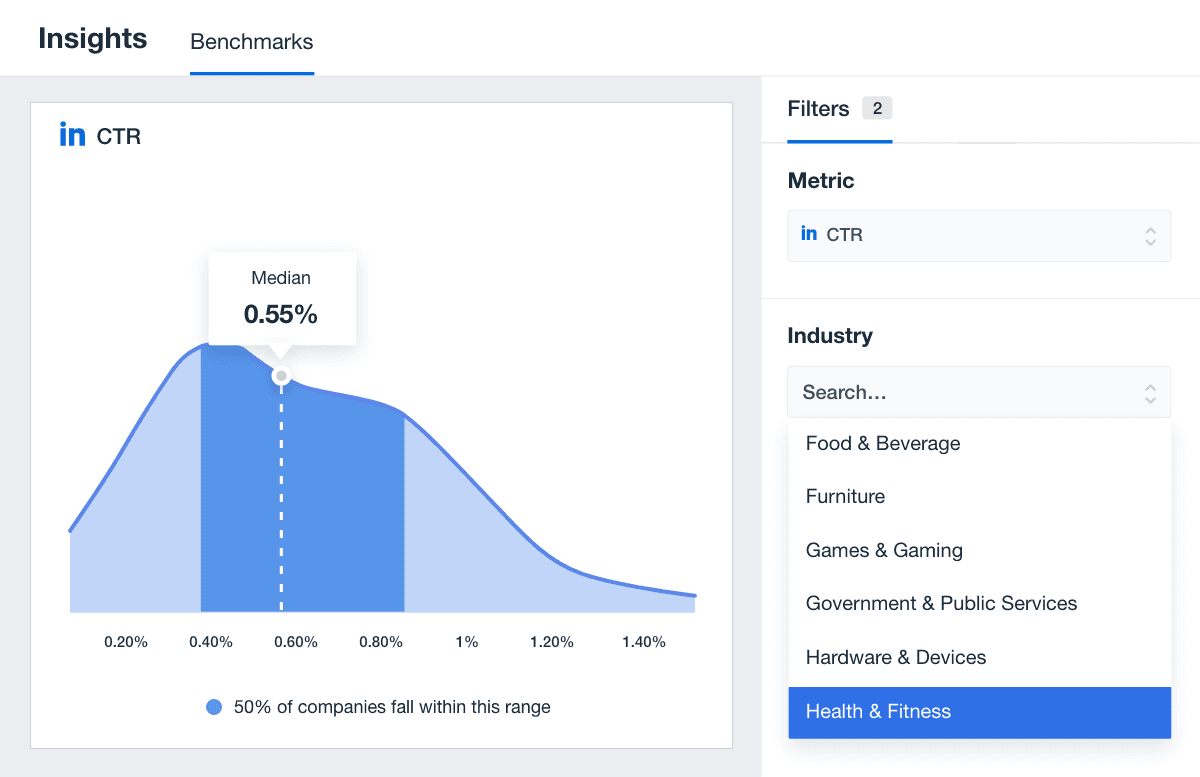
In contrast, both the Advertising & Marketing and Business Services sectors have marginally lower CTRs (0.53%). While the difference is small, it may reflect more competitive industries where advertisers must put extra effort into capturing audience interest.
Average Click-through Rate (CTR) Benchmarks by Industry
Industry | Median LinkedIn Ads CTR by Industry |
|---|---|
Advertising & Marketing | 0.53% |
Business Services | 0.53% |
Finance & Insurance | 0.56% |
Health & Fitness | 0.55% |
Average Cost
The median cost for LinkedIn Ads is approximately $701.50, indicating a fairly healthy ad budget across industries. That said, there are some variances to account for, as costs range from $715.27 to $992.46.
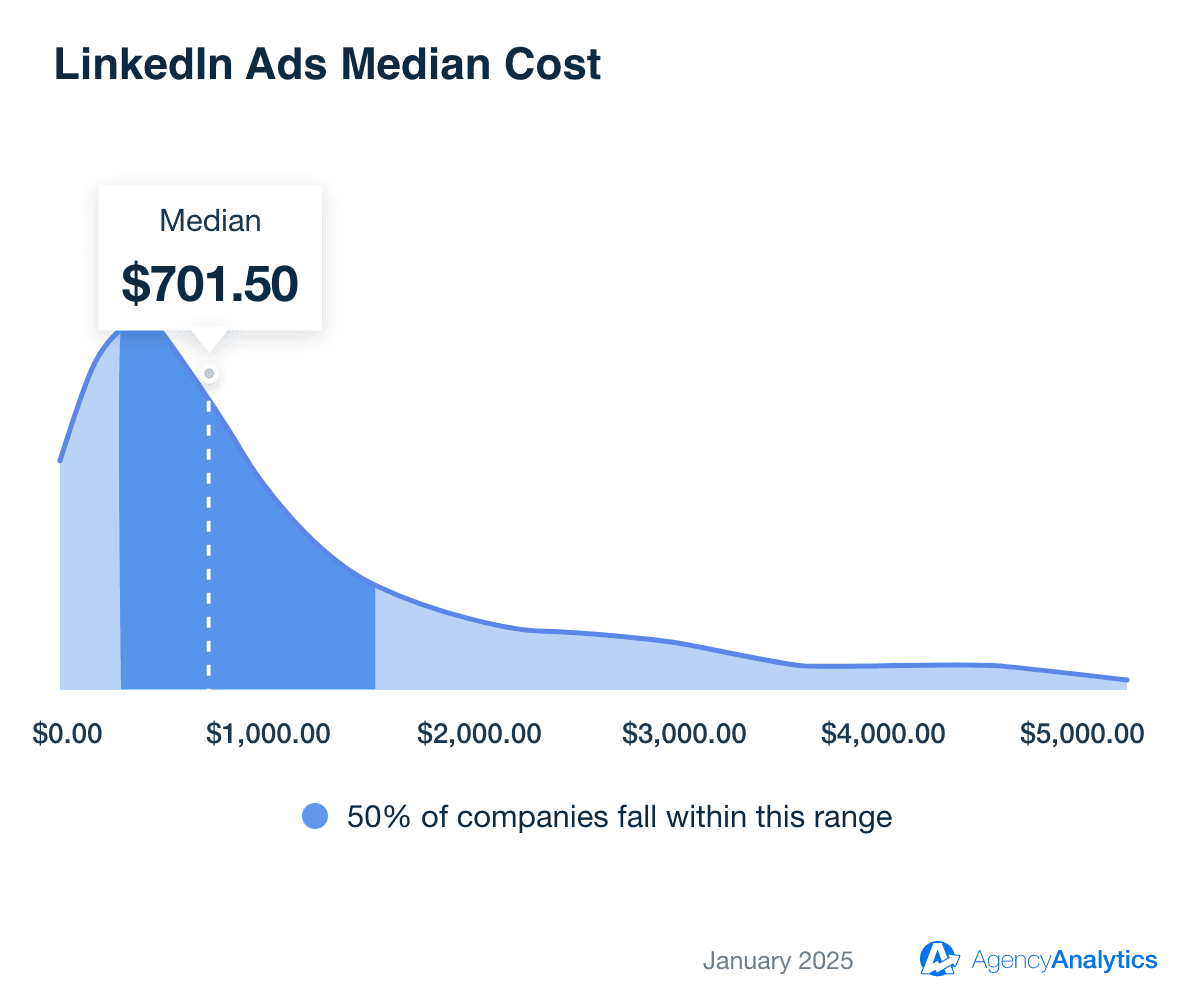
Health & Fitness has the highest median cost at $992.46, which suggests strong ad competition and a highly valuable audience.
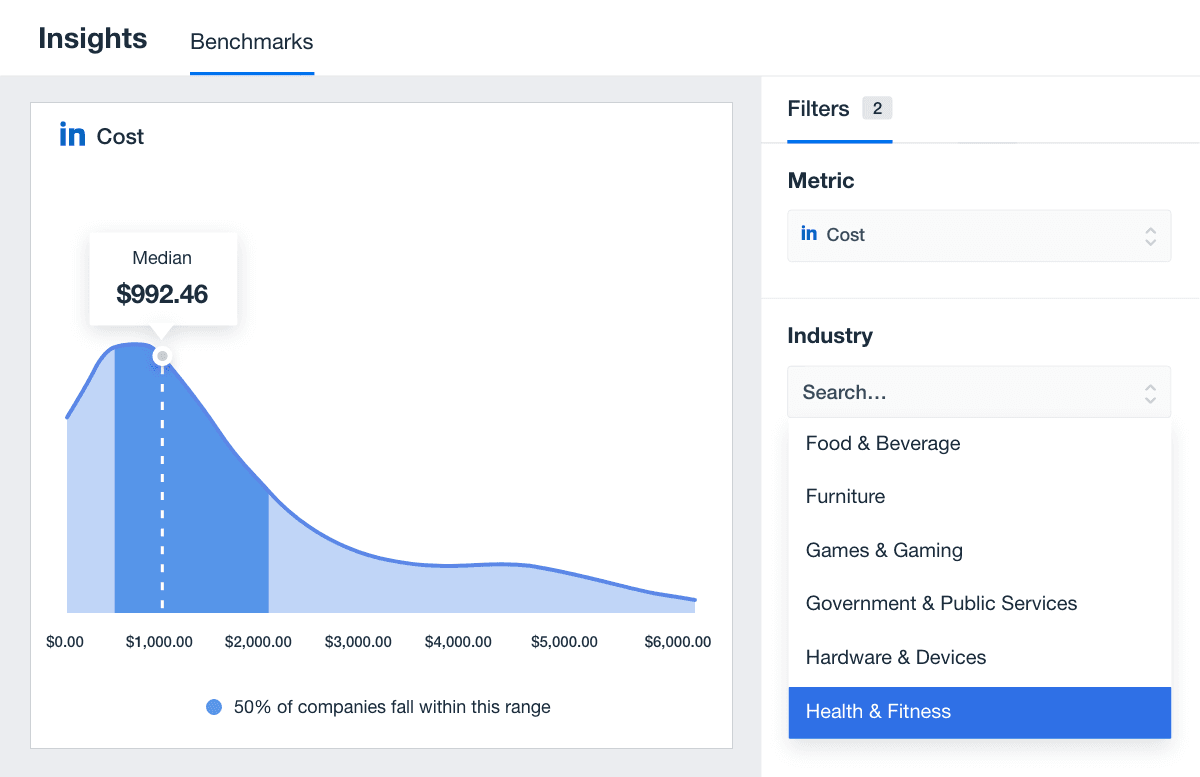
On the flip side, Advertising & Marketing has the lowest median cost at $715.27. That said, it’s still a significant spend, suggesting that LinkedIn Ads is a worthwhile investment for this sector.
Average Cost by Industry
Industry | Median LinkedIn Ads Cost by Industry |
|---|---|
Advertising & Marketing | $715.27 |
Business Services | $785.22 |
Education | $829.00 |
Finance & Insurance | $787.07 |
Health & Fitness | $992.46 |
Average Cost Per Click (CPC)
The median CPC for LinkedIn ads averages around $3.94 across industries, with some notable variations across industries.
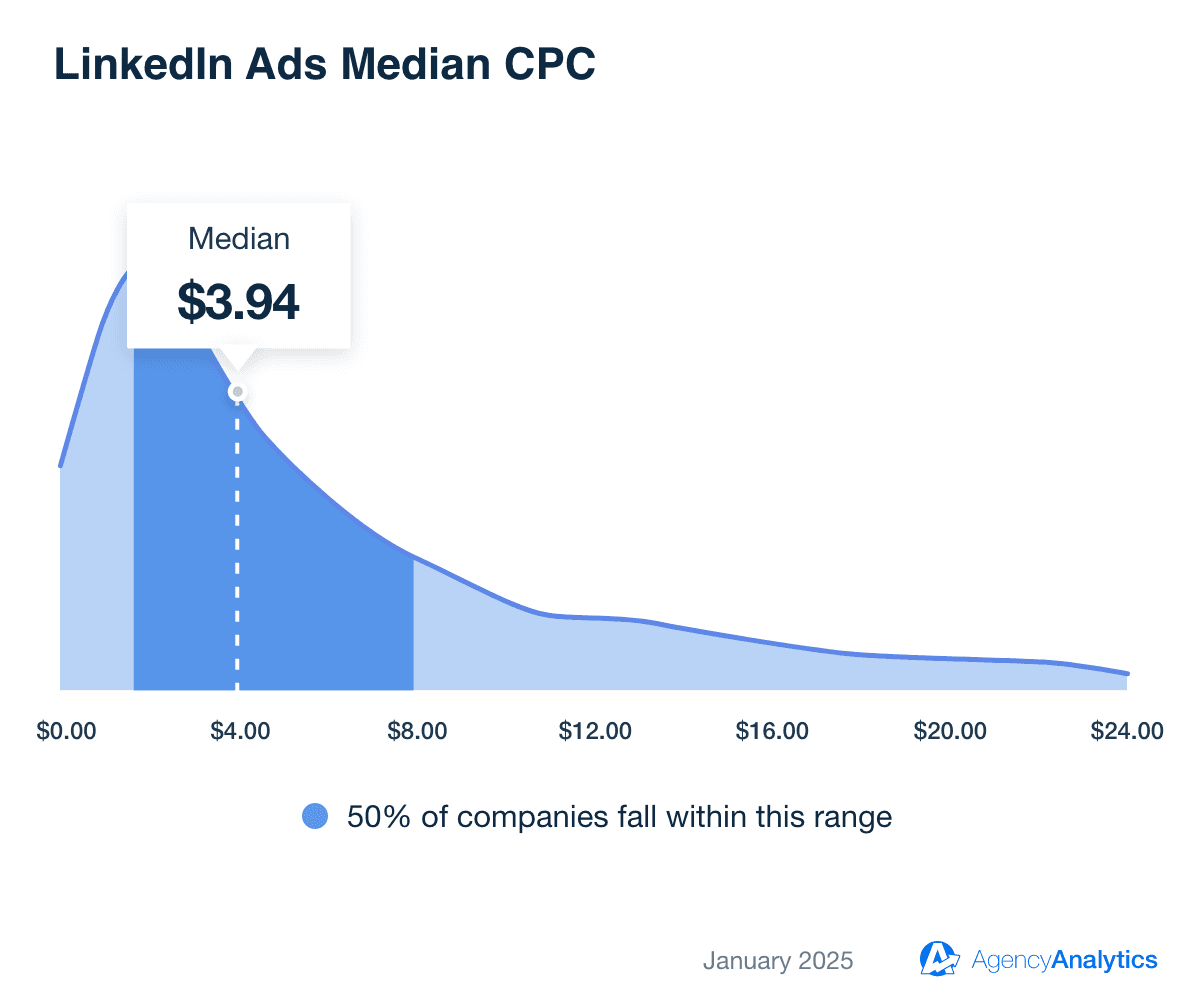
For instance, Software & Applications has the highest median CPC ($8.04). It suggests that advertisers should be willing to pay a premium for quality leads, especially if they have significant revenue potential.
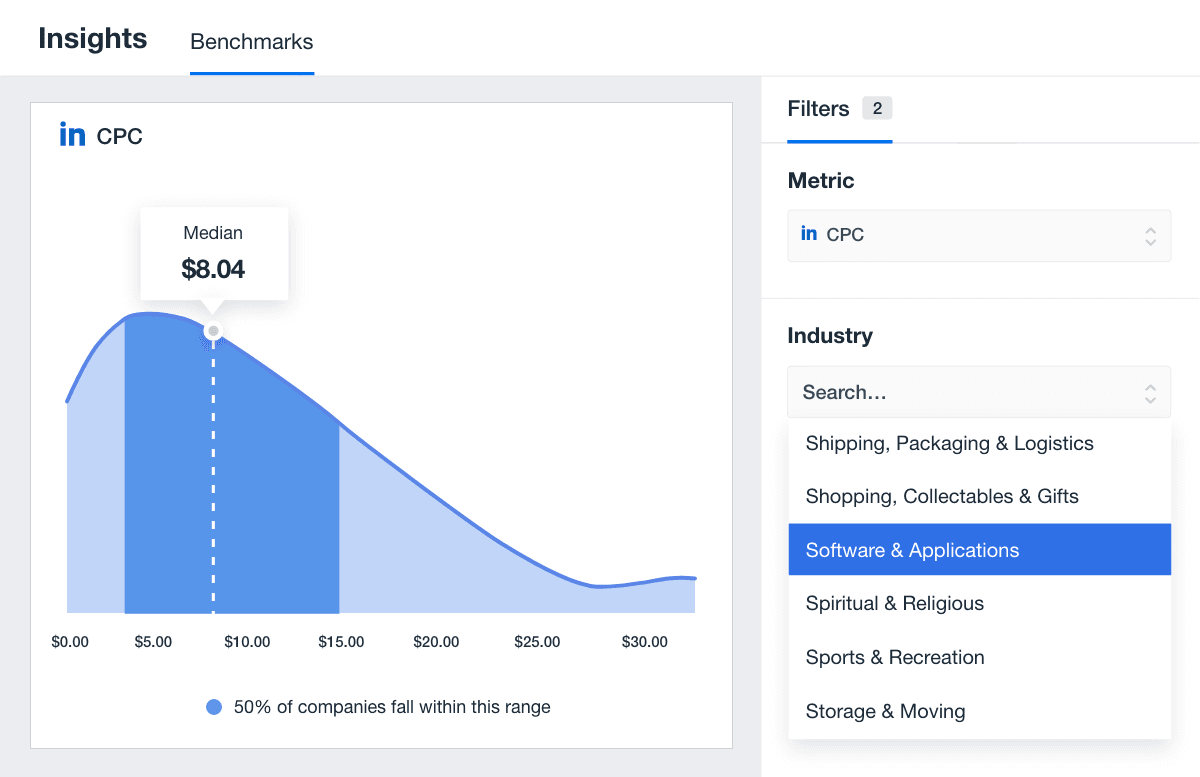
In contrast, the median CPC for Finance & Insurance sits at $2.59, implying that there’s less competition in this vertical. This is likely due to a narrower pool of advertisers targeting similar audiences. It may also signal an opportunity to reach high-value leads at a lower cost.
Average Cost Per Click (CPC) by Industry
Industry | Median LinkedIn CPC by Industry |
|---|---|
Advertising & Marketing | $4.77 |
Business Services | $4.73 |
Education | $3.11 |
Finance & Insurance | $2.59 |
Health & Fitness | $3.87 |
Software & Applications | $8.04 |
How To Interpret LinkedIn Ads Benchmarks
Benchmarks are certainly useful for assessing big-picture performance (don’t get us wrong). Here’s the kicker, though: A number above or below the benchmark doesn’t automatically mean success or failure.
Instead, benchmarks serve as reference points to evaluate performance within a specific context–here’s some food for thought.
When a Low CTR Isn’t Always Bad
A low click-through rate (CTR) might not always be a cause for concern. For instance, consider:
Niche Audiences: If your client’s campaign targets a highly specific or niche audience, lower engagement might reflect precision rather than underperformance.
High-Value Conversions: A campaign focused on generating high-value leads (e.g., B2B decision-makers) may naturally result in lower CTRs. Even if conversion rates are lower, the ROI may still make these efforts worthwhile.
Brand Awareness Campaigns: If your client is focused exclusively on brand awareness campaigns, they may prioritize visibility over immediate clicks.
In these cases, align the benchmark with the campaign's objectives. This will allow you to evaluate performance more accurately.
When More Engagement Might Signal Potential Problems
While a high number of engagements often feels like a win, it may sometimes indicate underlying issues. Consider the following scenarios:
Negative Sentiment Driving Engagement: High engagement levels might stem from negative comments, complaints, or backlash against a campaign or brand post.
Mismatched Audience Targeting: If a post generates a high number of engagements but fails to convert into meaningful actions (e.g., increased lead gen forms), it could signal that the content isn’t reaching a relevant audience.
Clickbait or Misleading Content: Content with sensational headlines or claims may spike engagement. However, if audiences feel deceived, it may erode trust and lead to a compromised LinkedIn presence.
Each scenario underscores the importance of analyzing the big picture, ensuring it delivers real value.
Using Benchmarks To Identify Opportunities for Optimization
Benchmarks highlight where campaigns excel and where improvements are needed. For example:
CTR Below Benchmark: If this happens, test various ad formats or refine targeting to improve ad engagement. For example, you may find that message ads work better than video content for lead generation.
CPC Above Benchmark: This could lead to ineffective ad spend or increased costs. To address it, adjust bidding strategies or explore an ad type that leads to greater cost efficiency.
Engagement Below Benchmark: In this scenario, consider experimenting with different ad formats (e.g., using video ads or carousel ads over single-image ads). It may also be helpful to use more catchy imagery and improve the overall ad quality.
Use benchmarks to pinpoint inefficiencies, assess areas for improvement, and prioritize changes that will have the greatest impact.
Using Benchmarks to Position Your Marketing Agency
Leveraging LinkedIn Ads benchmarks is a powerful way for agencies to build trust and assert their expertise.
By showing how campaigns measure up against industry trends, you’ll provide tangible value–all while demonstrating a deep understanding of what drives results. Doing so also educates clients on the bigger picture, showing how they stack up against peers.
Use these insights to highlight wins, identify opportunities for growth, and foster greater transparency. The result? Stronger client relationships, heightened credibility, and more fruitful marketing efforts.

Written by
Faryal Khan is a multidisciplinary creative with 10+ years of experience in marketing and communications. Drawing on her background in statistics and psychology, she fuses storytelling with data to craft narratives that both inform and inspire.
Read more posts by Faryal KhanSee how 7,000+ marketing agencies help clients win
Free 14-day trial. No credit card required.


