Use analytics presentation mode to clearly showcase client data during meetings
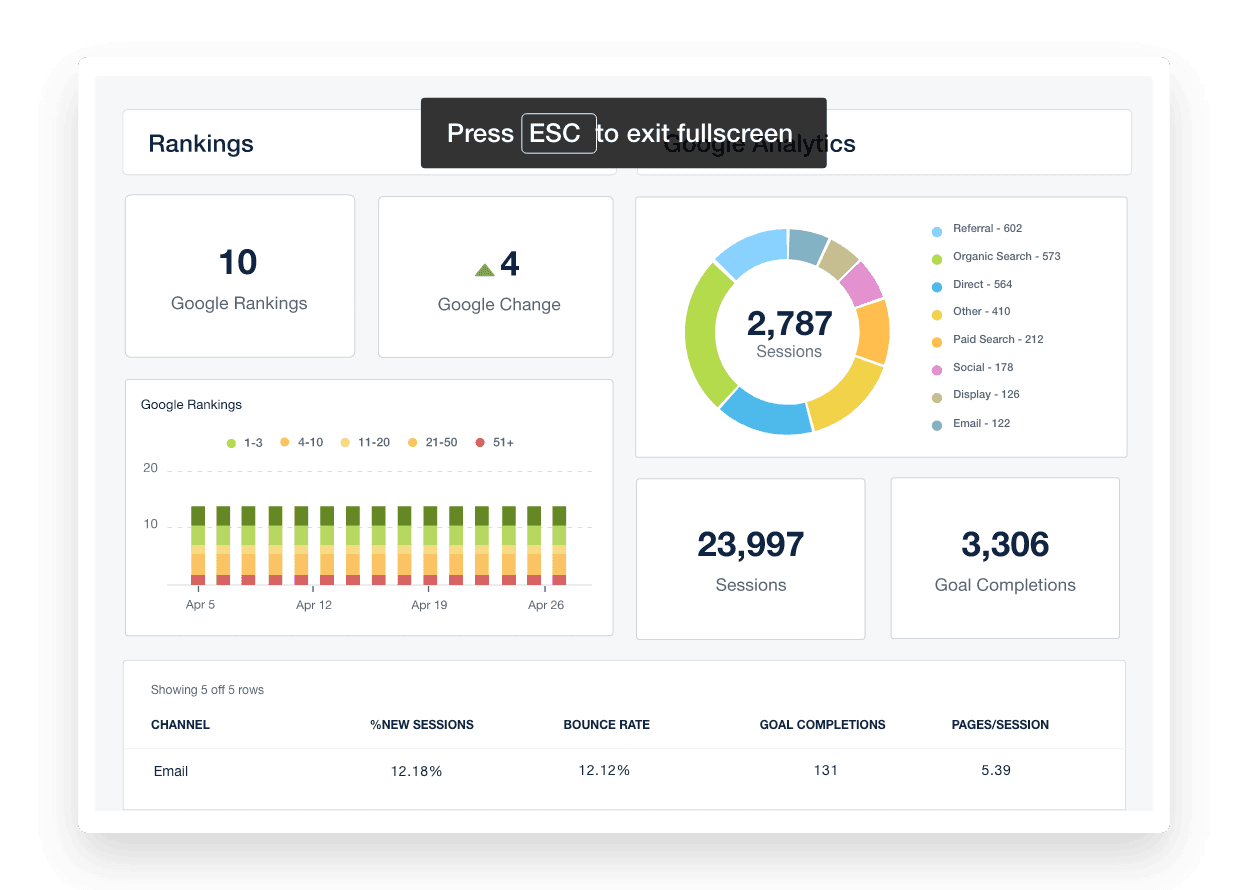
Make every client presentation clear, confident, and impactful
Lead focused, interactive conversations with a full-screen view that eliminates distractions and highlights marketing campaign results. Whether you’re walking clients through real-time dashboards or presenting a polished summary, it’s all about showcasing your marketing agency’s value—without the clutter.
Lead With Clarity
Present marketing dashboards in a full-screen view that keeps attention on results
Drive Better Conversations
Walk clients through marketing metrics and answer questions in real time
Share Performance Wins
Highlight marketing campaign impact with slide-style visuals made for client reporting
Focus On What Matters
Eliminate distractions so your marketing agency’s insights stay front and center
Design Impactful Client Presentations in Minutes
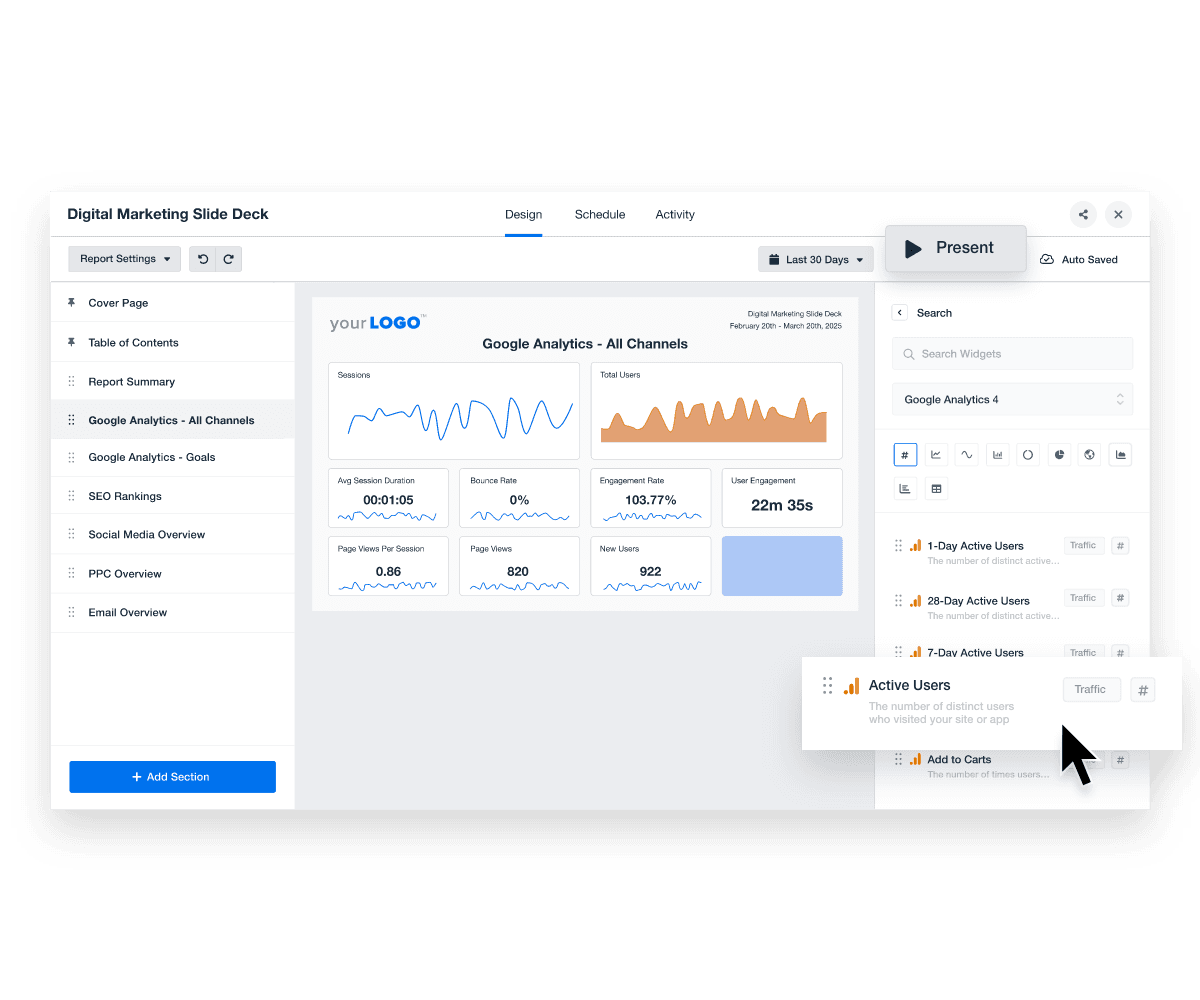
Transform your client's marketing data into sleek, professional slide decks that are ready to present in just minutes using AgencyAnalytics' report builder. Create engaging slides that distill complex data and highlight crucial trends and performance insights.
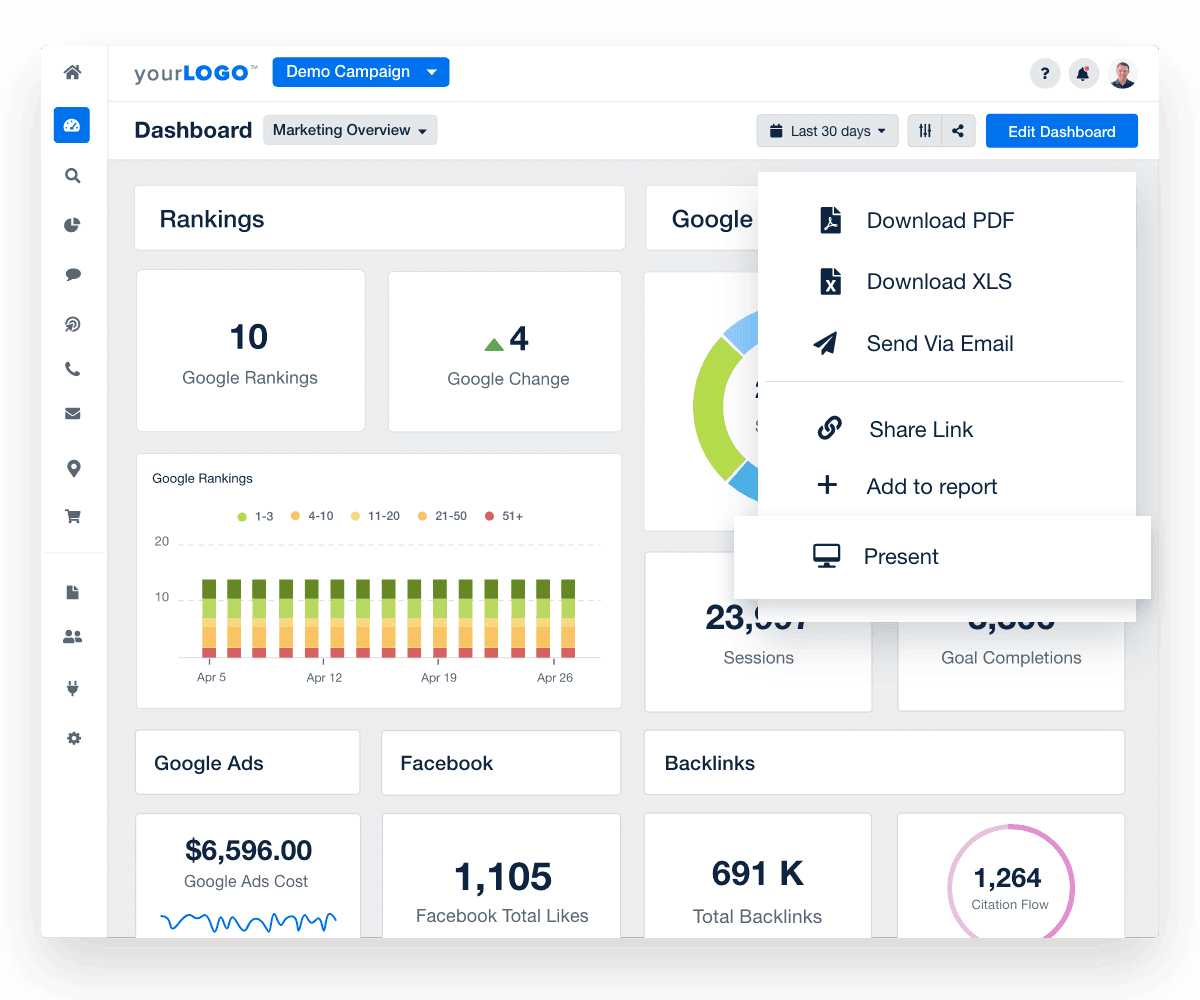
Just click "Present" to activate your dynamic report presentation. With the capability for quick updates, your presentations always maintain accuracy, relevance, and impact.
Elevate Your Marketing Data Presentations to Full-Screen Glory
Keep clients focused on the metrics that matter. Presentation Mode removes clutter so you can display marketing dashboards full screen, highlight key results, and guide strategic conversations without toggling or tab overload. Whether in a meeting or screen share, deliver a polished, data-driven experience every time.
Highlight Marketing Performance Where It Matters Most
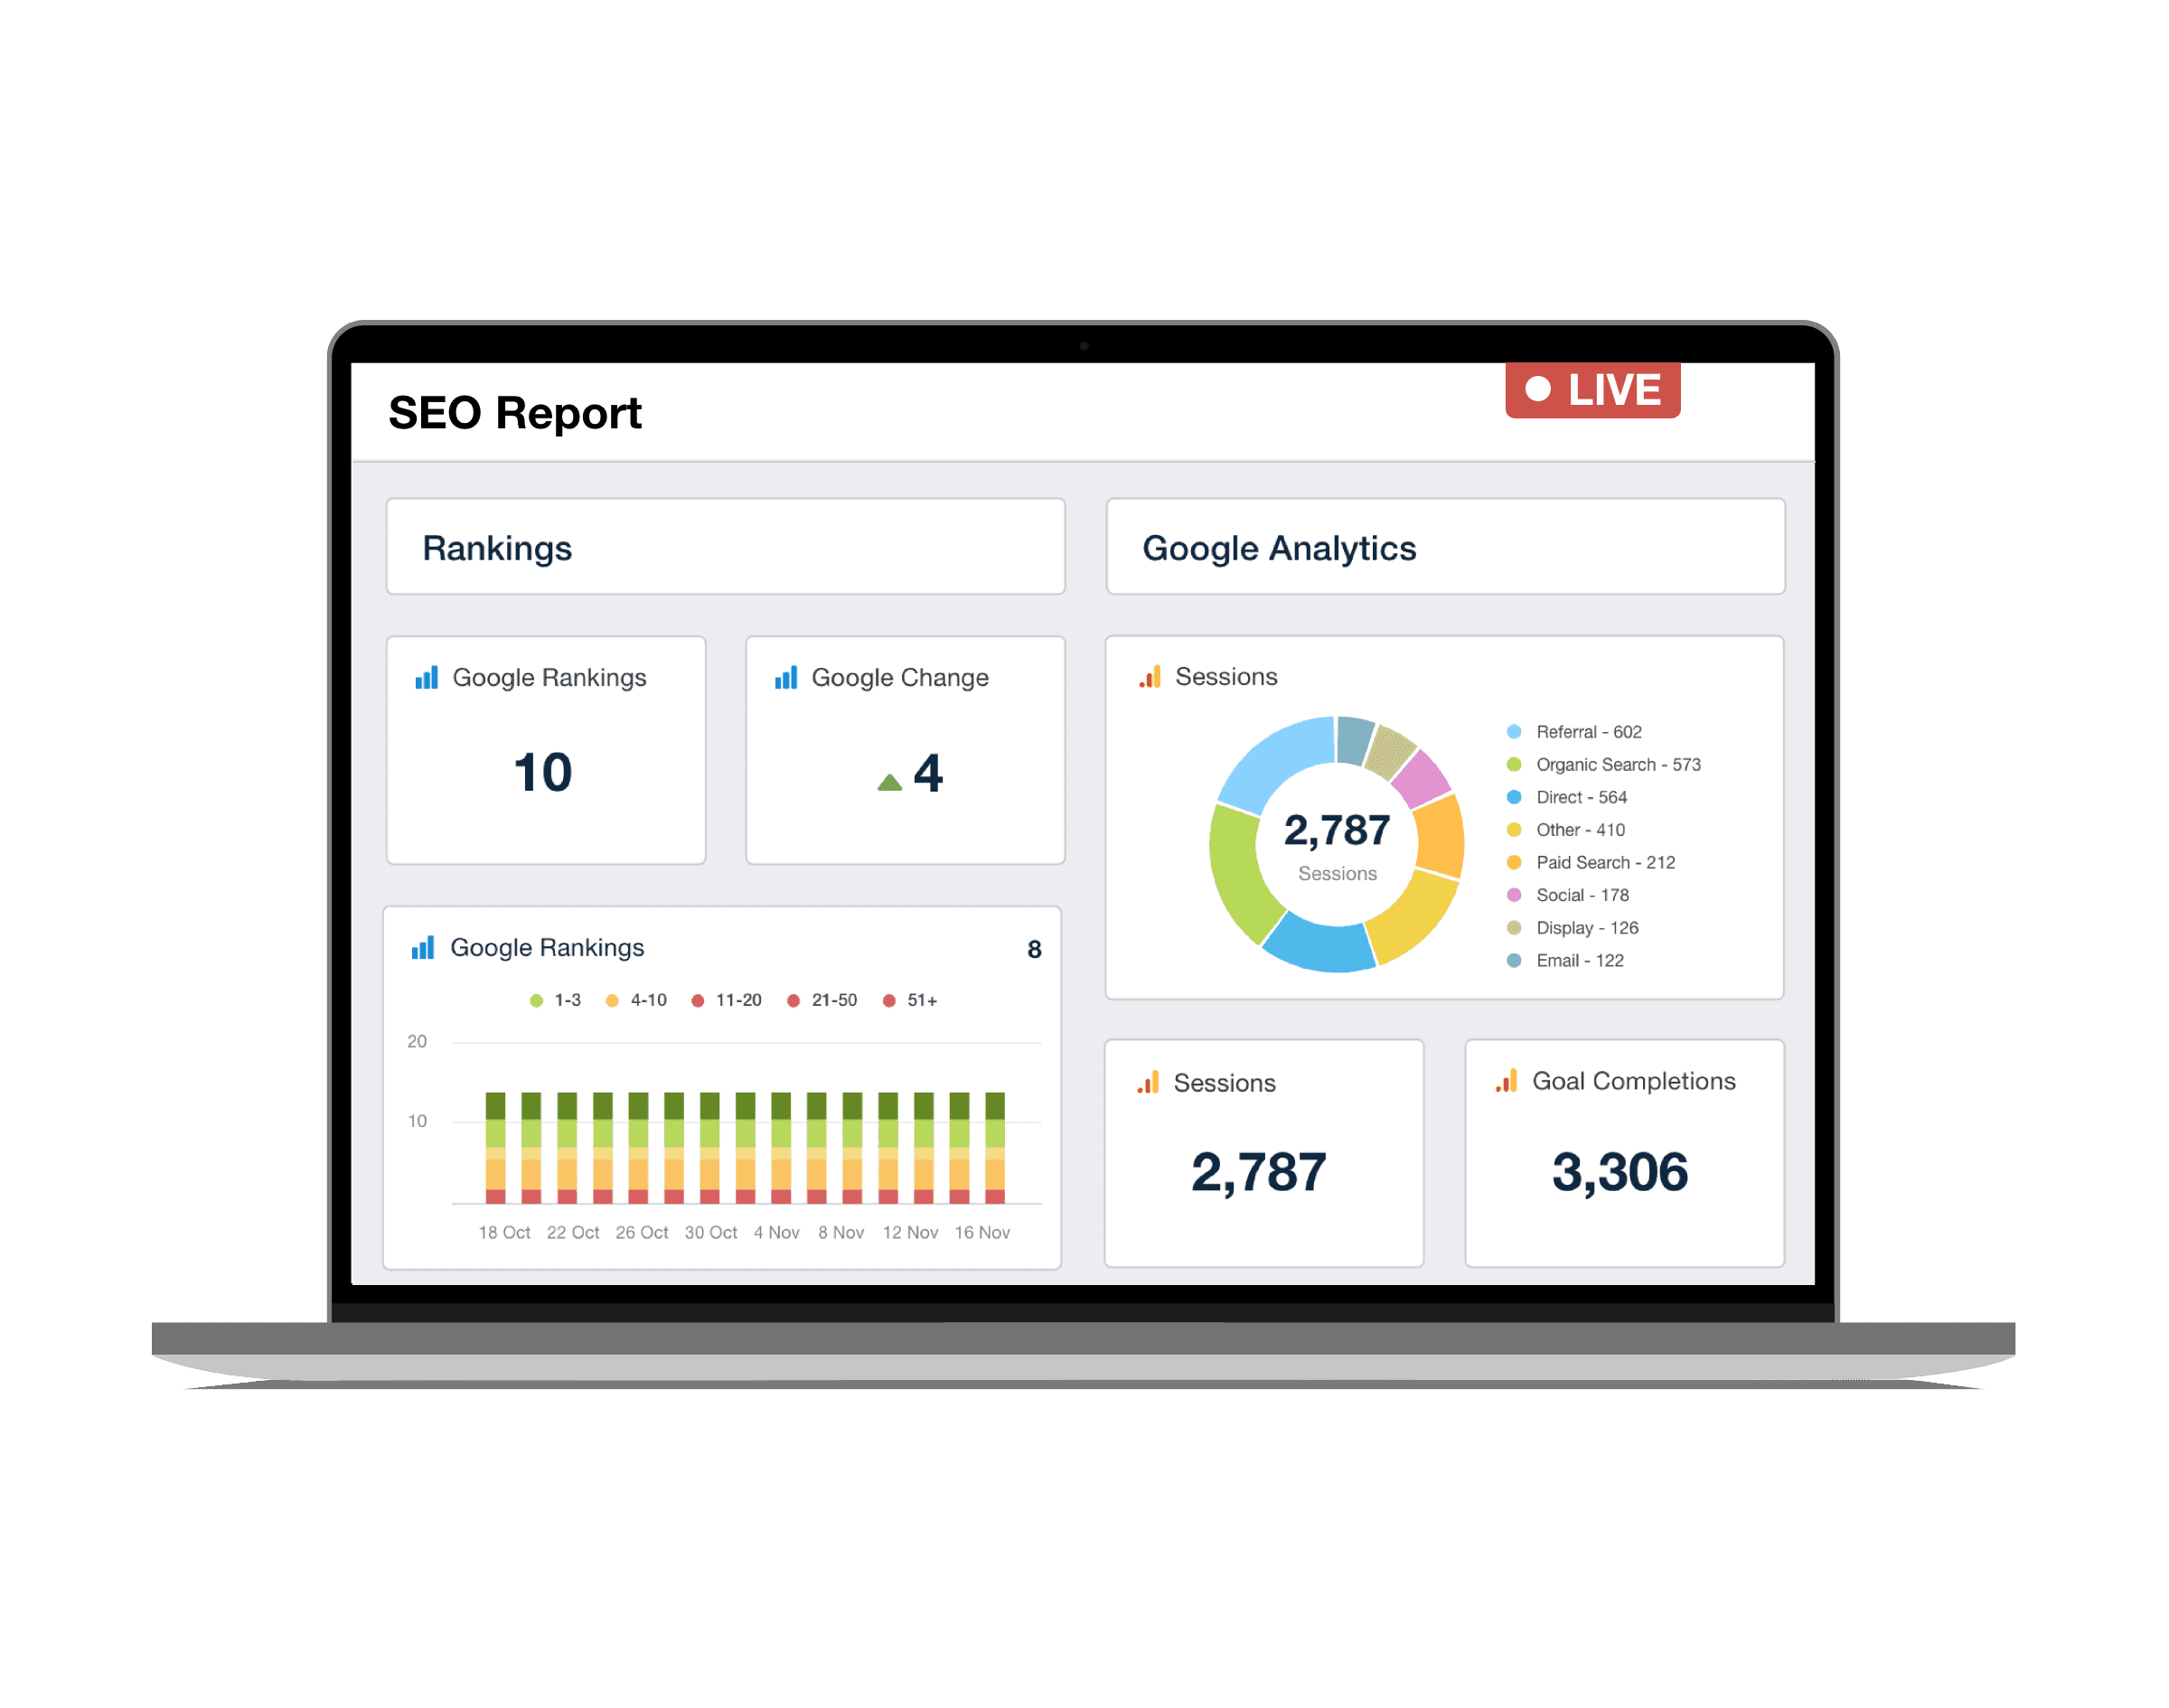
Use Presentation Mode to display live marketing dashboards on office monitors or during client meetings. Whether you're sharing KPIs with your team or walking a client through results, this full-screen view keeps everyone focused on the metrics that matter—without distractions.
Professional, real-time reporting shows clients exactly where campaigns stand and reinforces your marketing agency’s value with every conversation.
FAQs About Data Analysis Presentation Mode
Want to turn client reports into engaging presentations? These FAQs explain how to transform data analysis dashboards into live analytics presentations, showcase key findings with visual cues, and keep relevant data front and center—without switching between multiple tools.
An analytics presentation is a structured way to share data analysis and key findings with clients or team members. In AgencyAnalytics, presentation mode transforms live dashboards into a client-friendly format, making it easy to walk through relevant data, highlight key points, and ensure the report’s objectives are clear.
With AgencyAnalytics, creating a client-ready presentation takes minutes, not hours. Simply choose the dashboard or report you want to share, arrange your slides to tell a clear story, then switch to presentation mode. Because the data is live, it's easy to highlight trends, address questions on the spot, and guide the conversation toward decisions that matter—without the back-and-forth of manually updating PowerPoint slides.
With AgencyAnalytics, analytics presentations are powered by live data analysis—no manual updates or copying into other tools. Your visualizations, metrics, and key findings update automatically, ensuring your audience sees accurate, relevant data. Unlike static formats such as a Google Slides file or a PowerPoint template, it's easy to drill into data sources during the meeting for up-to-date insights on the spot.
The best data visualization depends on your audience and the story your data analytics is telling. Use pie charts to show proportions, line graphs to display trends over time, and bar charts for comparing categories. Add bullet points to summarize key points and use other elements like color coding to guide attention to the most important insights.
AgencyAnalytics includes presentation mode with plans starting at $59. This gives agencies a built-in way to present data analysis without using separate software like PowerPoint, Google Slides, or other analytics presentation platforms, while keeping all the data sources and visual cues in one place.
More features

Drag and Drop Report Builder

PPC Markup

Embeddable Content

Language Options

Custom Marketing Dashboards
Goal and Budget Tracking
See how 7,100+ marketing agencies help clients win
Free 14-day trial. No credit card required.


