Table of Contents
Table of Contents
7,000+ agencies have ditched manual reports. You can too.
Free 14-Day TrialYou’re running paid campaigns, and the clock’s always ticking. Your clients want proof their dollars are working. You want to cut through the fluff and see the real return—fast.
Whether you’re managing Google Ads, Facebook campaigns, or multi-channel strategies, return on ad spend (ROAS)—much like social media ROI—tells you whether your ad dollars are actually driving value.
That’s where this free ROAS calculator comes in. No spreadsheets. No guesswork. Just enter your numbers and see exactly how your campaigns are performing—right now.
And because we know agency life doesn’t stop at one metric, we’ll also break down:
How ROAS works (and why it matters)
The exact ROAS formula
What counts as a “good” ROAS by platform
How to level up your ad reporting process
Calculate Your ROAS
Use the calculator below to instantly measure your return on ad spend (ROAS) and see how well your client’s advertising budget is performing. Just enter your total revenue from ads and total ad spend.
Your ROAS is: $0.00
Not sure what the number means? Keep scrolling. We’ll show you how to interpret it and improve your results.
What Is ROAS (Return On Ad Spend)?
ROAS helps you evaluate the financial performance of any online advertising campaign, from retargeting ads to awareness pushes.
The concept is straightforward: How many dollars does your client get back in return for every dollar of advertising spend?
What Is the ROAS Formula?
ROAS is calculated by dividing the return on advertising by the ad spend. The result is your ROAS ratio. It pairs well with other key metrics like cost per reach for a fuller picture of campaign efficiency.

Agency Advice: Not sure what ad spend means? The ad spend formula consists of adding up the total cost of everything you spend to run your client’s ads, including media buys (e.g., Google Ads or Facebook impressions), creative production costs, and platform tools or tech fees.
Example ROAS Calculation
Let’s say your client’s ad campaign generates $25,000 in revenue, and the advertising cost was $5,000 to achieve it. Your client’s ROAS is 5, which means they’ve earned $5 for every dollar spent.

The same formula applies whether you’re running Google Ads, Facebook Ads, etc., for your client.
A higher ROAS metric usually means better efficiency, but the “right” ROAS depends on your business model, margins, and goals. For some, a ROAS of 3 is great. For others, anything under 10 isn’t worth the effort. Your actual benchmark depends on your margins—start with your gross profits formula.
ROAS helps you cut through vanity metrics and zero-in on what really matters: profitability.
Take Your Ad Reporting to the Next Level
Knowing how to calculate ROAS is just the start. The real value comes when you track it across every campaign, share it with clients in seconds, and use it to guide smart decisions.
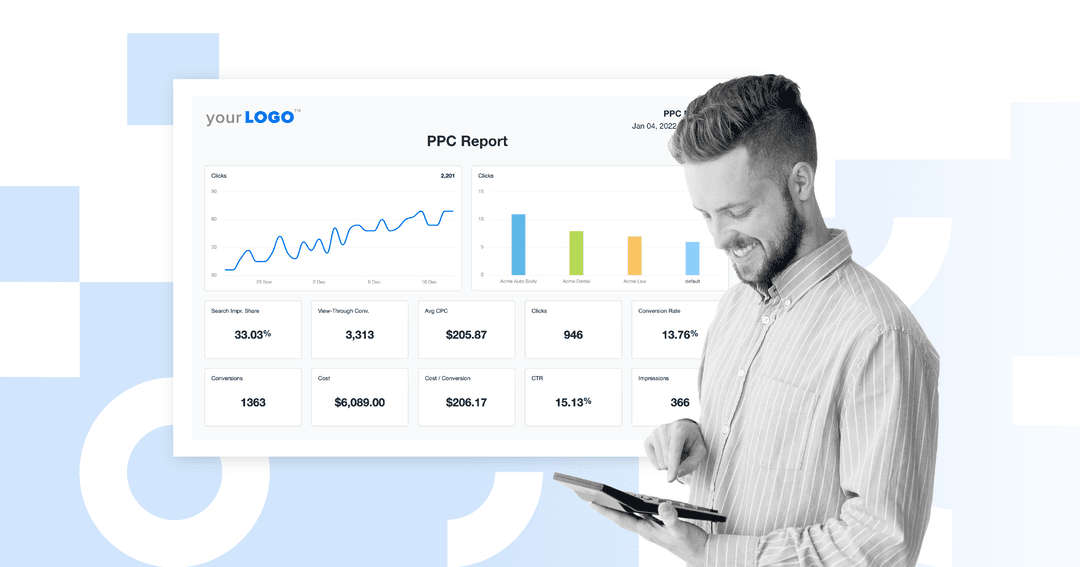
If you’re still copying data into spreadsheets, manually updating client reports, or juggling five different platforms to get a clear picture, you’re wasting time that could be spent on strategy and growing your client’s business.
AgencyAnalytics brings all your ad data together on one dashboard:
Create custom metrics to track ROAS across ad platforms like Google Ads, Facebook, TikTok, and more.
Automatically update client reports every month.
Highlight top-performing campaigns and explain what’s working (and why).
Save hours every month on reporting alone.
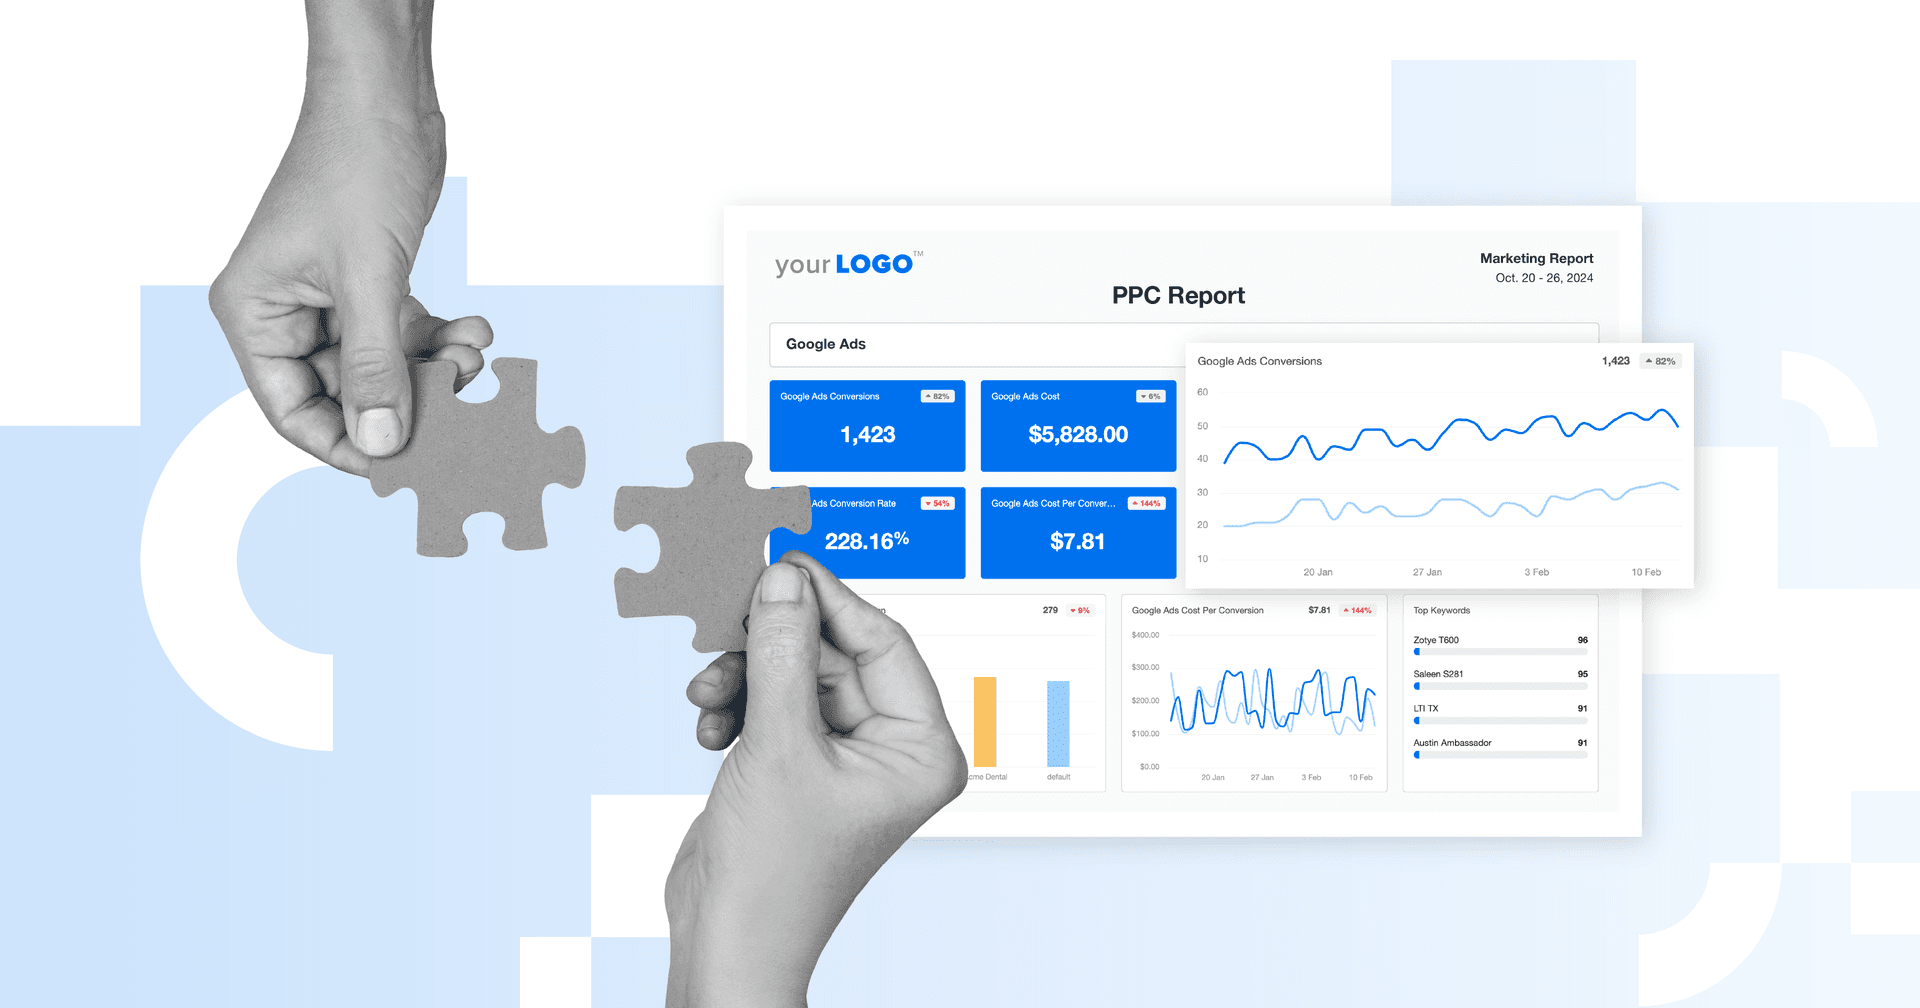
No more scrambling for numbers. No more last-minute screenshots. Just clean, professional reports that show clients their results. (And because ROAS is only one part of the performance puzzle, here are the most important PPC metrics to track alongside it.)
Want to spend less time on reports and more time scaling your agency (and improving your agency rates)? Don’t wait. Start your free AgencyAnalytics trial today!
Impress clients and save hours with custom, automated reporting.
Join 7,000+ agencies that create reports in minutes instead of hours using AgencyAnalytics. Get started for free. No credit card required.
FAQs About Calculating ROAS
Still have questions about calculating ROAS? Don’t worry—we’ve got you covered.
Break-even ROAS (BEROAS) is the point where ad revenue exactly covers the costs. Your client’s not losing money, but they’re not making any, either. To calculate it, divide 1 by the profit margin. For example, if your margin is 25%, the break-even ROAS is 4. This number helps you know the minimum return your campaigns need to avoid a loss.
A good ROAS for ecommerce typically falls between 3 and 4, meaning $3 to $4 is earned for every dollar spent. But the “right” ROAS depends on the margins, product pricing, business goals, and customer lifetime value. Lower margins require a higher ROAS to stay profitable, so always calculate the break-even point first. Also, acquiring customers with a high lifetime value may be worth sacrificing on the original ROAS.
A good ROAS for Google Ads usually ranges from 3 to 5. Search campaigns tend to generate higher returns than Display or YouTube. Also, a great ROAS varies by industry. Use historical data and margins to determine your true performance benchmark.
On Facebook, a good ROAS is typically between 2 and 4. Retargeting campaigns usually perform better than cold traffic. Creative, targeting, and ad type all impact performance. The key is knowing the cost structure and using that to define the ideal ROAS.
To measure ROAS, divide ad revenue by ad spend. To report it, use a platform like AgencyAnalytics to connect your data sources and track ROAS across all channels in one dashboard. Automate monthly reports, visualize campaign results and show clients exactly where they see a return.

Written by
Francois Marchand brings more than 20 years of experience in marketing, journalism, content production, and artificial intelligence (AI). His goal is to equip agency leaders with innovative strategies and actionable advice to succeed in digital marketing, SaaS, and ecommerce.
Read more posts by Francois MarchandSee how 7,000+ marketing agencies help clients win
Free 14-day trial. No credit card required.


