The 19 social media metrics to track for success in 2026


Table of Contents
- Key takeaways
- What are social media metrics?
- Social media metrics vs. KPIs (what’s the difference?)
- Why tracking social media metrics matters
- Vanity metrics vs. performance metrics
- The 19 most important social media metrics you need to track
- Awareness metrics
- Consideration metrics
- Traffic metrics
- Conversion metrics
- Advocacy metrics
- How to calculate social media ROI
- Why social media ROI is hard to measure
- How to measure social media ROI step by step
- How to prove social media ROI to clients and stakeholders
- What is a good social media ROI?
- Use social media benchmarks for context
- How to improve social media ROI
- The tools worth having in place
- Track and report social media metrics with AgencyAnalytics
- Frequently asked questions about social media ROI
7,000+ agencies have ditched manual reports. You can too.
Free 14-Day TrialTable of Contents
- Key takeaways
- What are social media metrics?
- Social media metrics vs. KPIs (what’s the difference?)
- Why tracking social media metrics matters
- Vanity metrics vs. performance metrics
- The 19 most important social media metrics you need to track
- Awareness metrics
- Consideration metrics
- Traffic metrics
- Conversion metrics
- Advocacy metrics
- How to calculate social media ROI
- Why social media ROI is hard to measure
- How to measure social media ROI step by step
- How to prove social media ROI to clients and stakeholders
- What is a good social media ROI?
- Use social media benchmarks for context
- How to improve social media ROI
- The tools worth having in place
- Track and report social media metrics with AgencyAnalytics
- Frequently asked questions about social media ROI
7,000+ agencies have ditched manual reports. You can too.
Free 14-Day Trial“The likes are great, but how much revenue did the campaign actually generate?”
If you run a marketing agency, you’ve heard that question more times than you can count. Every platform hands you dozens of numbers: impressions, reach, follower count, saves, watch time. The challenge is knowing which ones tie to client goals and which are noise. With social media marketing ranking among the top four services agencies offer, getting that judgement right is a competitive edge.

As budgets grow and senior leadership pushes for performance, tracking social media ROI becomes non-negotiable. This guide covers the 19 metrics worth tracking, the funnel stage each belongs to, how to calculate and prove ROI, and what good looks like against industry benchmarks.
Key takeaways
Metrics are the raw numbers; KPIs are the few tied to a client’s goals, so choose them from the goal backwards rather than from the platform forwards.
Map every metric to a funnel stage (awareness, consideration, traffic, conversion, advocacy) to see where users discover the brand and where they drop off.
Social media ROI is ((Revenue from social − Cost of social) ÷ Cost of social) × 100, and the cost side has to include staff time, content, and tools, not just ad spend.
Return isn’t always revenue: leads, brand awareness, and customer lifetime value can all be assigned estimated values so non-revenue campaigns still get a number.
Benchmarks only mean something in context, which makes the client’s own past performance and stated goals the strongest comparison.
What are social media metrics?
Social media metrics are data points that show how a client’s content is performing: impressions, clicks, shares, conversions. They give a real-time snapshot of what’s working and what needs adjustment, and they answer the questions clients care about:
Is our strategy actually working?
Are we reaching the right audience?
What’s driving engagement or conversions?
Is our budget being used effectively?
Sitting above all of them is social media ROI: the return your agency generates from social, compared to the cost of running those campaigns. For every dollar a client spends, how much value comes back? That value can be direct revenue, such as social commerce sales or booked calls, or harder to quantify, like brand mentions, audience growth, or customer satisfaction improvements.
Social media metrics vs. KPIs (what’s the difference?)
Metrics are the raw numbers. They track what’s happening on your client’s channels:
Likes, comments, and shares
Follower growth
Reach and impressions
Clicks and video views
They’re useful for understanding activity and trends, but on their own they don’t tell you if social is helping the business.
KPIs (Key Performance Indicators) are the metrics that matter most to your client’s goals. They’re tied directly to outcomes:
Leads generated from social
Conversion rate from social traffic
Cost per acquisition
Revenue influenced by social media
All KPIs are metrics, but not all metrics are KPIs. If a number doesn’t help you measure progress toward a specific goal, it’s just a metric. Choose KPIs that match what success actually looks like for your client.
Why tracking social media metrics matters
Use case | Why it matters |
|---|---|
Spot and solve performance issues | Social media metrics highlight sudden drops in engagement or spikes in bounce rate, which may point to issues with targeting, creative, or platform fit. This allows your team to adjust quickly and run data-informed tests. |
Back up strategy with proof | These metrics turn day-to-day activity into clear outcomes, such as leads, conversions, and brand growth. This makes it easier to demonstrate social media ROI and build client trust. |
Fuel smarter content decisions | Discover which topics, formats, and messaging styles resonate most. Then, use this data to guide creative decisions based on relevant audience behavior. |
Tie reporting to business goals | Aligning metrics with goals like ROI, retention, or reach ensures reporting stays focused on impact. That way, clients see the real value behind the numbers. |
Agencies that connect social efforts to business goals keep clients longer. Tie performance to pipeline, revenue, or client retention and you stop being the “social media team” and start being a growth partner. If a client sees a jump in sales but can’t tell whether it came from Instagram, email, or SEO, the value of your work gets lost. Good data also makes budget calls easier, helping you double down on what works.
Currently, our highest-performing client is getting 17,000% monthly ROI with us. When you can report those kinds of numbers, it tells a compelling story and keeps clients engaged with your work.
Alex Faiers, Founding Director, Addictivity
Vanity metrics vs. performance metrics
Vanity metrics are surface-level numbers that look impressive but don’t necessarily contribute to tangible business outcomes.
A classic example? Total follower count. A large audience looks good in a competitive analysis, but it doesn’t automatically mean better engagement, more sales, or stronger brand loyalty.
On the flip side:
Performance metrics are tied to specific business objectives and offer clear, valuable insights that you’re able to act on.
Click-through rates, conversion rates, and customer acquisition costs are prime examples of actionable metrics that align with ROI.
Vanity metrics are superficial numbers that fuel the ego. Actionable metrics are valuable numbers that fuel marketing and can be associated with clearly defined and measurable outcomes.
Cheryl Ingram, Managing Director, The Digital Media Collective
The line between the two depends on the campaign’s goals. As a general rule: If a metric supports a clear business objective, it’s performance-driven. If it looks good but doesn’t lead to informed decisions or significant impact, it’s likely vanity.
Vanity metrics still carry context. High engagement tells you the messaging is connecting; a spike in reach tells you the algorithm is rewarding your content. Report them alongside conversion rates and you show the full journey from attention to action.

Optimize your workflow by using this exact social media report template or a pre-built dashboard. Streamline social media management with AgencyAnalytics–it’s free for 14 days.
The 19 most important social media metrics you need to track
Metric | Definition | Formula | Why it matters |
|---|---|---|---|
Reach | Number of unique users who saw the content | Unique users reached | Measures brand exposure without counting repeat views from the same user |
Impressions | Total number of times content was displayed | Total displays | Shows content visibility and frequency of exposure |
Follower growth rate | Speed at which an account gains new followers | (New followers ÷ Total followers) × 100 | Indicates whether content is compelling enough to grow an audience |
Video views and watch time | How often videos are played and how long viewers watch | Total video plays; total watch time | Reveals both visibility and depth of engagement with video content |
Audience engagement | Total interactions with content | Likes + comments + shares + saves | Shows how strongly content resonates with the audience |
Profile views | Number of times users viewed the profile | Total profile visits | Indicates deeper interest and mid-funnel consideration |
Social share of voice (SSoV) | Brand mentions compared to competitors | Brand mentions ÷ Total industry mentions | Measures visibility and competitive presence |
Link clicks | Number of clicks on links in posts or ads | Total link clicks | Shows how well content drives traffic |
Click-through rate (CTR) | Percentage of viewers who clicked a link | (Clicks ÷ Impressions) × 100 | Measures effectiveness of messaging and CTAs |
Landing page views vs. link clicks | Comparison of clicks versus page loads | Landing page views ÷ Link clicks | Identifies drop-offs, load issues, or tracking problems |
Conversion rate | Percentage of users who completed a desired action | (Conversions ÷ Clicks) × 100 | Shows how effectively traffic turns into results |
Cost per thousand impressions (CPM) | Cost to reach 1,000 impressions | (Ad spend ÷ Impressions) × 1,000 | Measures cost efficiency of brand visibility |
Cost per click (CPC) | Cost for each click | Ad spend ÷ Clicks | Indicates efficiency of paid traffic |
Leads generated | Number of completed lead actions | Total leads | Connects social activity to pipeline growth |
Bounce rate | Percentage of visitors who leave without action | (Single-page visits ÷ Total visits) × 100 | Signals landing page relevance and experience |
Customer testimonials | Public customer feedback shared on social | Total testimonials | Builds trust and social proof |
Customer satisfaction score (CSAT) | Customer satisfaction rating | (Positive responses ÷ Total responses) × 100 | Measures experience quality and service effectiveness |
Net promoter score (NPS) | Likelihood to recommend the brand | % Promoters − % Detractors | Indicates loyalty and long-term brand health |
Customer lifetime value (CLV) | Total revenue per customer over time | Avg purchase value × Purchase frequency × Lifespan | Shows long-term impact of social on revenue |
Awareness metrics
At the awareness stage, the goal is to get your client’s brand in front of as many relevant people as possible.
1. Reach
Reach measures how many unique users saw your client’s content. It excludes repeat views from the same user, which makes it a clean measure of exposure for new campaigns or brand launches. If reach is low, test different post formats, adjust timing, or run ads targeting high-intent audiences.

2. Impressions
Impressions measure the total number of times content was displayed on screen, including repeat views by the same user, so they show how frequently a brand appears in front of its target audience. If impressions are low, experiment with content formats, refine targeting, apply an advertising cost, or post multiple times a week.
3. Follower growth rate
Follower growth counts new accounts over a period. Follower growth rate tracks how fast the audience is expanding, which makes it better for comparing performance over time and across accounts of different sizes. Sluggish growth usually means the content isn’t compelling enough to earn a follow. Try thought leadership, behind-the-scenes content, or influencer partnerships. The same applies to your own channels: not all social followers become clients, but a consistent presence builds credibility.
Follower count matters less than whether those followers engage, convert, or buy, but steady growth signals the right audience is finding the brand.
4. Video views and watch time
Video views show how often video content is played; watch time measures how long viewers stay. High views with strong watch time mean the content holds attention. Low watch time points to problems with the hook, pacing, or relevance.
Consideration metrics
Once people know the brand, the next step is interaction. Response time belongs here too, since how fast your client replies to comments and DMs shapes whether a first interaction becomes a second.
5. Audience engagement
Audience engagement covers likes, shares, brand mentions, comments, and saves.
The only way to assess how your message is perceived is by studying the reactions to your content. Clicks, shares, or replies are the “facial expressions” and “words” that tell you how well your conversation is going.
Seth Giammanco, Principal of Strategy & Technology, Minds On Design Lab
Strong engagement means a post or ad resonated enough to spark a response or a share. If it’s low, make posts more shareable with questions, polls, or content that invites a direct response, and test posting times.

Invest in a tool with 85+ integrations across social media, paid ads, email marketing, and more. See what AgencyAnalytics has to offer–try it free for 14 days.
6. Profile views
Profile views count how many users visited the profile after seeing the content, which signals interest beyond a single post. If visits are low, refine bios, highlight key offerings, and make recent posts communicate value clearly.
7. Social share of voice (SSoV)
Social share of voice (SSoV) tracks how often the brand is mentioned compared to competitors, showing how much space it occupies in social conversations. If it’s low, the brand is getting drowned out: increase posting frequency, join trending conversations, or create highly shareable content.
Traffic metrics
At the traffic stage, focus shifts from visibility to action: are social efforts driving users to the website or landing pages?
8. Link clicks
Link clicks measure how many users clicked links in posts or ads, which gauges how compelling the CTA, messaging, and creative are. Low clicks point to unclear CTAs, weak offers, or misaligned targeting.
9. Click-through rate (CTR)
Click-through rate (CTR) is the percentage of users who click after seeing a post or ad. To achieve a good CTR, grab attention quickly, communicate value clearly, and give people a reason to click. A low CTR usually means the message isn’t clear, the CTA is getting lost, or the creative doesn’t match audience intent. Test more direct headlines and confirm the landing page delivers what the ad promised.
10. Landing page views vs. link clicks
This shows how many users who clicked actually landed on the page. A drop-off points to slow load times, tracking issues, or mismatched expectations between the post and the page.
Conversion metrics
Once interest is established, the goal is action. These conversion metrics show whether users take meaningful next steps. For paid campaigns, pair them with cost per acquisition (CPA), return on ad spend (ROAS), and website traffic from social.
11. Conversion rate
Conversion rate is the percentage of users who complete a desired action after clicking, such as filling out a form or making a purchase. A strong rate means the content is attracting the right audience or the offer is compelling. To fix a low rate, revisit the landing page: align it with the expectations the ad set, remove friction, and make the next step obvious.

12. Cost per thousand impressions (CPM)
Cost per thousand impressions (CPM) is what your client pays for 1,000 views of an ad. A lower CPM usually means the platform sees the ad as high-quality and relevant, so it’s cheaper to distribute at scale. If CPM runs high, broaden the target audience slightly, test formats like Reels or Stories, or improve the creative. Small adjustments change how far the whole budget goes.
13. Cost per click (CPC)
Cost per click (CPC) is what your client pays each time someone clicks an ad. A lower CPC generally means the ad is relevant and the targeting is dialed in. If it runs high, test different creatives, adjust targeting, or refine the messaging.

Consolidate data across 85+ platforms and deliver results that matter–try AgencyAnalytics, free for 14 days.
14. Leads generated (form fills, demo requests, signups)
Leads generated count how many users completed a lead action after clicking through from social, which shows directly which platforms, campaigns, and content types drive pipeline rather than just engagement.
15. Bounce rate
Bounce rate is the percentage of users who land on the page from social and leave without acting. A high rate could mean the page doesn’t match the ad, loads slowly, or is hard to use. Align it with the ad’s message and visuals, keep it fast, and give a clear next step.
Advocacy metrics
After the conversion, these metrics show how well your client builds loyalty and long-term value. Repeat purchase rate from social-acquired customers belongs here too, alongside softer signals like positive comments and DM sentiment.
16. Customer testimonials
Testimonials are social proof: real people saying publicly that your client’s product or service worked. Monitor comments, tags, and mentions for feedback you can reshare, prompt happy customers to post (a caption asking for before-and-after photos works), and ask for reviews during 1:1 interactions.
17. Customer satisfaction score (CSAT)
Customer satisfaction score (CSAT) measures how happy customers are with a specific interaction, usually captured right after a purchase or support conversation. On social, it comes from quick polls, direct messages, or embedded surveys. A lower score points to gaps in service, unclear communication, or missed expectations, so monitor conversations, respond promptly, and keep every interaction on-brand.
18. Net promoter score (NPS)
Net promoter score (NPS) tracks how likely the audience is to recommend the brand. On social, gather it with polls, DMs, or linked surveys asking followers: “How likely are you to recommend this brand to a friend?” on a scale from 0 to 10.
A high NPS means the audience will publicly endorse the business through shares, tags, or recommendations. A low score may suggest disconnects in content, product perception, or service, so engage brand advocates and respond to concerns.

Use a sentiment analysis tool like GatherUp to keep an eye on your client’s online reputation. Explore this integration in AgencyAnalytics by signing up for a free 14-day trial today.
19. Customer lifetime value (CLV)
Customer lifetime value (CLV) estimates how much revenue a single customer brings in over their whole relationship with the business, which shows how effectively social acquires customers and keeps them. A low CLV points to one-time buyers. To improve it, stay connected post-purchase with loyalty perks, product benefit reminders, and re-engagement campaigns.
How to calculate social media ROI
Social Media ROI = ((Revenue from Social Media - Cost of Social Media Marketing) / Cost of Social Media Marketing) × 100
The result is a percentage: positive means the campaign earned more than it cost, negative means the opposite, zero means you broke even. It works for paid campaigns, organic content, or a mix, and its accuracy comes from what you put on each side.
Define the revenue or value generated
Identify everything the campaigns produced: direct sales, form completions, booked calls, app downloads, and any other conversion trackable back to social. For lead generation campaigns, assign a dollar value to each lead based on the client’s historical close rate, using Google Analytics, CRM data, and platform conversion tracking to attribute it to social sources.
Calculate the total cost
The cost side is more than ad spend. Factor in:
Ad spend across all social media platforms
Staff time (hourly rate × hours spent on the campaign)
Design and content creation costs for valuable content assets
Social media tools and reporting software fees
Influencer marketing fees or paid media promotions
If you only count ad spend, you’ll overstate your return.
Example calculation for an agency client campaign
Say you ran a 30-day Instagram ad campaign for an ecommerce client:
Revenue from social: $15,000 in tracked sales from Instagram ads
Ad spend: $3,000
Staff time: $1,500 (30 hours at $50/hr)
Design and tools: $500
Total cost: $5,000
ROI = (($15,000 - $5,000) / $5,000) × 100 = 200%
For every dollar invested, the client received $2 in profit. That’s a number worth putting in a report.
Why social media ROI is hard to measure
Even agencies that know the formula struggle to prove ROI. Attribution is messy, timelines are long, and not every outcome fits into a spreadsheet. Four common challenges:
Attribution is split across multiple touchpoints
A prospect saves a couple of Pins from your client’s Pinterest account. Weeks later they search on Google, find the website, and buy. Full credit is hard to assign, and capturing every touchpoint manually isn’t realistic. That’s what UTM parameters and multi-touch attribution models are for. Tag every social link with UTMs and you see exactly which platforms and campaigns drove traffic. Pair that with Google Analytics and you see how social touches influenced downstream conversions, even when social wasn’t the last click, which creates a roadmap of the customer journey.

Use a Google Analytics dashboard to connect your client’s social media initiatives to website activity. Get granular insight into customer behavior. Try this dashboard free for 14 days on AgencyAnalytics.
Social media traction takes time to build
Campaigns go through testing phases: different content types, visuals, headlines, and calls to action. External changes, like Facebook’s ODAX rollout or shifting algorithm priorities, force mid-campaign adaptation and stretch performance timelines. A slow start sometimes gets mislabeled as negative ROI, so monitor social media performance over time and report progress regularly.
Data lives across disconnected platforms
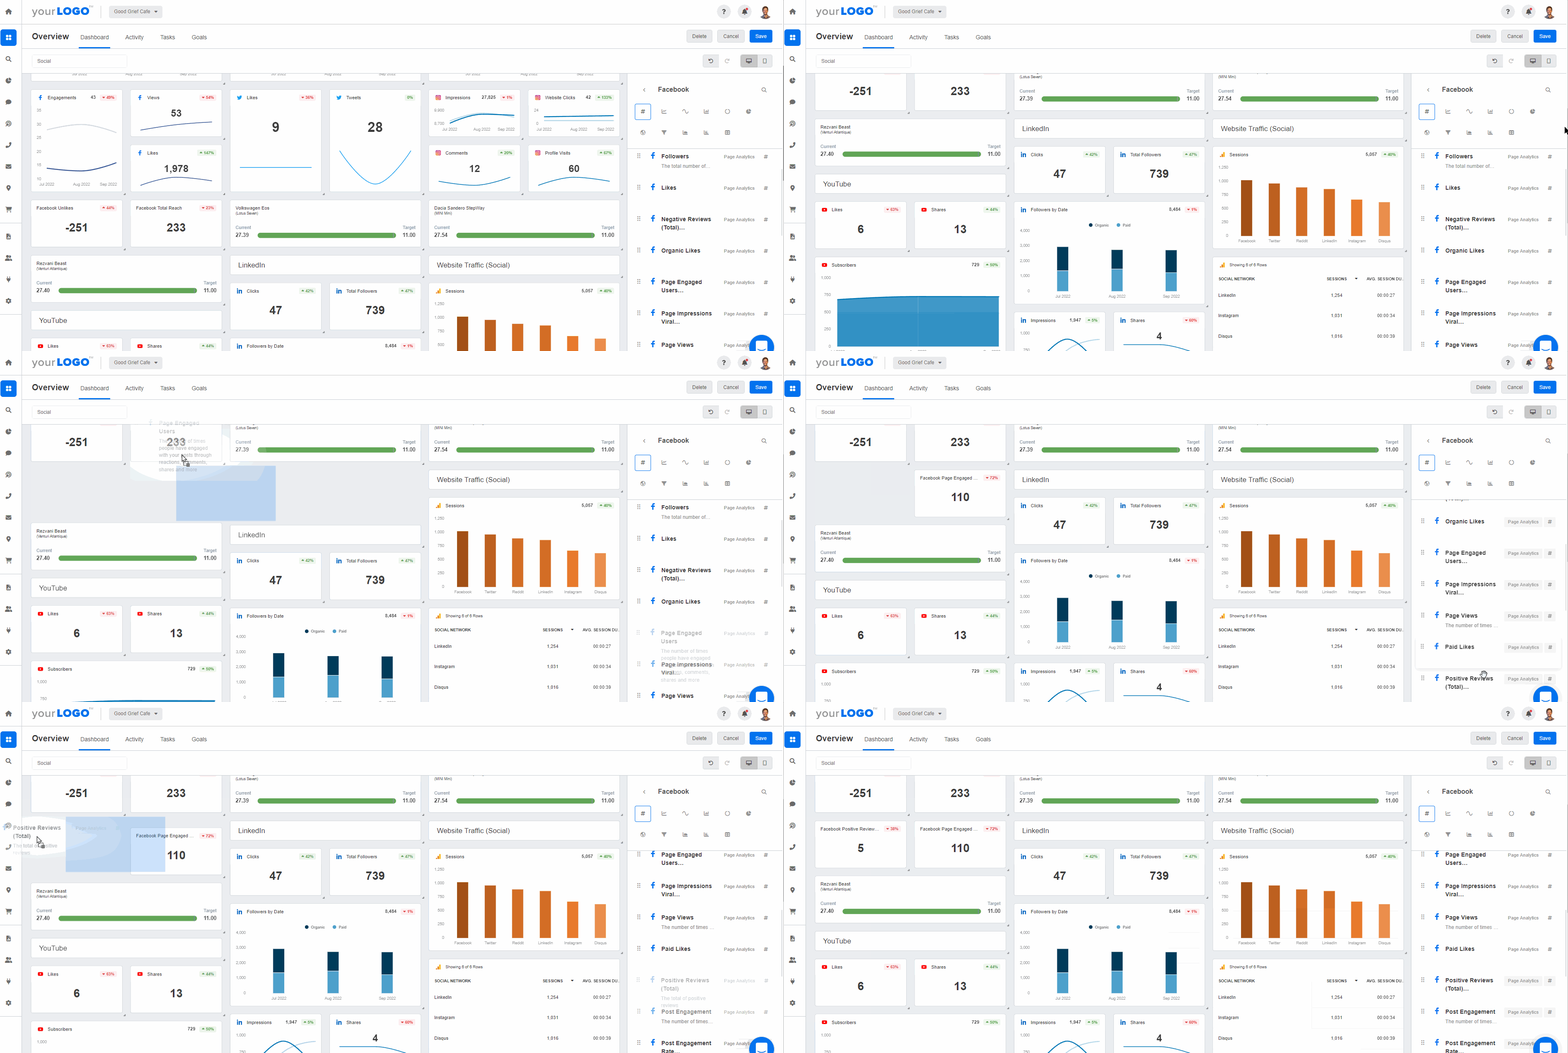
Facebook has its own analytics. Instagram has another. LinkedIn, TikTok, Pinterest: each has its own interface, metrics, and definitions. Pulling from each one across multiple clients is a time sink and a source of errors. Numbers get copy-pasted wrong, date ranges don’t match, and by the time the report is built the data is stale. Agencies that track ROI well centralize reporting instead. It’s the difference between spending your afternoon on screenshots and spending it on strategy.
Not every return shows up as revenue
A local SEO client who just launched a restaurant may run a Facebook campaign for brand awareness and follower count. There’s no immediate revenue, but the online presence and repeated exposure raise the chances of monetary ROI later. Assign estimated values so those campaigns still get a number:
Lead generation: Base the average value of a lead on your client’s close rate and average deal size. A campaign bringing in 50 leads, where the client closes 10% at $2,000 each, is worth an estimated $10,000.
Brand awareness: Track share of voice, brand mentions, and audience growth. Compare earned media value against what paid coverage at similar reach would cost.
Customer lifetime value: A new follower may become a repeat customer. Estimate Customer Lifetime Value (CLV) to price that long-term relationship.
A lead captured through a form might be worth $50 based on the client’s average conversion rate; an email subscriber might be worth $20 based on email revenue data. These estimates answer the client asking what they’re actually getting.
How to measure social media ROI step by step
Calculating ROI is the math. Measuring it is the system. Here’s a five-step framework you can repeat across every client and campaign.
1. Set clear client goals and campaign objectives
Have a 1:1 conversation to understand the client’s business objectives first. For full guidance, read The Ultimate Guide to Setting Goals With Marketing Agency Clients. Say an ecommerce client wants $120K in revenue next quarter and most leads and sales come through Instagram. Focusing on lead-generating social efforts makes the most sense, and that shapes the campaign itself: product tags in Instagram shopping, or lead generation forms in ad campaigns.

We prioritize client goals above all else and work tirelessly to deliver measurable results that drive business growth. To do this, we take a data-driven approach by constantly measuring and analyzing the results. This ensures that we’re delivering maximum ROI for our clients.
Daniel Dye, President, Native Rank, Inc.
2. Choose the right social media ROI metrics
Get granular and decide on specific KPIs or OKRs. Continuing the example: analyzing the client’s historical lead-to-conversion ratio shows they need a 5% conversion rate to hit the revenue target. That becomes the actionable KPI, and the basis for proving ROI later.

3. Build a reliable tracking system with UTMs and dashboards
The best strategy is useless if you can’t trace results back to campaigns. Set UTM parameters on every link you share, so Google Analytics shows exactly which posts, ads, and platforms drove traffic and conversions. Pair them with a social media dashboard that pulls all social data into one place. Solid tracking means less time hunting for data and more time analyzing it.
4. Analyze performance and connect social to outcomes
Read the data through the lens of the goals from step 1. Did the campaign generate leads? At what cost? How did engagement rates compare to previous campaigns? Did website traffic from social increase? If an Instagram campaign drove 200 leads and 20 converted into paying customers, you can calculate exact ROI and tell a clear story about the value delivered.
5. Turn the data into a client-ready ROI report
Present those social media analytics in a report. Screenshots and copy-paste Excel won’t hold up across multiple clients and accounts.
Use a client reporting platform like AgencyAnalytics to fetch data automatically and build social media campaign reports in a few clicks. A strong client-ready ROI report includes:
A summary of campaign goals and whether they were met
The ROI calculation with clear numbers
Key metrics tied to business goals (conversions, leads, revenue from social)
Visualizations that make performance easy to scan
Your recommendations for what to do next
Monthly reporting works for most clients. For larger accounts with active campaigns, give ongoing access to a live custom marketing dashboard between formal reports.
How to prove social media ROI to clients and stakeholders
Crunching the numbers is one thing. Showing clients what those numbers mean is where trust builds. Here’s how to turn ROI data into a compelling client story.
Align every campaign with client business goals. A conversion-focused Facebook ad needs different analysis than a month-long organic Instagram push. Paid campaigns lean on ROAS and CPA; organic growth may involve cost savings, reach per post, or engagement improvements. Where a campaign is about visibility and trust, show brand lift, share of voice, or audience retention.
Tailor reports to the audience reading them. Senior leadership wants the bottom line: how much did we spend, what did we get back, what next. A marketing manager wants which platforms performed, which content types drove engagement, and where the budget went. Lead with the ROI number, then add the tactical breakdown.
Give every number context. A 3% engagement rate means nothing in isolation. A 3% engagement rate that’s a 40% improvement over last quarter means something. Trend lines, goal-tracking visuals, and period-over-period comparisons do that work.

Create custom dashboards in AgencyAnalytics to spotlight the social commerce metrics that drive success and derive actionable insights to guide your next steps. Try it free for 14 days.
End every report with recommendations. What you’d do differently, what you’d scale, what you’d test next. B2B ROI often comes from long sales cycles, so measure progress with metrics that correlate to eventual conversions:
Engagement growth
Increase in branded search
Lower cost per qualified lead
Clients see a measurable, repeatable process, and that’s what keeps them from shopping around when budgets tighten.
What is a good social media ROI?
It depends. There’s no single number that qualifies as “good” across all industries, campaign types, and business models. An ecommerce brand running social commerce campaigns might expect 300-500% ROAS. A B2B SaaS company focused on lead generation might be happy with a 50% return over six months because the average deal size is much larger. Margins matter too: a high-margin business can stay profitable at a lower ROI percentage, while a low-margin business needs a higher return to justify the budget share.
Instead of chasing a universal number, benchmark in three ways:
Against past campaigns: Is this month’s ROI better than last month’s? That’s the most actionable comparison.
Against industry averages: Use platform-specific figures for engagement rates, CTR, and reach.
Against the client’s own goals: If the goal was 100 leads and you delivered 120 at a lower CPA than last quarter, that’s a win regardless of the industry average.
Use social media benchmarks for context
Social media benchmarks show clients how their performance compares to industry standards, which makes it easier to spot strengths, uncover gaps, and set realistic goals. The figures below come from benchmarks sourced from 150,000+ campaigns across 7,000+ agencies on the AgencyAnalytics platform.
(Note: These benchmarks are based on campaigns that are primarily based in the US, Canada, UK, Australia, and New Zealand.)
Typical benchmark ranges
Ranges shift over time with algorithm updates, seasonal behavior, content formats, and how audiences use each network, so treat them as reference points rather than hard targets. Average post engagements on Facebook typically land around 353 (as of February 2026), but by industry that looks very different:
Arts & Entertainment averages much higher engagement (around 1,036) thanks to highly visual and shareable content.
Career & Employment tends to see lower engagement (closer to 45), as content is often more informational and less interaction-driven.
LinkedIn shows similar variation. Impressions average around 652 across all industries, but:
Education & Instruction performs well above that range (approximately 1,414), driven by thought leadership and professional learning content.
Real Estate trends lower (around 275), as content is often more localized and niche in reach.

Access industry-specific benchmarks, forecasted metric trends, and more–try AgencyAnalytics, free for 14 days.
Benchmarks by industry
For the full range by platform, industry, and country, sign up for a free 14-day trial.
Facebook (and the wider Meta Business Suite) supports campaign goals from brand awareness to website traffic. These two Facebook metrics are commonly used indicators.
Metric | Arts & entertainment | Food & beverage | Travel |
|---|---|---|---|
Post impressions | 73,454 | 92,291 | 69,079 |
Post engagement rate | 1.04% | 0.81% | 1.18% |
LinkedIn is used for professional visibility, thought leadership, and lead generation, where impressions and clicks show how content drives interest.
Metric | Education & instruction | Advertising & marketing | Business services |
|---|---|---|---|
Impressions | 48,674 | 17,271 | 27,965 |
Clicks | 106 | 33 | 48 |
YouTube is long-form and video-first, where performance depends on content quality, relevance, and viewer retention over time.
Metric | Arts & entertainment | Health & fitness | Real estate |
|---|---|---|---|
Video views | 3,348 | 505 | 133 |
Average watch time (minutes) | 2,107 | 681 | 206 |
How to improve social media ROI
Once you’ve tracked and proven ROI, the next step is continuous improvement.
Align creative with audience intent. A lead-gen campaign targeting mid-funnel prospects needs different messaging and CTAs than a top-of-funnel awareness push. When creative matches where the audience is in the customer journey, campaigns generate better ROI without a bigger budget.
A/B test content, offers, and CTAs. Refine visuals, CTAs, headlines, offers, and post timing. Test one variable at a time so you know what caused the lift, then track those shifts with granular reporting to show clients the strategy behind each adjustment.
Focus budget on high-performing channels and formats. Patterns emerge once tracking is dialed in: Instagram Reels driving twice the engagement of static posts, LinkedIn generating more qualified leads than Facebook for a B2B client, TikTok showing high engagement but low conversion. Reallocate toward what produces results.
Automate the reporting. Every hour spent copy-pasting data into a spreadsheet is an hour not spent creating content or refining strategy. For agencies managing 20+ clients, automation is the difference between scaling and burning out.
The tools worth having in place
Native platform analytics. Facebook, Instagram, LinkedIn, TikTok, and Pinterest all offer built-in analytics, useful for quick checks on post-level performance, audience demographics, and engagement. They show one platform at a time, and they stop at the platform’s edge.
Google Analytics and attribution tools. Google Analytics bridges social and the client’s website: how much traffic social drives, which pages visitors land on, and whether they convert. With UTM parameters, it attributes conversions to specific campaigns and posts and shows how social fits the full sales funnel.
Agency dashboards and automated reporting platforms. An agency-focused platform pulls data from every social platform, Google Analytics, ad networks, and other marketing tools into one place, so instead of logging into 12 accounts you see everything on one dashboard. A social media metrics and KPIs dashboard is a way to:
Save time by automating data collection across multiple social platforms.
Increase transparency by giving clients on-demand access to their real-time results.
Standardize reporting across clients through consistent layouts and dynamic visuals.
Highlight the social media metrics that align with your client’s priorities.
For agencies, the platform needs to handle multiple clients, allow white-labeled reports, and automate data collection. That’s what AgencyAnalytics is built for.

With social media analytics software, reporting stops being a time drain and keeps teams focused and clients informed.

Track and report social media metrics with AgencyAnalytics
Effective reporting starts with picking the metrics that tie into client goals. As a recap:
Start with your client’s goal: brand awareness, lead generation, or sales, and map metrics to the outcomes they care about most.
Align metrics to the funnel stage: track awareness, consideration, conversion, and advocacy separately to see which content drives discovery and where users drop off.
Focus on what’s actionable: if engagement drops, test new creative or posting times. If CTR is low, revisit headlines, target different demographics, or try new CTAs.
Ensure consistency over time: evaluate the same metrics regularly to spot trends and avoid misreading one-off spikes or dips.
Clients don’t want to dig through spreadsheets or scattered screenshots. Use a social media analytics tool that brings everything together, so you stop stitching data from multiple accounts and keep more billable time.
We want to be totally transparent with our clients. AgencyAnalytics allows us to provide our clients with a live dashboard where they can have complete insight into what we’re doing without needing full access to the platforms where they could potentially interfere with overall performance.
Michael Wisby, CEO, Two Trees PPC
With AgencyAnalytics, you can:
Automate data retrieval across the social media ecosystem, including Facebook, Instagram, LinkedIn, YouTube, and more.
Monitor performance via real-time dashboards that are fully customizable, easy to understand, and beautifully designed.
Easily track key social media analytics across multiple channels, including engagement, follower growth, CTR, and conversions.
Generate white labeled social media analytics reports that reflect your agency’s branding. Even choose specific dates based on the reporting period.

**
Use a dedicated [social media dashboard](https://agencyanalytics.com/templates/templates/dashboards/social-media-dashboard) to prove ROI and show why your agency is worth partnering with. Track social media impressions, CTR, and other key metrics with AgencyAnalytics–[it’s free for 14 days](https://app.agencyanalytics.com/signup). **
With everything in one place, you’ll spend less time chasing data and more time driving results.
Impress clients and save hours with custom, automated reporting.
Join 7,000+ agencies that create reports in under 30 minutes per client using AgencyAnalytics. Get started for free. No credit card required.

Already have an account?
Log inFrequently asked questions about social media ROI
For non-ecommerce clients, focus on the outcomes that matter to their business: leads captured through lead generation forms, phone calls booked, form submissions, consultation requests, or app downloads. Assign a dollar value to each outcome based on the client’s historical close rate and average deal size. You can also track brand awareness metrics like share of voice and audience growth, then estimate what that level of visibility would cost through paid media.
ROAS (return on ad spend) measures how much revenue you earned for every dollar spent on ads. It only looks at ad spend. Social media ROI is broader. It factors in all costs of running a social campaign, including ad spend, staff time, creative production, social media tools, and any influencer marketing fees. ROAS is one piece of the ROI puzzle, but it doesn’t give you the full picture of profitability.
Yes. While organic social doesn’t have a direct ad spend cost, it still has costs: staff time for creating content, design resources, and tool subscriptions. Track the traffic and conversions organic social posts drive using UTM parameters and Google Analytics. You can also measure the value of organic reach by comparing it to what equivalent paid media exposure would cost. Engagement metrics, follower growth, and brand mentions all contribute to measuring organic social ROI.
Monthly reporting is the standard for most agency clients. It gives you enough data to identify meaningful trends without overwhelming the client. For high-spend accounts or active paid campaigns, giving clients access to a live dashboard for real-time insights is a smart move. Quarterly reports work well for big-picture strategy reviews where you assess overall ROI across all social campaigns.
Paid social campaigns can show measurable ROI within days or weeks, especially for conversion-focused ads with clear calls to action. Organic social and brand-building campaigns take longer, often 3-6 months before you see consistent results. The timeline depends on factors like audience size, the client’s industry, how much the brand already has in terms of social media presence, and whether the content strategy is reaching the right audience.
Faryal Khan is a multidisciplinary creative with 10+ years of experience in marketing and communications. Drawing on her background in statistics and psychology, she fuses storytelling with data to craft narratives that both inform and inspire.
Read more posts by Faryal KhanWhat other agency experts are reading

Social Media Benchmarks for 2025
Compare your agency’s social media performance against industry benchmarks for engagement, follower growth, and impressions across platforms. See how you stack up and learn how to interpret these metrics to improve client campaigns.

The essential social media reporting guide (+ Free report templates)
A comprehensive social media report is non-negotiable for showcasing results. This guide covers everything needed to highlight key metrics and trends, backed by free social media report templates to streamline and make your reporting process stress-free.
