Table of Contents
QUICK SUMMARY:
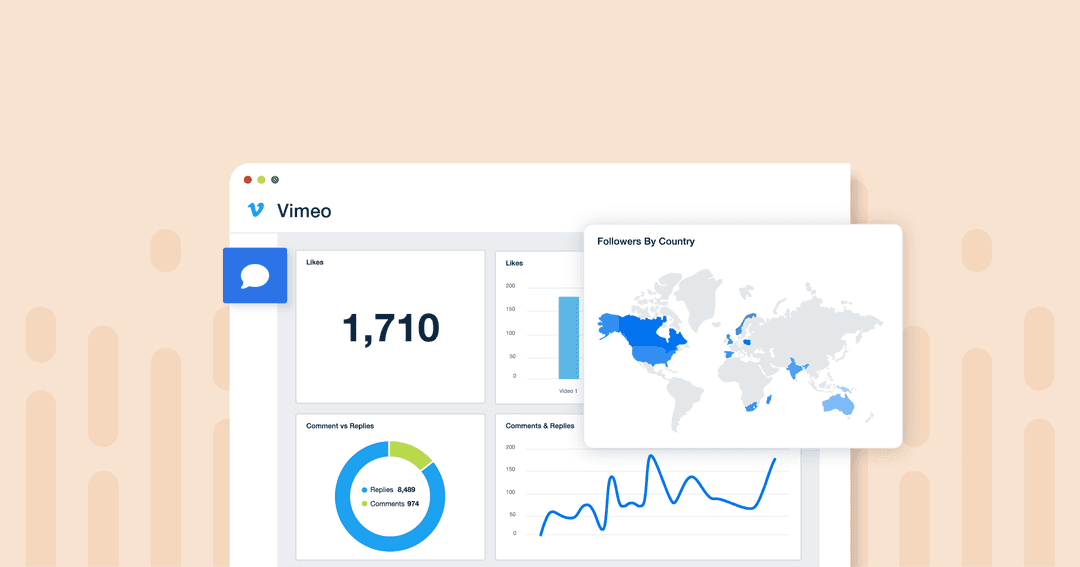
Vimeo Analytics goes beyond basic statistics and provides insight into video campaign performance. These metrics identify the videos that resonate with viewers most, which is essential for achieving broader goals like brand awareness. Use these analytics to refine video campaigns and attain better results.
Stunning video quality? Check. Privacy controls and video analytics? Double check.
That’s the power of a platform like Vimeo, popular for its extensive community of professionals and top-notch creators. It’s an excellent option for niche-based clients who want to produce high-quality videos consistently.
Content aside, this platform also offers advanced analytics to assess video performance and make strategic decisions. While these numbers are accessible in-platform, agencies need a more time-efficient approach to performance tracking.
Think about it–you’ve got a growing roster of clients that use a variety of marketing platforms (and not just video). Pulling all their analytics from a host of locations will be time-consuming and inefficient. That’s where an automated reporting solution comes in handy.
In this article, we’ll discuss how to automatically retrieve stats, track performance, and create video marketing analytics reports that clients will love.
Why Should Agencies Recommend Vimeo?
To put things in perspective, consider these compelling stats:
There are over 300M users and 1.7M paid subscribers on Vimeo.
Over 350K videos are uploaded to the platform every day.
The platform amassed around $433M in revenue in 2022.
There were over 4.72M downloads of the mobile app in 2022.
Additionally, Vimeo has several standout features that enhance both the video creation and viewing experience.
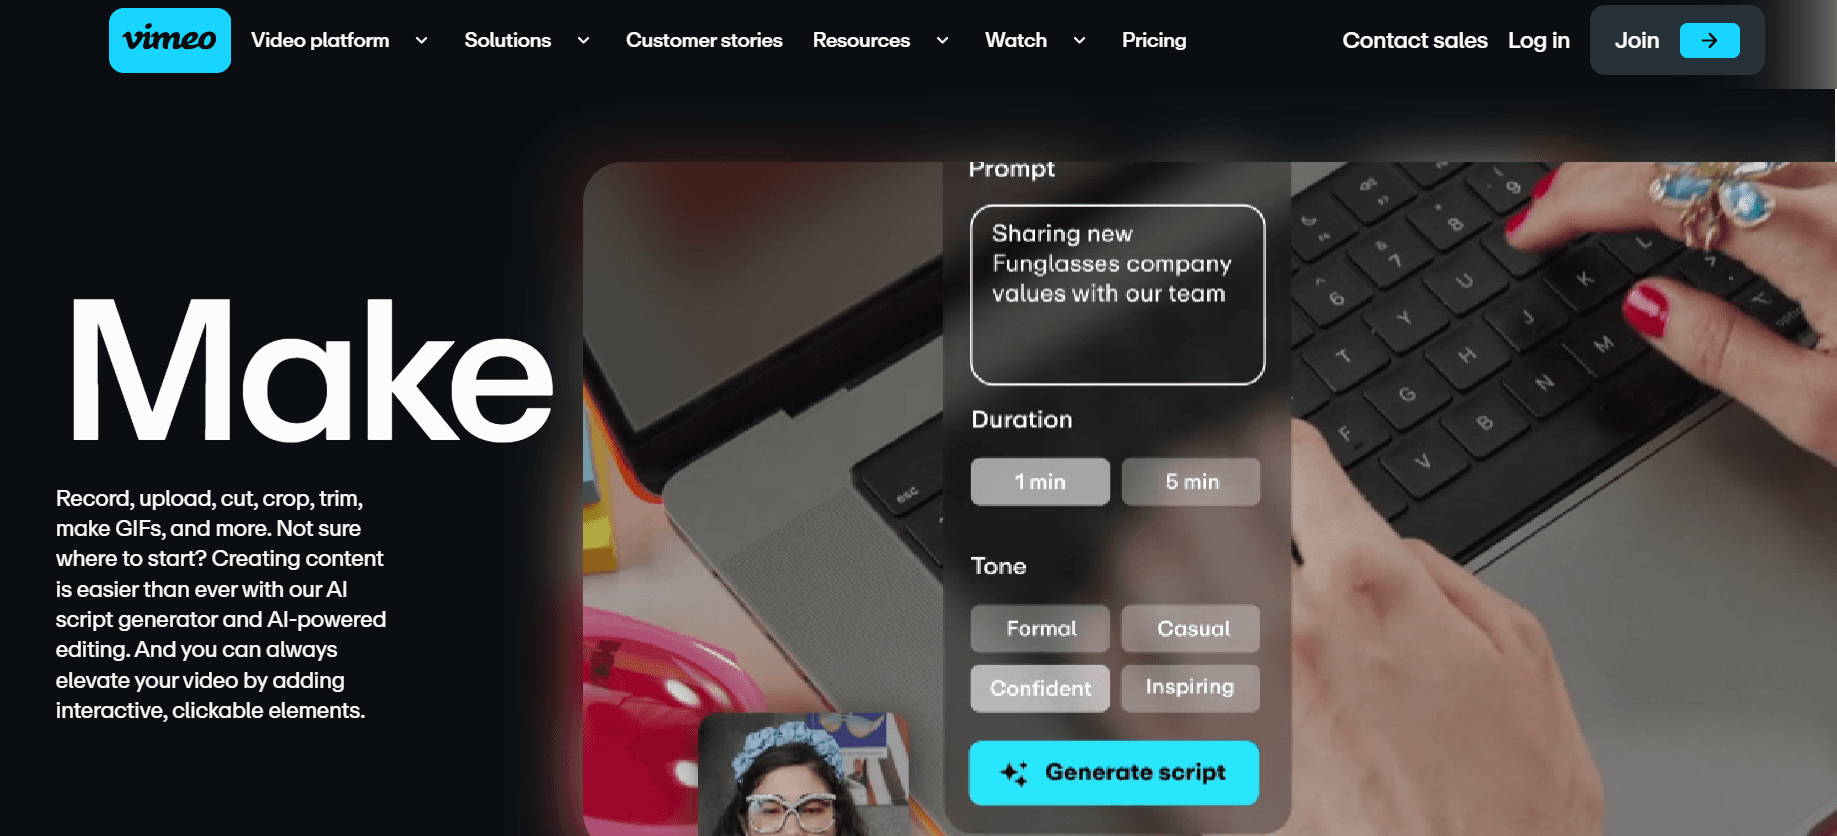
For example, the platform offers an auto-transcription feature, ensuring that videos can be watched and understood by a variety of audiences. There’s also an AI-powered script generator that streamlines and expedites the video production process.
The platform’s robust privacy settings also provide greater control over video viewing. For example, clients may want to share exclusive content with premium members who pay a higher subscription fee.
Examples of Client Industries That Will Benefit From Vimeo
Here are some examples of industries that will benefit from this video platform and use cases.
Corporate and B2B: Produce internal communication videos, product demos, and business presentations. Utilize in-platform privacy settings to allow internal-only content.
Non-Profit: Craft compelling documentary-style videos to promote awareness and social causes in a particular country or city.
Retail: Use high-quality cinematic features to create visually stunning promotional videos and short films.
Healthcare: Develop patient education videos, medical device demonstrations, and healthcare provider content.
Real Estate: Create upscale virtual property tours and real estate showcase videos in a visual, dynamic way.
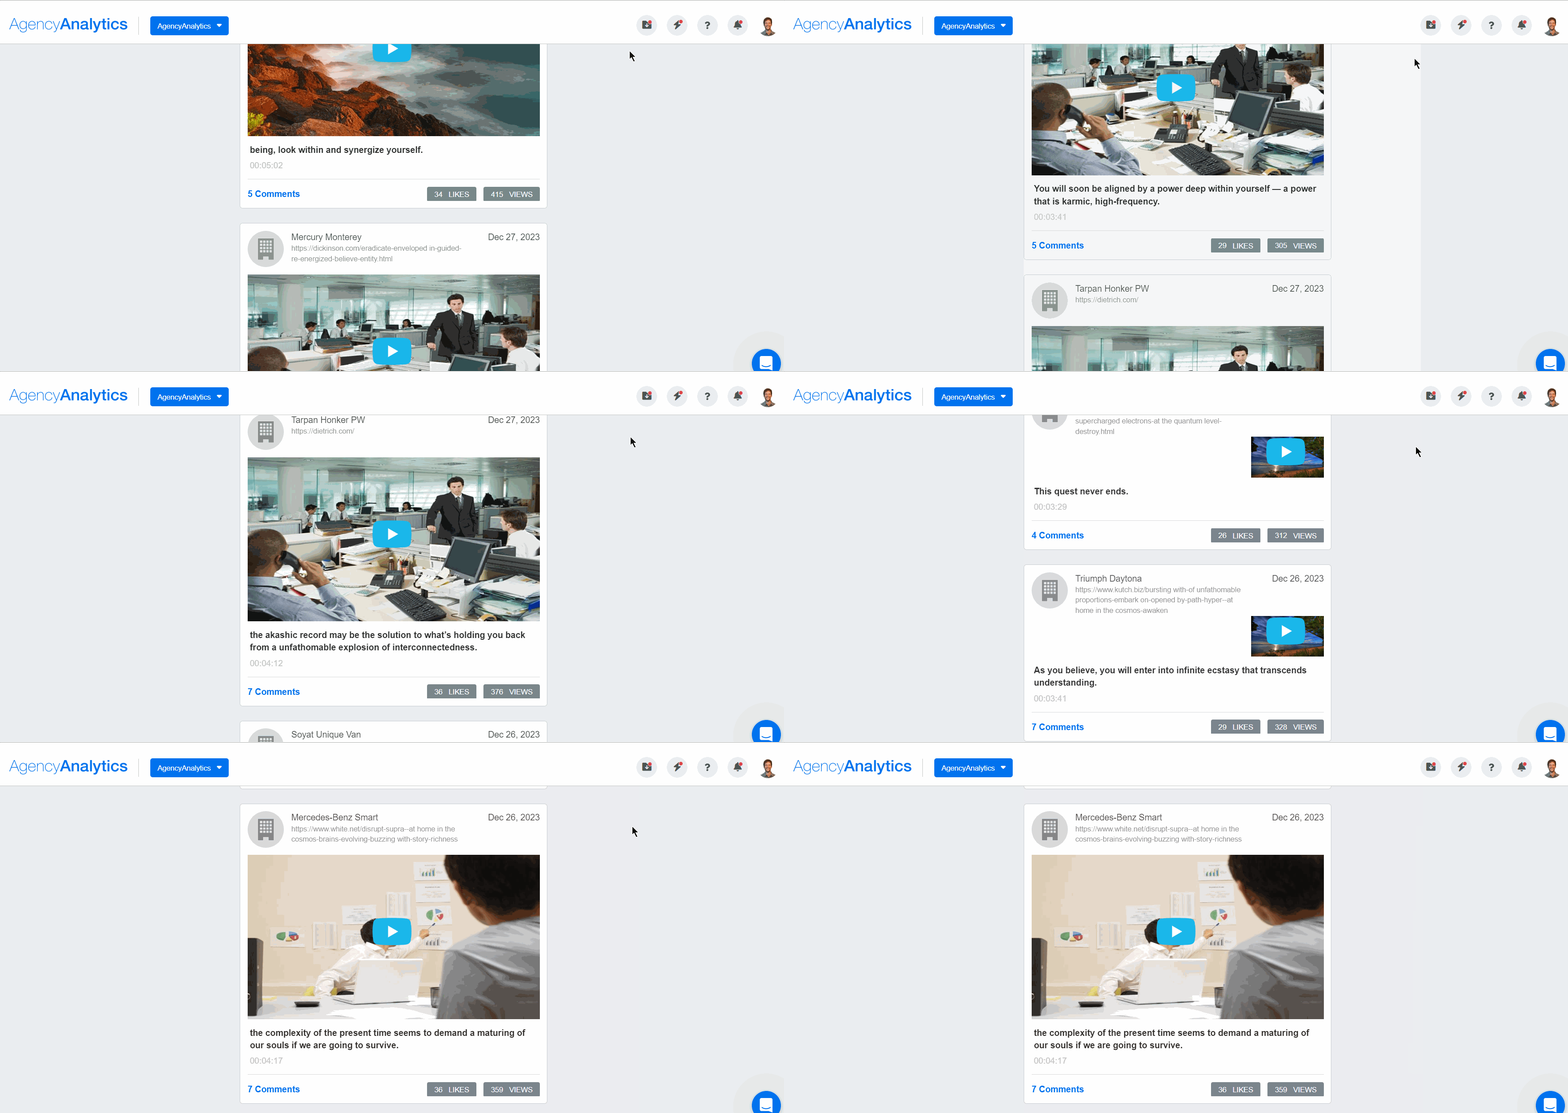
Access a live view of your client’s video feed and keep on the pulse of video performance. Explore the Vimeo integration on AgencyAnalytics, free for 14 days.
What Is Vimeo Analytics?
Vimeo Analytics is a comprehensive way for agencies and content creators to access in-depth insights about in-platform video performance.
Through metrics like Views and engagement-related insights (e.g., comments), it becomes much easier to gauge the effectiveness of video campaigns in real-time. This actionable data identifies which videos resonate most with viewers, leading to more data-informed and impactful strategies.
The Importance of Tracking Video Analytics
Clients need more than a surface-level overview. It’s especially crucial when their video content is tied to broader business objectives (e.g., racking up video impressions to build brand awareness).
Sure–they’ll have access to stats on their video feed. That said, clients will rely on your agency to answer deeper questions like “What type of video content resonates with our viewers most?”
To demonstrate your understanding of video analytics, report on the following performance data below.
Video Analytics | Description |
|---|---|
Views | The number of times a video has been watched, which is a good gauge of visibility. A high number of views means more impressions and popularity. |
Followers | The number of users that follow your client’s profile. A growing follower count may lead to further engagement and interest in future content. |
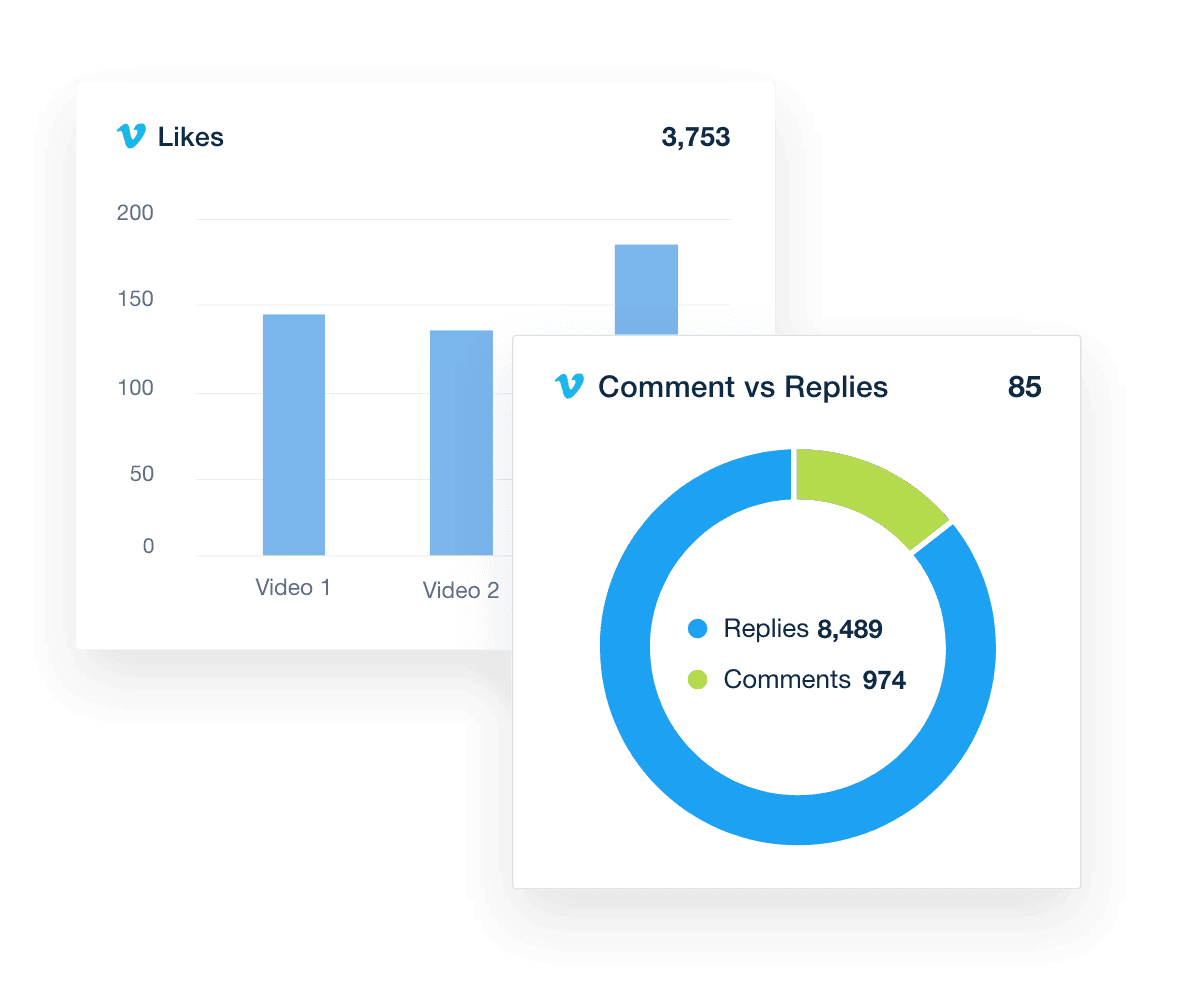
Likes | The total number of likes on a client’s video, indicating some level of viewer appreciation. Likes often correlate with satisfaction and positive reception. |
Comments | Written feedback or engagement by viewers. Comments offer qualitative and valuable insights into audience perception (e.g., “I found this helpful; thanks for sharing!”) |
Replies | The number of responses to comments. This form of community engagement may enhance viewer retention while fostering two-way conversations. |
Videos Published | The total number of videos a client has uploaded, often reflecting their activity level. A healthy number of Videos Published suggests a rich, diverse library. |
Demographics | Create pie charts of followers by country and followers by gender to gain an understanding of who is interacting with your clients' videos. |
While these video analytics are available in-platform, logging into your client’s account every time you need to retrieve this data becomes tedious very quickly.
Aside from video, your clients are likely running other types of campaigns (e.g., related PPC and social media efforts). Marketing doesn’t exist in siloes, and your agency needs a strategy to put the moving parts together. It’s especially important for enterprise accounts with multiple large-scale campaigns across various platforms.
What if there was a way to automatically retrieve marketing data place? It isn’t too good to be true–just check out AgencyAnalytics (it’s free for 14 days).
Why You Need the Vimeo Integration in AgencyAnalytics
Relying on archaic methods–like copying and pasting screenshots into Excel–will only slow you down. Plus, it’s a complete pain for whoever’s tasked with this tedious exercise (just ask your Social Media Manager).

No need to succumb to manual reporting woes. Invest in an all-in-one reporting solution like AgencyAnalytics to:
Automate the data retrieval of video analytics and additional insights.
Track a range of advanced analytics across 80 marketing platforms. Choose your preferred data visualization for these metrics (e.g., a bar graph, pie chart, geographical map).
Grant clients 24/7 on-demand access to their marketing data.
Flip a dashboard into a report in just a few clicks!
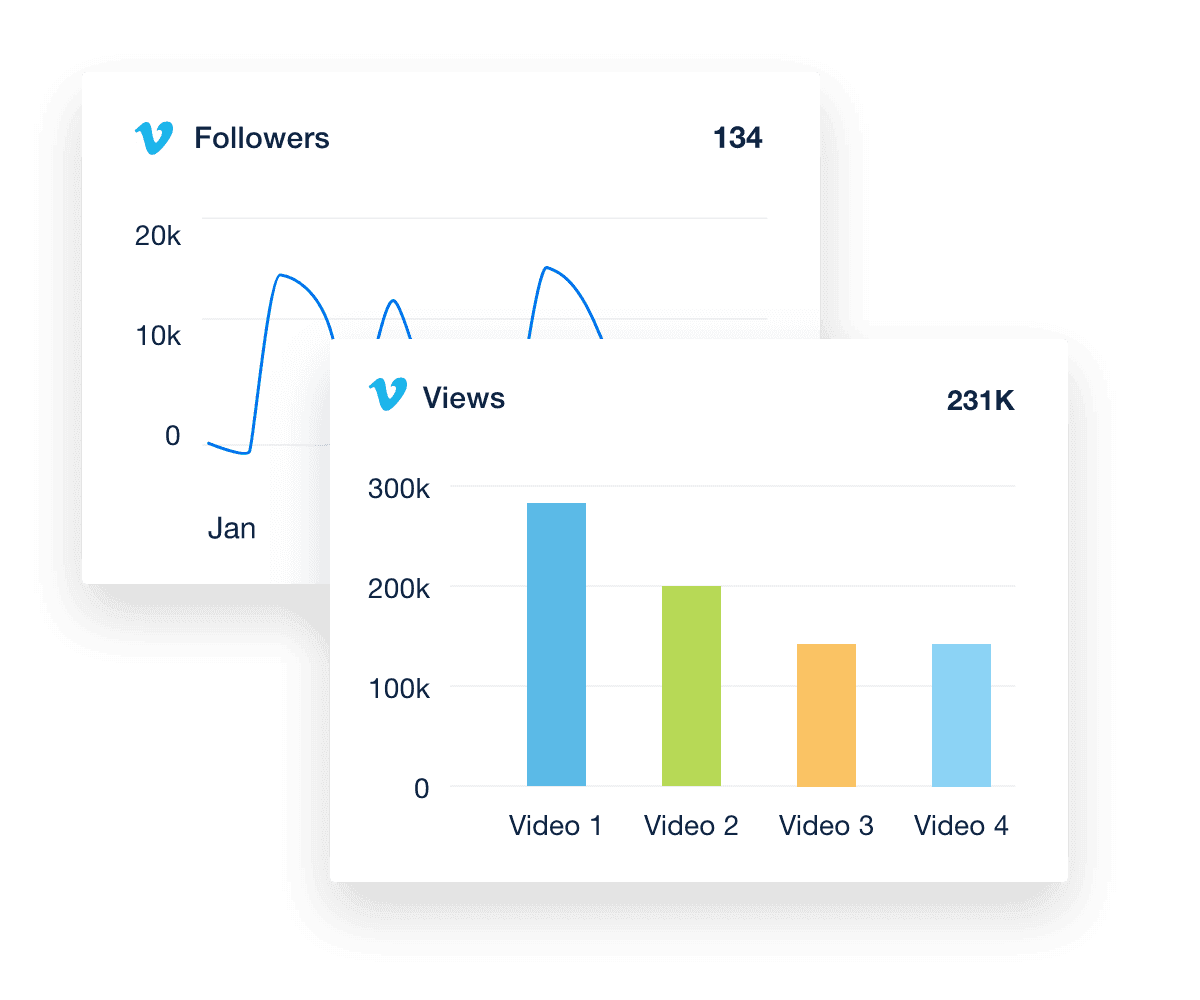
Track video analytics such as impressions, number of viewers, and more. Create a dashboard with all the right stats–it’s available on AgencyAnalytics when you sign up for a free 14-day trial.
Create Visual Reports That Clients Easily Understand
Setting up your integration is a quick, no-fuss process in AgencyAnalytics. Here’s a step-by-step guide to getting started.
1. After logging into your AgencyAnalytics account, head to ‘Integrations’ on the left-hand menu.
Search for Vimeo under ‘Social’ or ‘All Collections.’
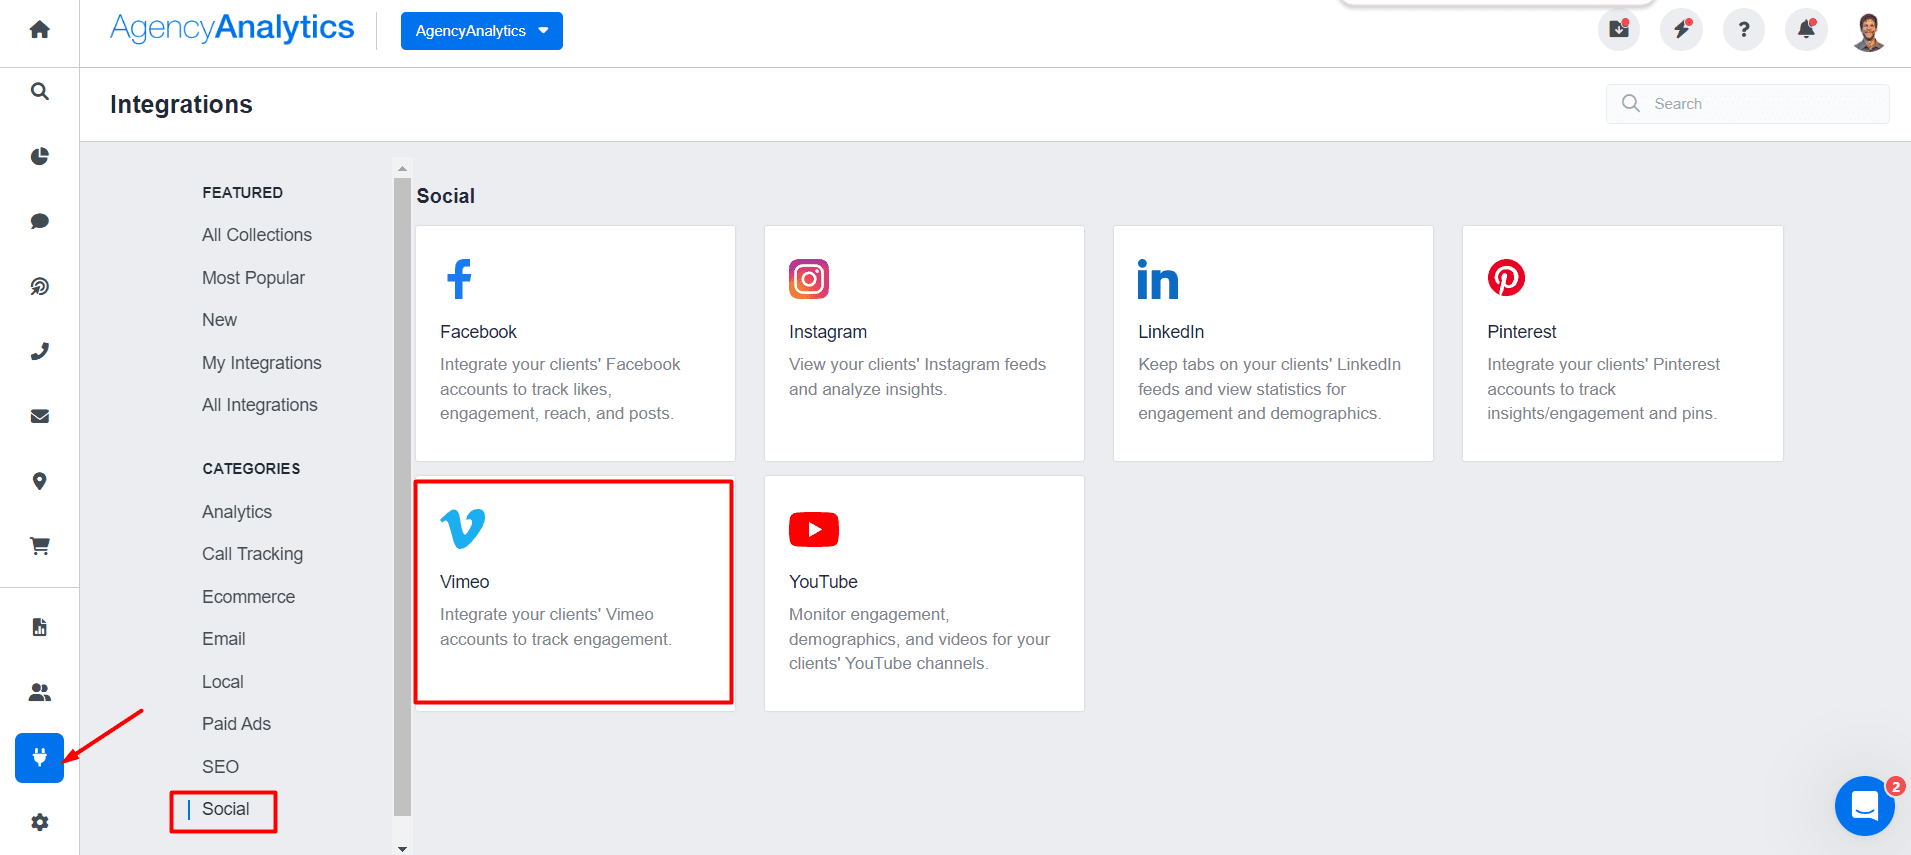
2. Next, enter your client’s credentials and follow the instructions to connect their account to AgencyAnalytics. As a final check, look for a green tick above Vimeo on the Integrations page.
3. To see your client’s video analytics, navigate to ‘Social > Vimeo’ on the left-hand menu. Just like that, you’ve created a real-time dashboard! Easily view the advanced video analytics we covered earlier, including the number of views, followers, and more.
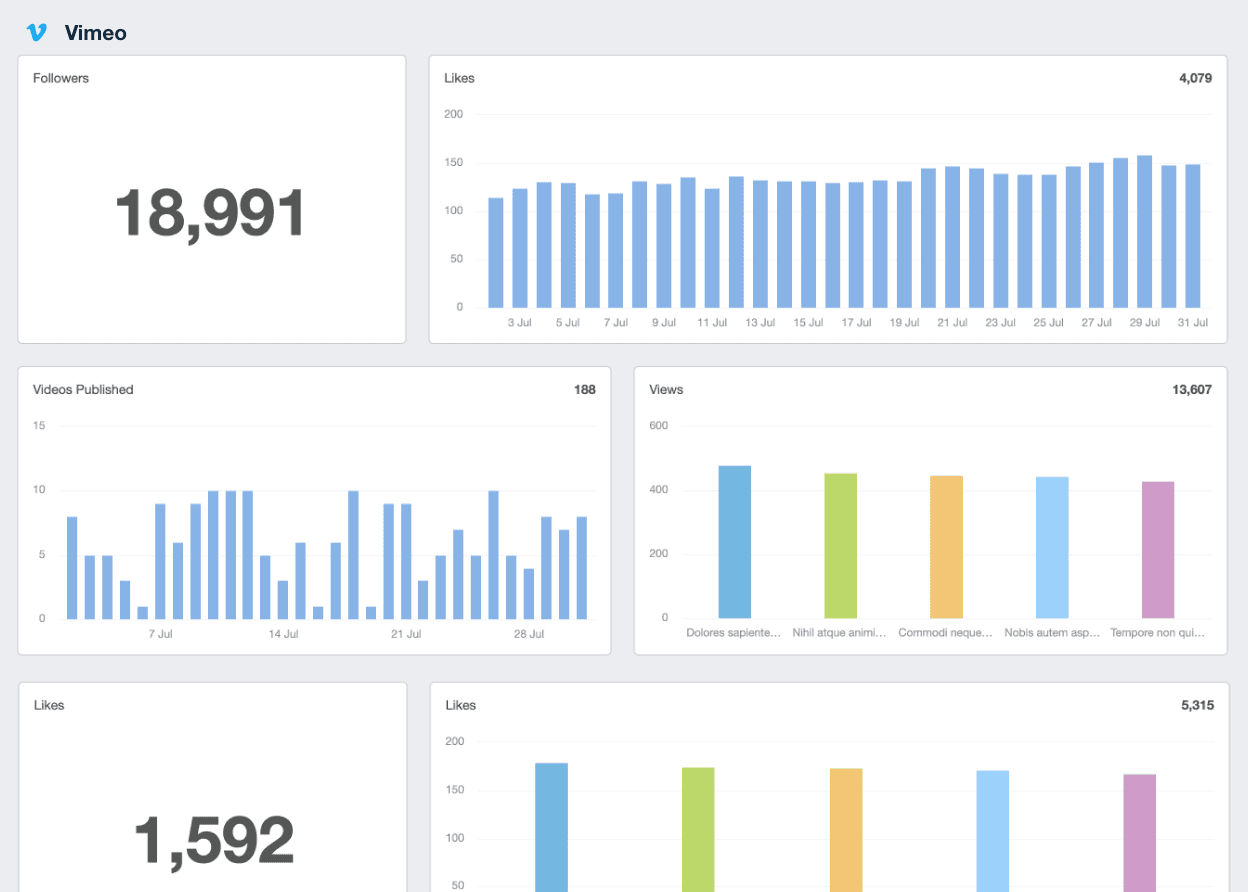
Show clients a visual overview of video performance. Get impressions and other key video analytics at the click of a button–try AgencyAnalytics today, free for 14 days.
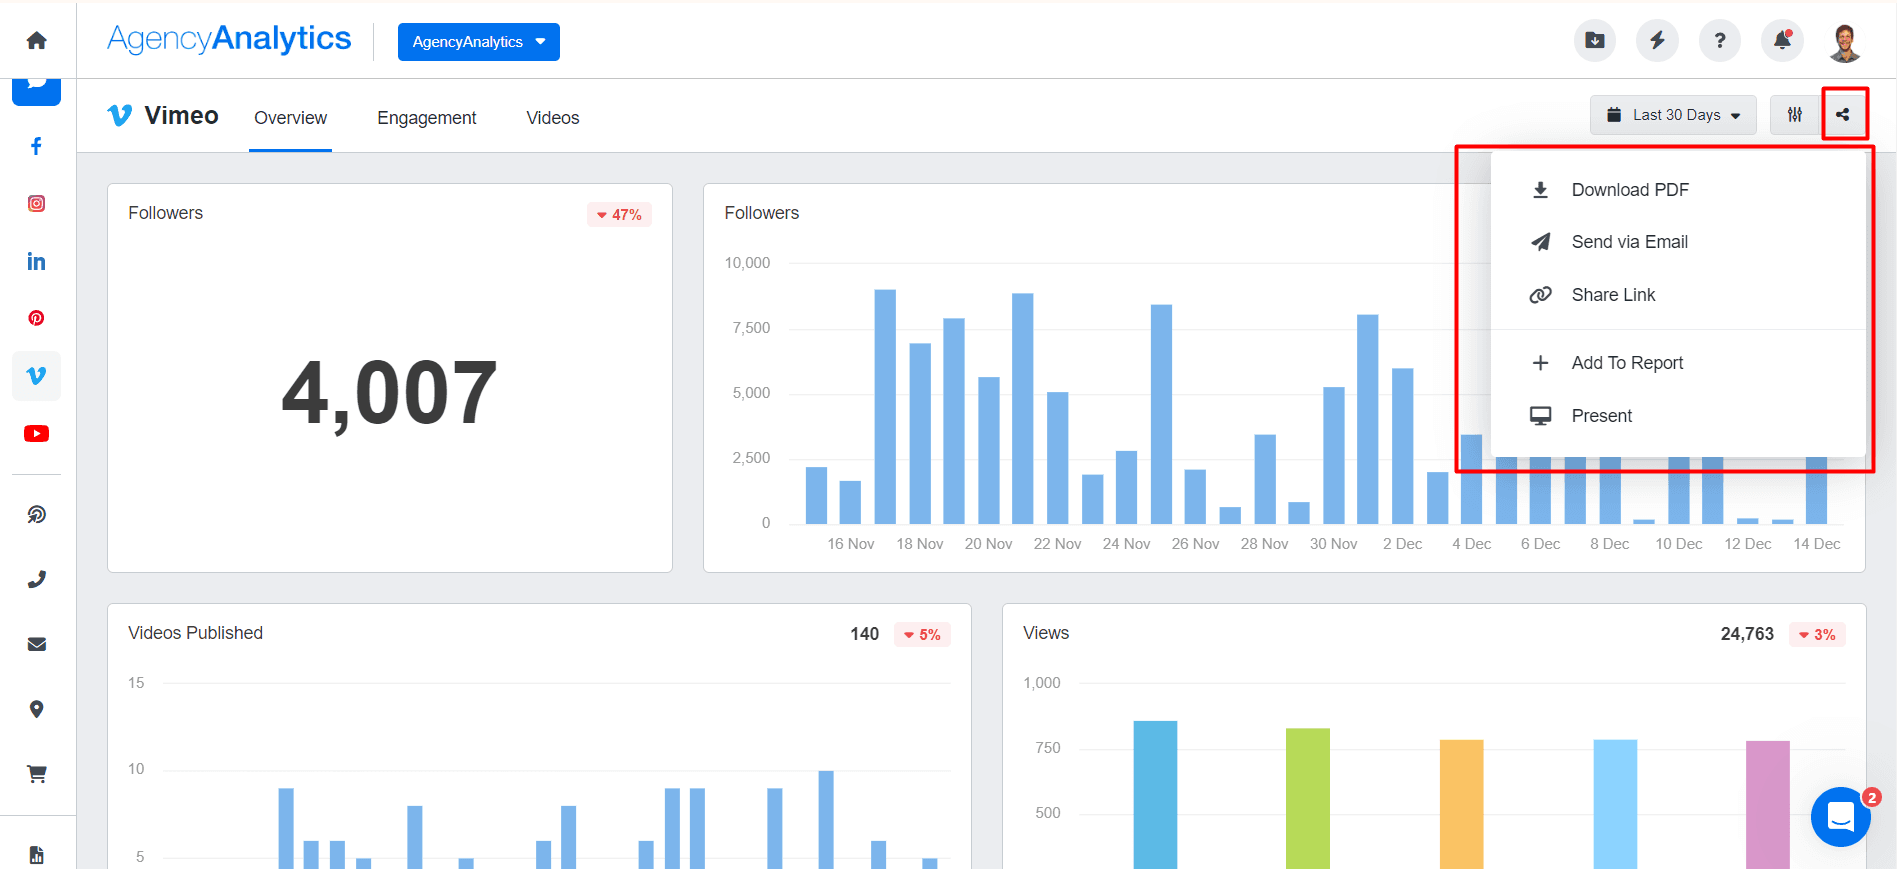
4. To export this dashboard as a report, hit the ‘Share’ button at the top right. From there, you’ll have the options to:
Create a downloadable PDF.
Generate a shareable link.
Send an email.
No matter what you choose, you have the ability to set a custom date range and report on video insights for a specific period.
Agency Tip: If you’re looking for a way to maximize efficiency, schedule automated reports in advance. That way, you won’t have to worry about missing client deadlines or manually sending emails.
Here’s a scenario to consider. What if your client has more than one social media campaign? Sometimes, presenting all their marketing data in a centralized format is better for an all-around analysis.
Not to worry–use AgencyAnalytics to:
Access a pre-built social media dashboard for real-time data tracking.
Use a readymade social media report template for quick turnarounds.
Create a custom dashboard or report to meet your unique needs.
Automatically generate a smart report based on a client’s data.
Create and customize your agency’s reporting as needed!
Automatically Stream Video Data Into a Central Reporting Hub
Vimeo stands out as an exceptional platform for creating top-notch videos with superior quality. From its detailed video analytics to customization options, this platform helps any client to make a memorable brand impression.
Measuring video performance shouldn’t be an afterthought, though. In fact, it’s the only way to replicate top-performing content and create impactful Vimeo strategies. Plus, your agency needs a central hub that houses marketing insights across other platforms. That way, you won’t have to worry about manual data tracking or wasting precious billable time.
That’s where a platform like AgencyAnalytics comes in. Use it to automate data retrieval across 80 platforms, create professional Vimeo reports, and so much more.
A centralized reporting platform like AgencyAnalytics allowed us to gain deeper insights by consolidating data from various sources. This holistic view empowered us to identify trends, uncover actionable opportunities, and make data-driven decisions. The ability to customize and brand our reporting also showcases our agency’s professionalism.
Joseph LeBlanc, Marketing Specialist at Studio Eighty-Eight
From delivering white-label reports to creating a real-time marketing dashboard, use AgencyAnalytics to streamline the reporting process. Try it today, risk-free for 14 days.

Written by
Faryal Khan is a multidisciplinary creative with 10+ years of experience in marketing and communications. Drawing on her background in statistics and psychology, she fuses storytelling with data to craft narratives that both inform and inspire.
Read more posts by Faryal KhanSee how 7,000+ marketing agencies help clients win
Free 14-day trial. No credit card required.


