- Chapter 1Why Is Client Reporting Important?
- Chapter 2Creating a Framework for Client Success
- Chapter 3What Is a KPI?
- Chapter 4The Key Differences Between KPIs vs Metrics
- Chapter 5Top Digital Marketing Metrics to Showcase Success
- SEO Metrics: Proving Long-Term Value
- Social Media Metrics: Measuring Engagement and Influence
- Paid Advertising Metrics: Maximizing Spend and Impact
- Ecommerce Metrics: Tracking Revenue and Purchase Behavior
- Email Marketing Metrics: Measuring Direct Response and Retention
- Reputation Management Metrics: Tracking Trust and Visibility
- Sales Metrics: Connecting Marketing to Revenue
- Local Marketing Metrics: Measuring Community Impact
- Website Analytics Metrics: The Hub of Digital Performance
- Bring It All Together With the Right Metrics & Digital Marketing KPIs
- Chapter 6What To Include in Client Reports
- Chapter 7Using Data Storytelling in Client Reports
- Chapter 8How To Use Automated Client Reporting To Reclaim Billable Hours
- Chapter 9Advanced Client Reporting Strategies & Best Practices
- Chapter 10Buying vs. Building a Reporting Platform
When onboarding a new client or building a new reporting system, it’s tempting to include every available data point just to cover your bases. But too much data often backfires. Instead of showcasing your agency’s value, it overwhelms the client—and distracts from what matters.
That’s why choosing the right digital marketing metrics by channel is key. When you align reporting with your client’s goals, you create clarity. You show progress, spot problems early, and spark better conversations about strategy. Most importantly, you help your clients understand the direct impact of your work.
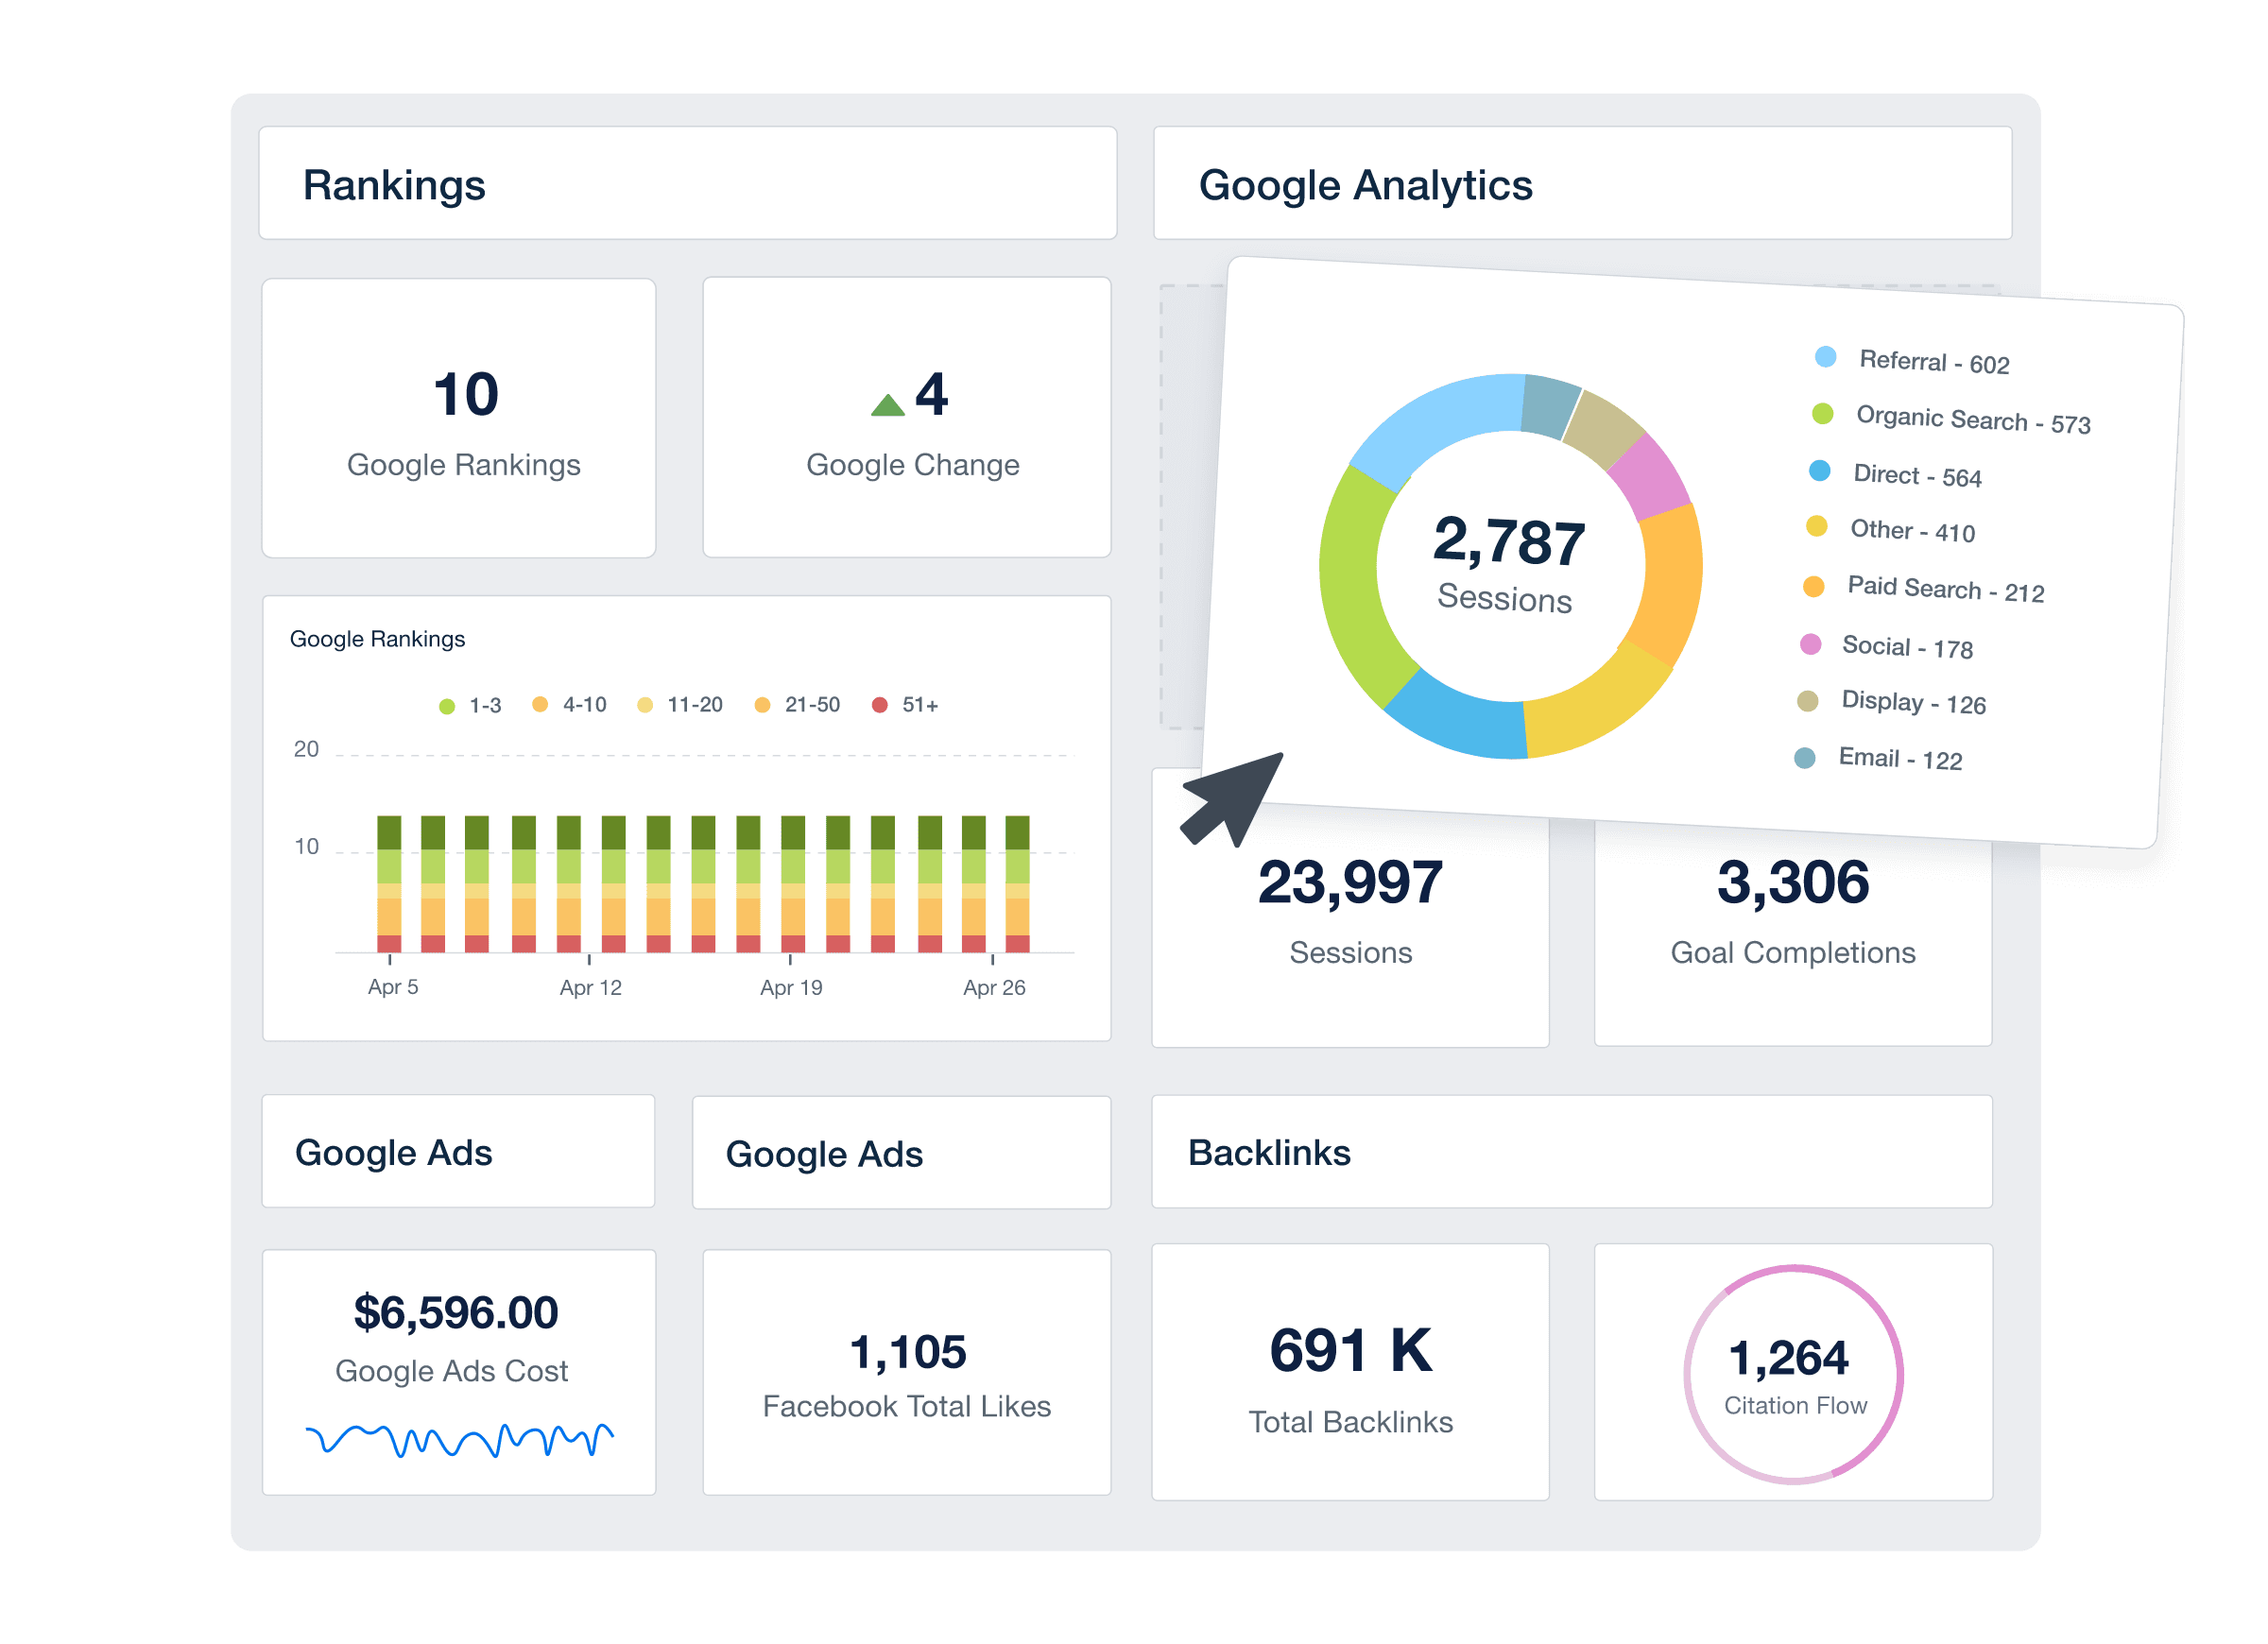
As covered in previous chapters, key performance indicators (KPIs) represent strategic goals, while metrics are the data points that support them. In this chapter, we’re breaking down the most important digital marketing metrics by channel to help you focus your reporting—whether you’re managing a full-service retainer or a single-channel campaign.
However, metrics don’t exist in a vacuum. The right ones depend on the channel, the campaign, and your client’s desired outcome. As one agency leader put it:
The most important metric depends on your goal. If you want to raise brand awareness, reach might be most important. If you want to drive website traffic, then link clicks would be. The best thing about the variety of metrics available is that you can use the platform to drive a whole range of business goals.
Ellen Hedley, Co-Founder, Vida Creative
Instead of tracking everything, track what matters. Let’s examine the top digital marketing KPIs and supporting metrics by channel so your reports stay lean, relevant, and action-focused.
SEO Metrics: Proving Long-Term Value
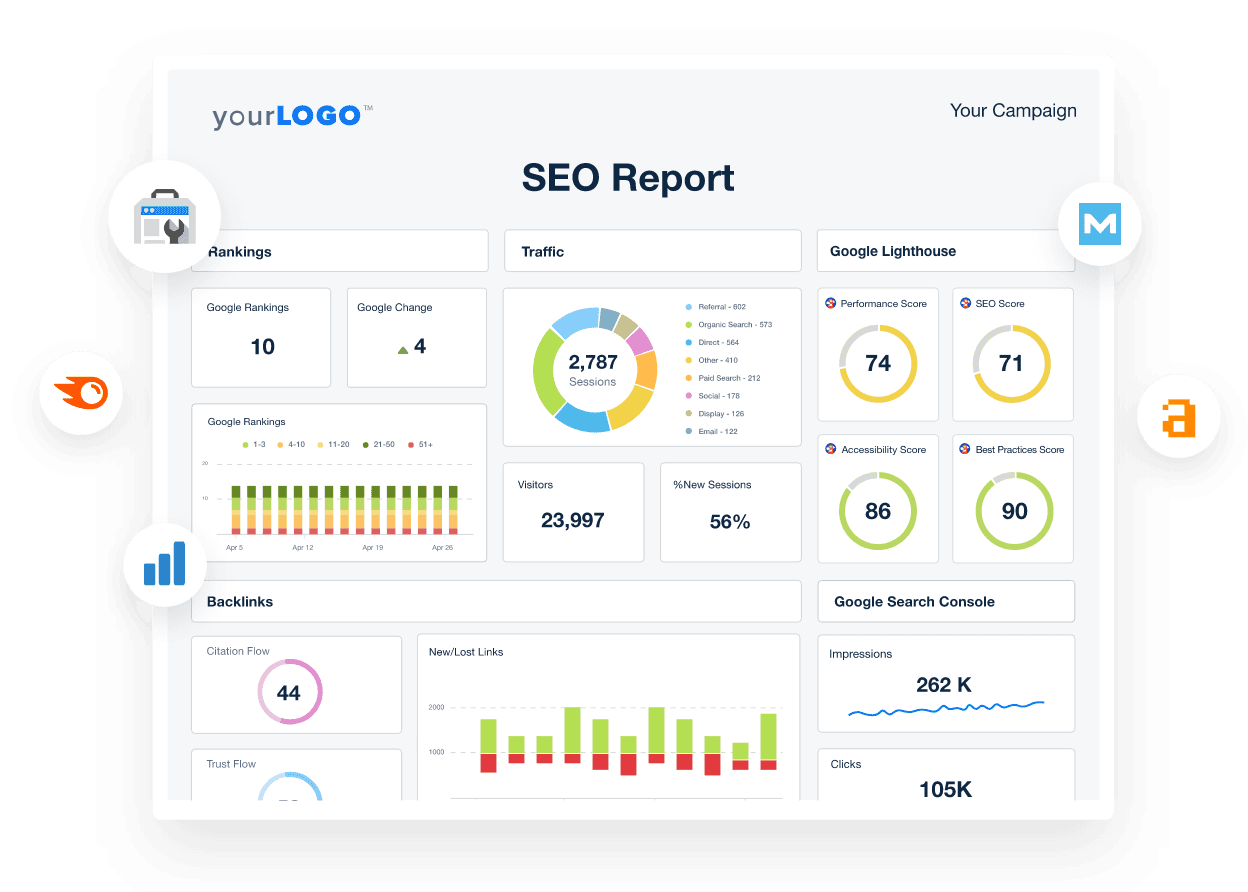
Search engine optimization (SEO) is a long game. But when done right—and reported well—it becomes one of the most cost-effective ways to generate high-quality, organic traffic over time.
Clients may not always understand the lag between effort and results, so focusing on SEO metrics that show clear progress and strategic impact is essential.
Here are the most important SEO metrics to track using your SEO reporting software:
1. Organic Traffic
How many website visitors are coming from unpaid search results? This is the foundation of SEO performance and helps clients see the impact of your digital marketing efforts over time.
Spend time making sure you're tracking the ‘right’ thing. A lot of clients track tons of KPIs, but they can’t really explain why those metrics matter. The education process usually uncovers what the client actually values.
Ryan Burch, Owner, Tobie Group
2. Keyword Rankings
Track how the client’s target keywords perform in search engine results pages (SERPs). Show ranking positions and movement over time to help connect content and optimization work to visible progress.
3. Click-Through Rate (CTR)
This tells you how many users saw the client’s listing in search results and clicked to their site. Low CTRs might signal weak meta titles, descriptions, or irrelevant content.
4. Bounce Rate
This metric tracks users who visit the site but leave without interacting. A high bounce rate could indicate a disconnect between search intent and on-page experience—or the page simply isn’t relevant to the query.
5. Backlinks & Referring Domains
Search engines see backlinks as a vote of confidence. Tracking both total links and unique domains helps show the authority and reach of your client’s content strategy.
6. Search Visibility & Domain Authority Scores
Some tools calculate a “visibility score” based on keyword rankings and search volume. Other tools provide domain authority scores based on the website’s backlink profile. These scores provide a high-level, directional snapshot of how much space your client owns in the SERPs.
7. Site Performance Scores
Search rankings and user experience both rely on how well a site performs under the hood. Metrics from tools like Google Lighthouse evaluate key areas like load speed, accessibility, and interactivity. These scores help identify technical issues that may be hurting SEO and frustrating users.
8. Organic Leads, Orders, and Revenue
Beyond traffic volume, reporting on conversions from organic sources—such as form fills, product orders, or generated revenue—helps demonstrate the direct business value of SEO. If you have goal tracking or ecommerce attribution in place, these metrics tie SEO more clearly to ROI and overall marketing success.
Optional: Local Pack Appearances
If your client has a physical location, track how often they appear in Google’s local listings—especially for location-based keywords.
When presenting SEO metrics, tie each back to client goals like website traffic, lead generation, or brand visibility. And remember—SEO metrics aren’t just numbers, they’re indicators of marketing effectiveness and long-term growth potential.
Client feedback plays a crucial role in shaping our reporting process. We regularly ask clients what data they find most valuable and what aspects of the reports they’d like improved. Based on their input, we customize dashboards, adjust visualizations for clarity, and even automate insights that directly address their pain points.
Shay Cohen, CEO, SFB Digital Marketing
Social Media Metrics: Measuring Engagement and Influence
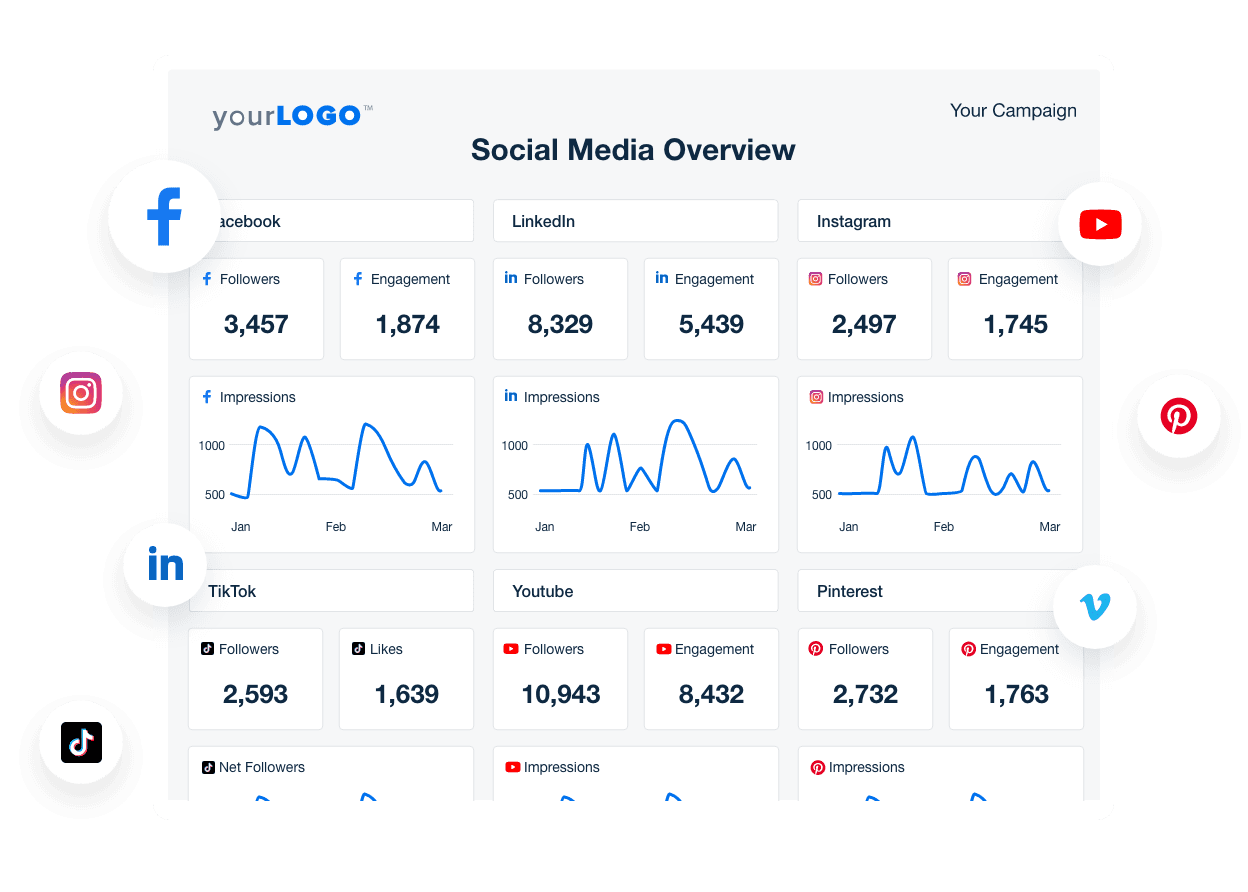
Social media is often the face of your client’s brand. It builds relationships, increases visibility, and drives measurable outcomes when aligned with strategy. But likes and followers rarely tell the whole story.
The most effective social media reporting connects platform activity to tangible business goals using the right social media metrics. Here's what to include in your client reports when using a social media reporting tool:
1. Engagement Rate
Likes, comments, shares, and saves—these interactions signal how well the content resonates with the audience. Engagement rate adjusts for audience size, giving a more accurate view of content performance across platforms.
It’s a journey we have to take clients on with us, to help them understand that likes don’t necessarily pay the bills! This is where we can show them that other metrics might be more critical in measuring which goals Facebook is helping them achieve.
Ellen Hedley, Co-Founder, Vida Creative
2. Reach
How many unique users saw your client’s content? Reach is essential for brand awareness campaigns, particularly when launching a new product, promotion, or business.
3. Click-Through Rate (CTR)
This metric shows how often people took action by clicking on a post link. A strong CTR signals content relevance and alignment with your client’s marketing funnel.
4. Follower Growth
While not a standalone success metric, steady audience growth often indicates increased interest in your client’s content and brand.
5. Conversions
Whether it’s newsletter signups, purchases, or booked calls—track how many social media users completed a desired action. Tie these back to business outcomes wherever possible.
If the goal is to increase brand awareness, then impressions or reach become extremely important. If sales are the end game, then ROAS is king.
Sam Yielder, Paid Media Executive, Squidgy
6. Post Frequency & Consistency
This isn't always client-facing, but tracking consistency helps correlate content output with engagement and results—particularly for clients investing in organic strategies.
Whether your client is focused on community building, lead generation, or brand visibility, tailor social media reporting to the specific metrics that reflect their objectives. That’s how you move from vanity reporting to strategic insight.
Show a new client an example report when you onboard them. This will ensure they know exactly what they will be receiving when it comes to reporting. If they want any specific metrics added, they will say so when you show them the example report, and it saves a lot of time editing any further reports.
Guy Hudson, Founder, Bespoke Marketing Plans
Paid Advertising Metrics: Maximizing Spend and Impact
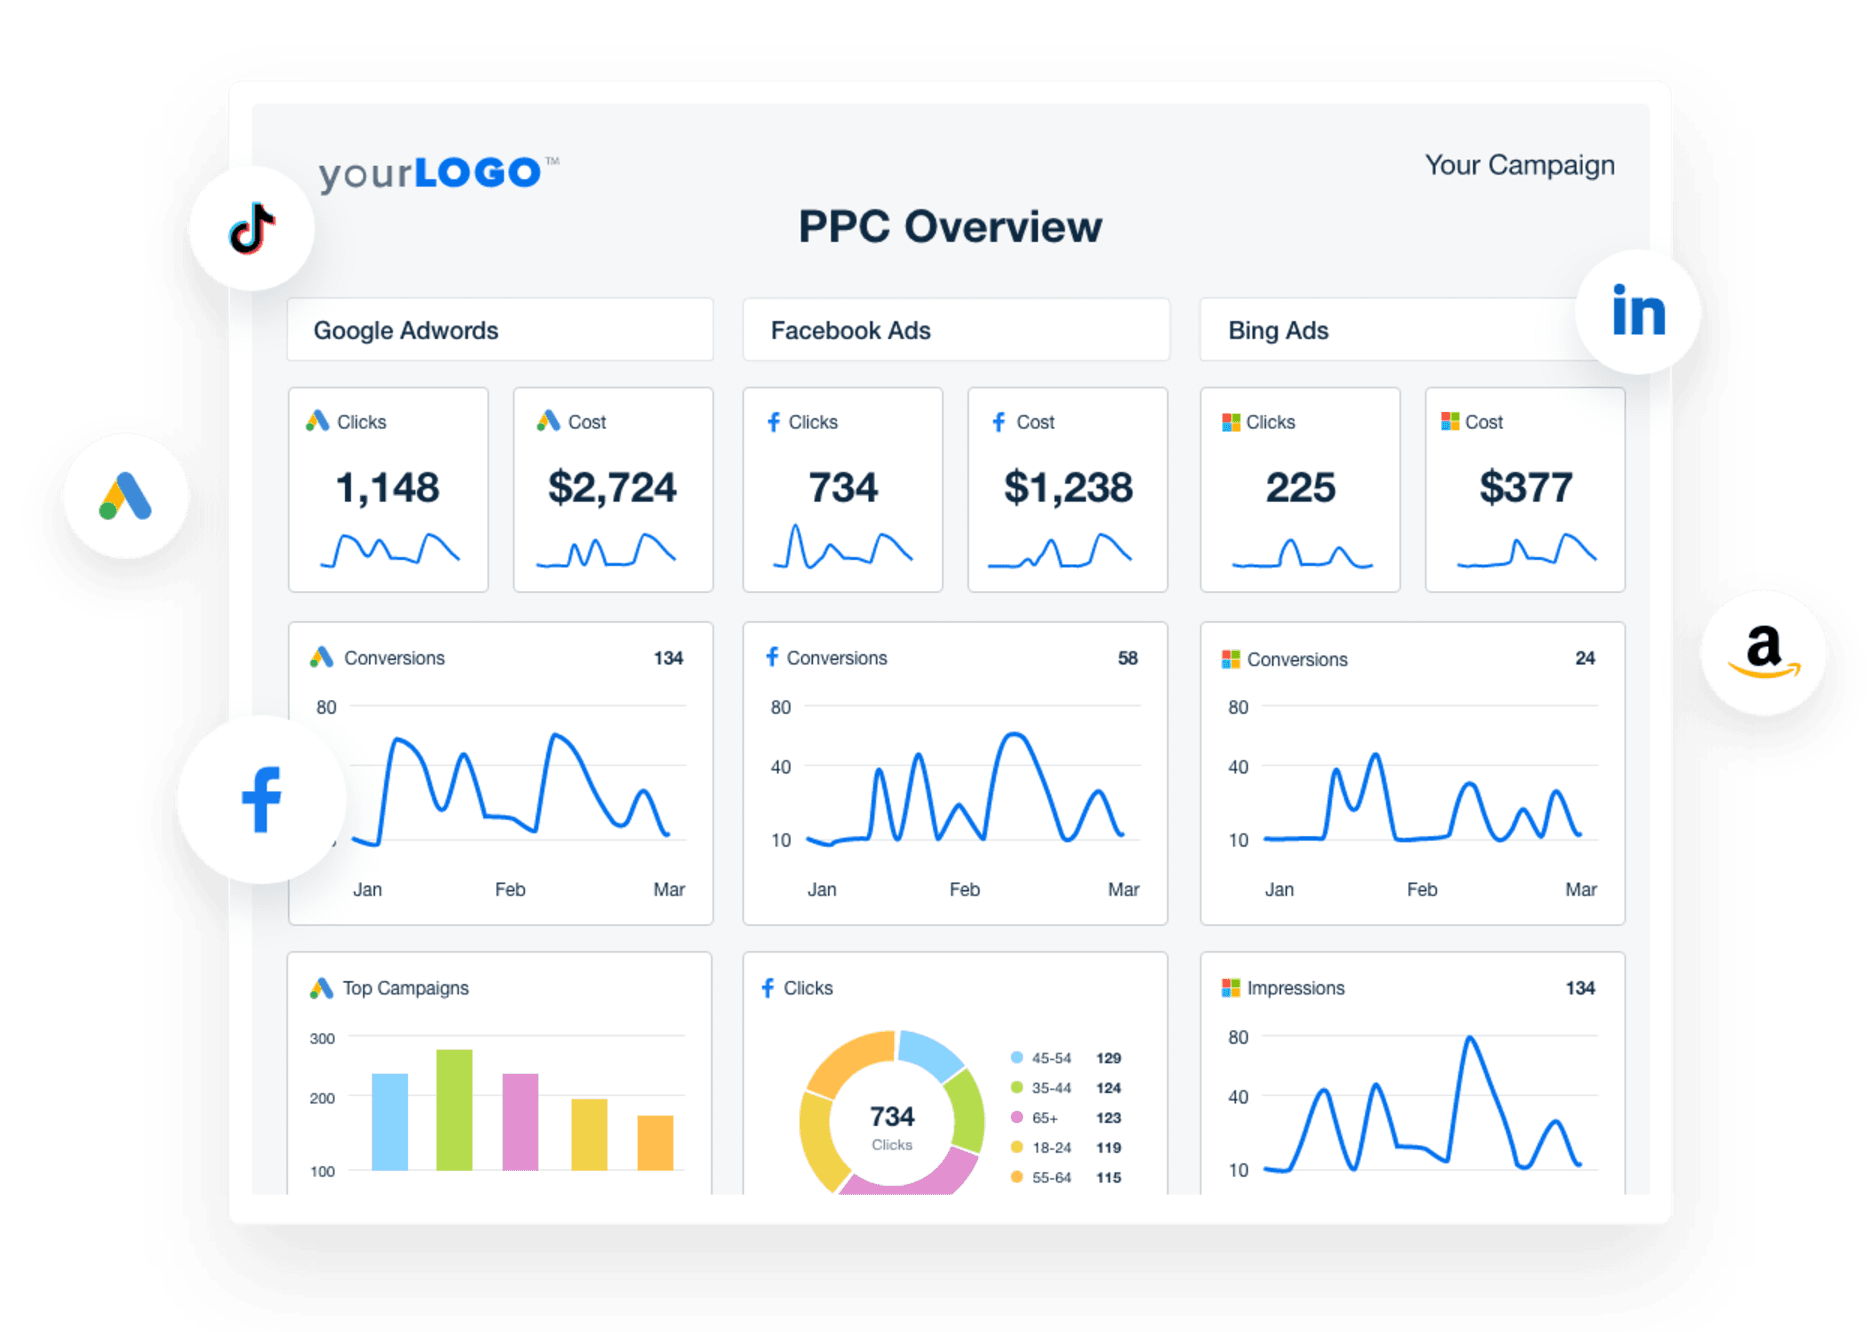
Paid advertising gives clients a direct, scalable path to reaching their target audience. But it also comes with pressure: every dollar of ad spend needs to prove its worth. That’s why reporting on PPC metrics should focus on cost efficiency, return on investment, and the actions that move potential customers through the funnel.
Below are the key paid advertising metrics to focus on within your PPC reporting software:
1. Return on Ad Spend (ROAS)
This is often the ultimate metric for advertising campaigns. ROAS tells you how much revenue a campaign generated for every dollar spent. Few metrics are more persuasive if the goal is driving sales.
Clients typically care most about ROAS, CPA, and conversion rates for both Facebook and Google Ads. They also focus on CTR and CPC to gauge engagement and efficiency.
Sam Yielder, Senior Paid Media Manager, Squidgy
2. Cost Per Click (CPC)
CPC measures how much you're paying for each click on your client’s ad. It’s an essential indicator of bidding efficiency and helps assess whether the ad campaign is cost-effective relative to your client’s overall goals.
3. Cost Per Lead (CPL)
Particularly relevant for lead generation campaigns, CPL helps assess how effectively a campaign delivers qualified prospects. Be sure to compare CPL across channels and over time to track efficiency.
4. Cost Per Acquisition (CPA)
Also known as customer acquisition cost (CAC), this metric shows how much it costs to acquire a paying customer. It’s vital for long-term planning and helps your client assess the overall cost-effectiveness of their marketing campaigns.
The most predominant PPC metrics are cost per lead and cost per acquisition. CPA is the most challenging because it requires well-documented lead records and CRM integration—but it gives you a clear picture of performance across the MQL–SQL journey.
Ryan Kelly, CEO, Pear Analytics
5. Impressions
Impressions measure how often your ads are shown across platforms like Google Ads, Facebook, and LinkedIn. While they don’t indicate engagement or clicks on their own, impressions are a valuable metric for understanding campaign reach, brand exposure, and share of voice—especially in the awareness stage of the marketing funnel.
6. Click-Through Rate (CTR)
CTR helps measure ad relevance and performance. A low CTR may indicate weak creative, poor targeting, or misaligned messaging.
7. Conversion Rate
This tracks how many users took a desired action after clicking on an ad. Whether it's purchases, signups, or form fills, the conversion rate shows how effectively the landing page supports campaign goals.
PPC goals are created by determining what the client needs to grow and defining metrics within the dashboard to match it. We use close rate, website traffic, and conversion actions to find the whole picture and link it to overall lead and revenue growth.
Rebecca Pena, Marketing Director, Investigator Marketing
8. Ad Spend & Budget Pacing
Always report on how much has been spent, how it aligns with the budget, and how performance tracks mid-campaign. Clients want to know they’re spending wisely—and that their budget is optimized.
Paid ads are often under a magnifying glass, especially when budgets are tight. Help your clients see more than just clicks and impressions—show them how your strategy connects advertising costs to meaningful outcomes.
Building strong relationships with our clients has always been at the heart of what we do. We take the time to understand their unique needs and goals, and work with them to create customized solutions that deliver real results.
Adam Binder, Founder + CEO, Creative Click Media
Ecommerce Metrics: Tracking Revenue and Purchase Behavior
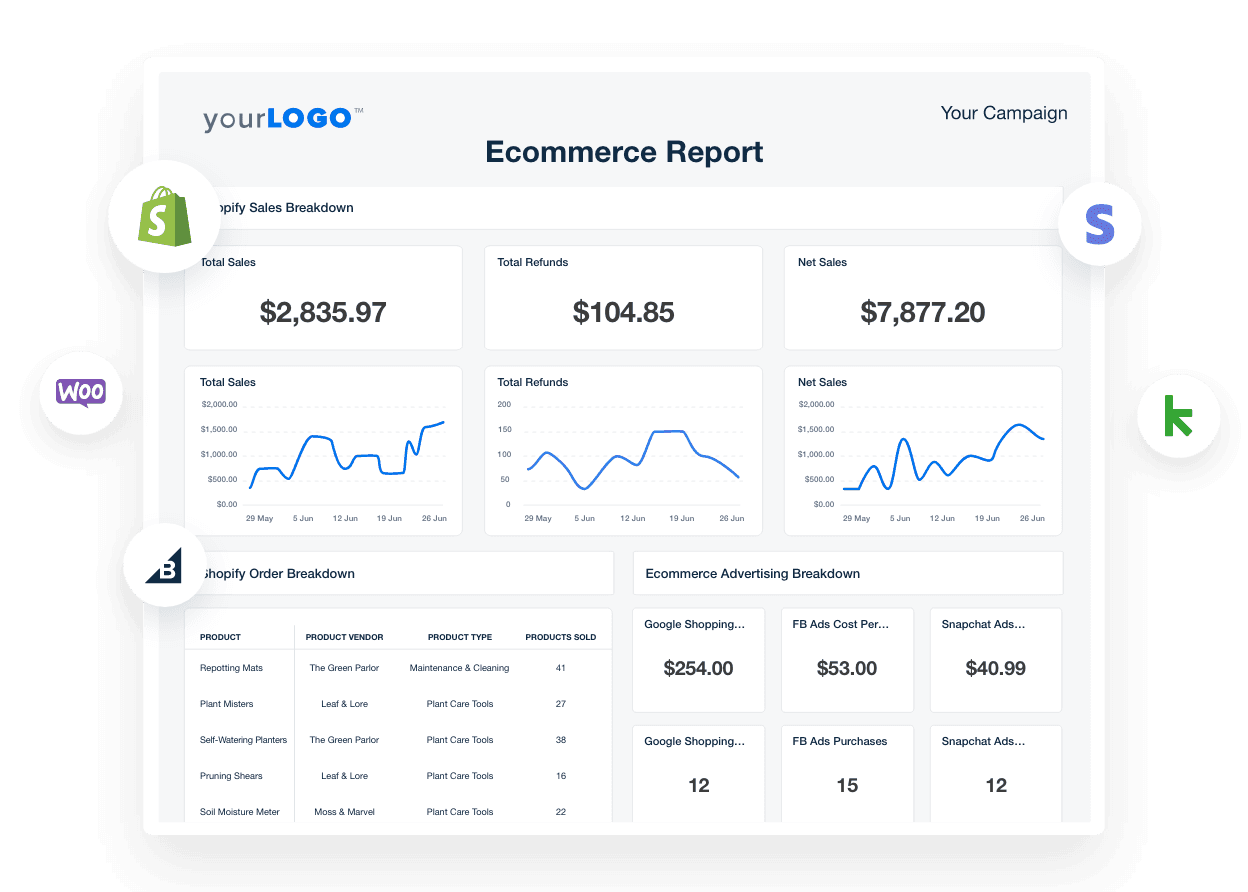
Ecommerce reporting is where performance meets profit. Your clients aren’t just looking at ecommerce metrics to understand engagement or visibility—they want to see how their marketing efforts translate into real revenue. The most effective reports go beyond surface-level metrics to show patterns in customer behavior, product interest, and sales performance.
Here are the most important ecommerce metrics to track using ecommerce reporting software:
1. Sales & Revenue
The most straightforward metric is total sales within the reporting period. Revenue is the anchor for nearly every other ecommerce KPI and offers a baseline for measuring growth.
2. Average Order Value (AOV)
This shows the average amount a customer spends per transaction. It helps your client understand the value of each sale and spot opportunities to increase revenue through bundling, upsells, or cross-sells.
3. Conversion Rate
What percentage of site visitors complete a purchase? This is one of the clearest indicators of how well your client's site turns interest into action.
The cost per sale matters more than the cost per click. Focus on cost per action. Once you know your target cost per sale, you’ll know which keywords are achieving it and which aren’t.
Matt Beech, Marketing Director, patch.marketing
4. Cart Abandonment Rate
A high abandonment rate reveals friction in the checkout process. Whether shipping costs, confusing UX, or slow load times—this metric helps guide conversion optimization efforts.
5. Product Views & Top Sellers
Which products are driving the most interest? Tracking product-level performance helps inform ad targeting, inventory decisions, and featured promotions.
6. Returns & Refunds
Track the volume and value of returned items to understand how much revenue is being reversed post-purchase. This helps assess product satisfaction, fulfillment accuracy, and overall customer experience.
7. Customer Acquisition Cost (CAC)
How much does it cost to acquire a new customer? This metric is critical for understanding the efficiency of your client’s digital marketing campaigns—and determining how much they can afford to spend to scale.
If sales are the end game, then ROAS is king. But different businesses will value different metrics. An ecommerce brand will be hyper-focused on cost per purchase and add-to-carts.
JC Polonia, Founder, Digitality Marketing
Optional: Customer Lifetime Value (CLV)
While harder to calculate upfront, CLV is essential for understanding the long-term return on marketing spend. Comparing CAC and CLV helps determine sustainable growth strategies.
With ecommerce clients, performance metrics and profit are closely linked. Prioritize KPIs that reflect bottom-line impact—and help your clients see how each part of the funnel contributes to the sale.
Remember what your end goal is. There is no point in tracking ego-based metrics irrelevant to your campaign. Focus on what you are trying to achieve and educate your clients on why.
Bri Bernard, Director, Studio Blackardt
Email Marketing Metrics: Measuring Direct Response and Retention
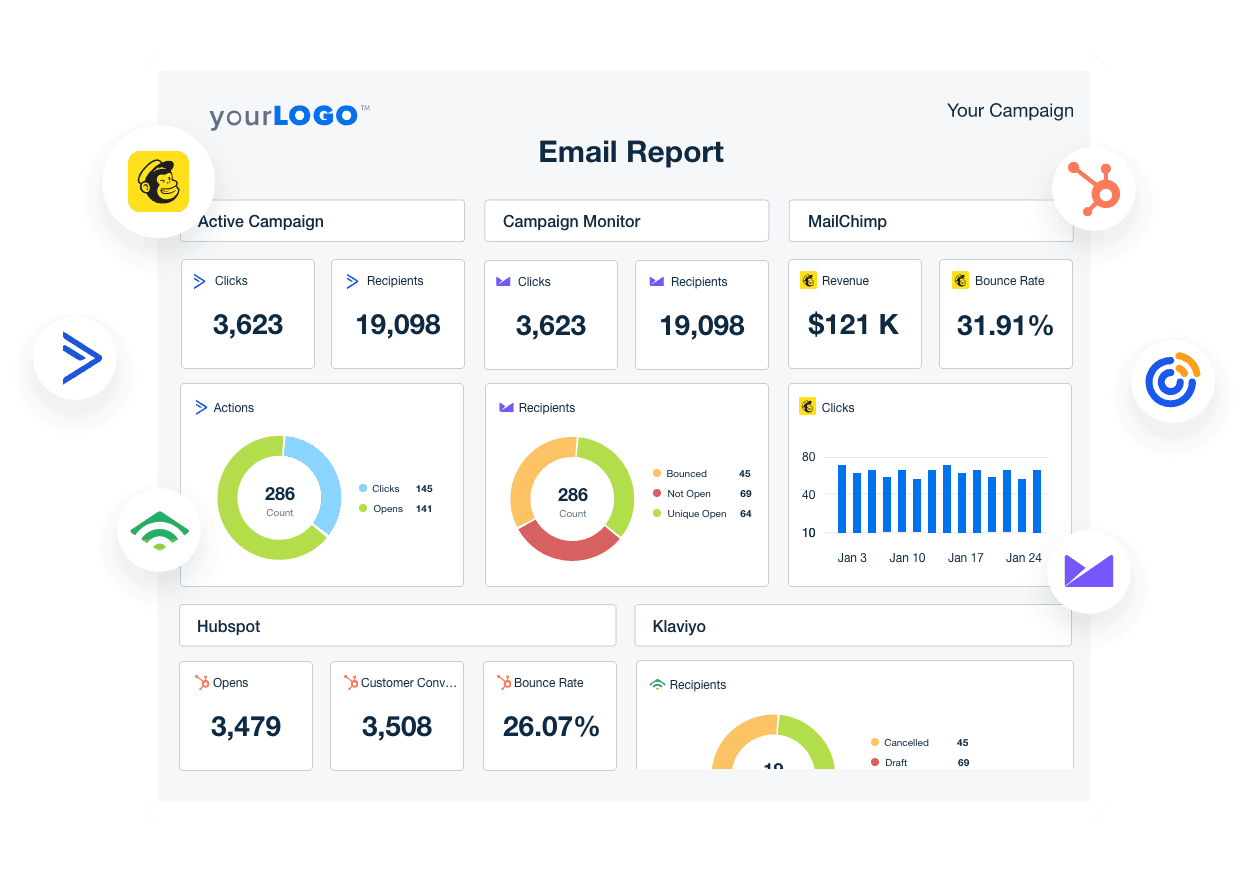
Email marketing remains one of the highest-ROI digital channels. Whether your client is nurturing leads, retaining customers, or promoting time-sensitive offers, reporting on email marketing metrics helps them understand what’s working and needs adjustment.
Below are the most critical email marketing metrics to include in your reports:
1. Open Rate
While now more of a directional metric (especially with privacy updates), open rate still gives a general sense of subject line effectiveness and subscriber interest.
2. Click-Through Rate (CTR)
This shows how many people engaged with the content by clicking a link. It’s a strong indicator of email relevance, design, and value.
Click-through rate is essential for email marketers. It shows you how many people are interested in your content and want to learn more about what you’re offering.
Bryan Lozano, VP of Operations, Ad-Apt
3. Conversion Rate
CTR tells you who clicked—but conversion rate tells you who took action. This metric connects email performance directly to lead generation or revenue, depending on the campaign goal.
Conversion rates show how successful your emails are at actually generating sales and revenue, which is incredibly important.
Bryan Lozano, VP of Operations, Ad-Apt
4. Bounce Rate
Hard and soft bounces often signal issues with list quality or sending practices. High bounce rates may impact deliverability over time, so monitoring and addressing them regularly is important.
Bounce rate is important to keep an eye on, as it can lead to delivery issues down the line. Always sanitize your lists.
Bryan Lozano, VP of Operations, Ad-Apt
5. Unsubscribe Rate
Every email will lose some subscribers, but spikes in this metric may indicate content fatigue or misaligned messaging.
6. Revenue per Email / ROI
If your client tracks purchases through email campaigns, this metric clearly shows cost-effectiveness and impact on the bottom line.
We always measure ROI per marketing channel—and email is one of the most linear to measure. You always want to make sure the aggregate of your marketing efforts is leading to a net positive ROI.
Bryan Lozano, VP of Operations, Ad-Apt
Whether you’re running drip sequences, promotional blasts, or newsletters, email metrics are key to optimizing performance and maintaining customer relationships. Focus your reporting on the KPIs that align with your client’s objectives—lead nurturing, sales, or re-engagement.
Hone in on the KPIs that your clients care most about and set benchmarks throughout the campaign. Reporting can be overwhelming; find the happy medium of including the metrics that matter without incorporating too many additional widgets that are a distraction to the true goals of the campaign.
Lily Zimmel, Agency Director, Envida
Reputation Management Metrics: Tracking Trust and Visibility
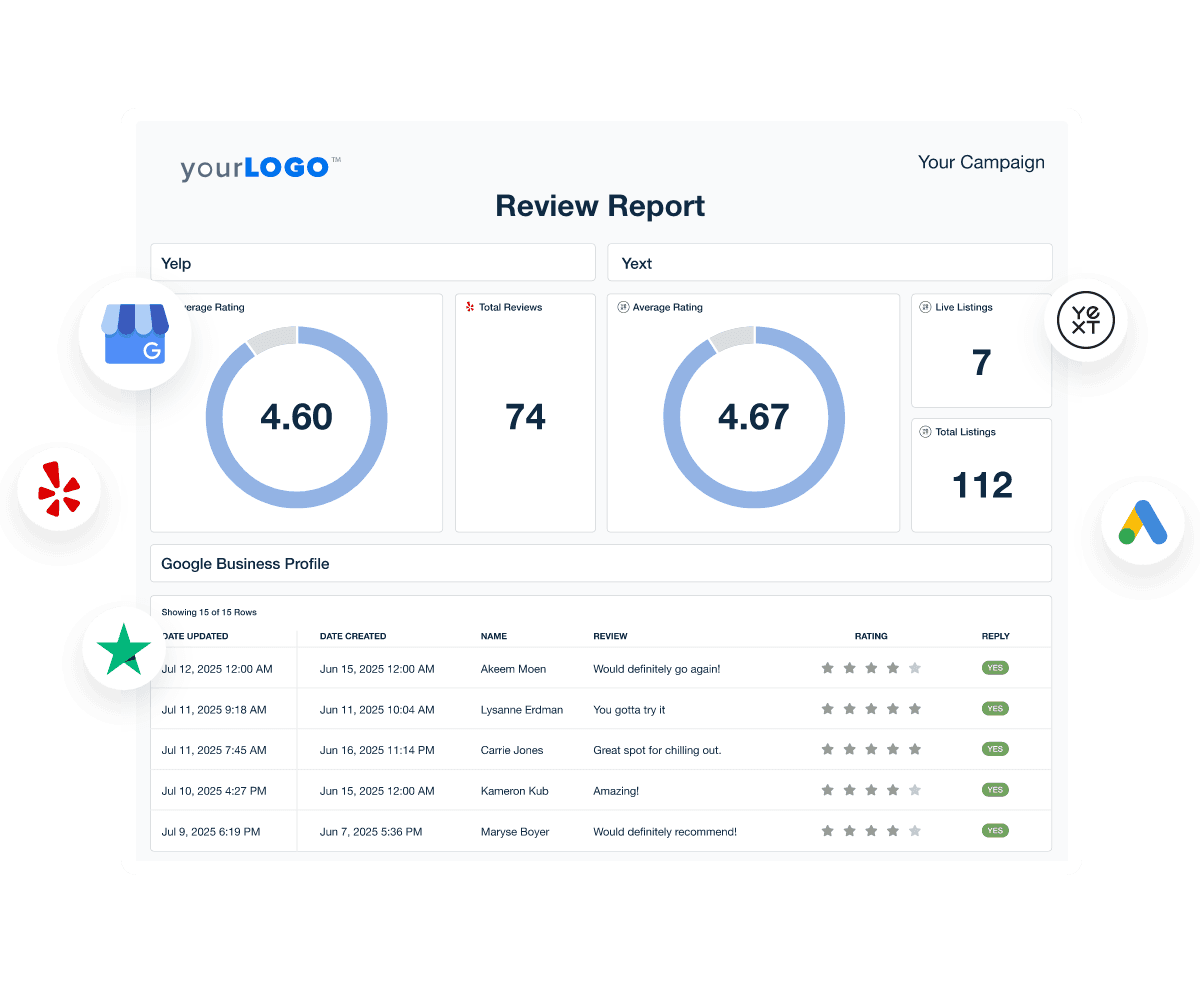
A strong online reputation helps build trust, increase conversions, and improve visibility—especially for local businesses. Whether your client operates in one location or dozens, monitoring reputation metrics is essential to their overall marketing performance.
Here are the most important metrics to showcase using online reputation management reporting tools:
1. Review Volume
The total number of reviews across platforms like Google, Yelp, and Facebook is a powerful signal to search engines and potential customers. A steady stream of reviews shows activity and encourages engagement.
2. Average Star Rating
This simple but powerful metric significantly influences whether a potential customer chooses your client over a competitor. A strong rating boosts credibility, while a low one can be a red flag.
3. Review Sentiment
Use web analytics tools or integrations to track sentiment trends. Grouping reviews by positive, neutral, or negative keywords will help identify areas of strength—or uncover issues to address.
Without reviews, prospects don't know whether they should trust you or not. Positive reviews make your potential customers feel "warm and fuzzy" about choosing your business out of the pack.
Anya Curry, Owner, Ambidextrous Services
4. Response Rate
How quickly and frequently does your client respond to reviews? Active participation shows professionalism and customer care and may even influence star ratings over time.
5. Review Engagement Actions
Look beyond the review content and track what users do after reading them. Engagements like clicks to the website, call button taps, or requests for driving directions are high-intent signals. These interactions often indicate that a review helped influence the decision to engage with the business.
Optional: Net Promoter Score (NPS)
If your client uses customer surveys, NPS can offer a structured view of customer satisfaction and likelihood to refer.
Reputation metrics are often the first signals potential customers encounter. Help your clients track, maintain, and improve these metrics to build long-term trust and stay ahead of competitors in brand perception and search engine rankings.
Clients don't want to see seven reports, one per platform. They want everything condensed into one, easy-to-read report, where they can view all of their most significant marketing data in one place.
Graham Lumley, Director of Growth Marketing, Blackhawk
Sales Metrics: Connecting Marketing to Revenue
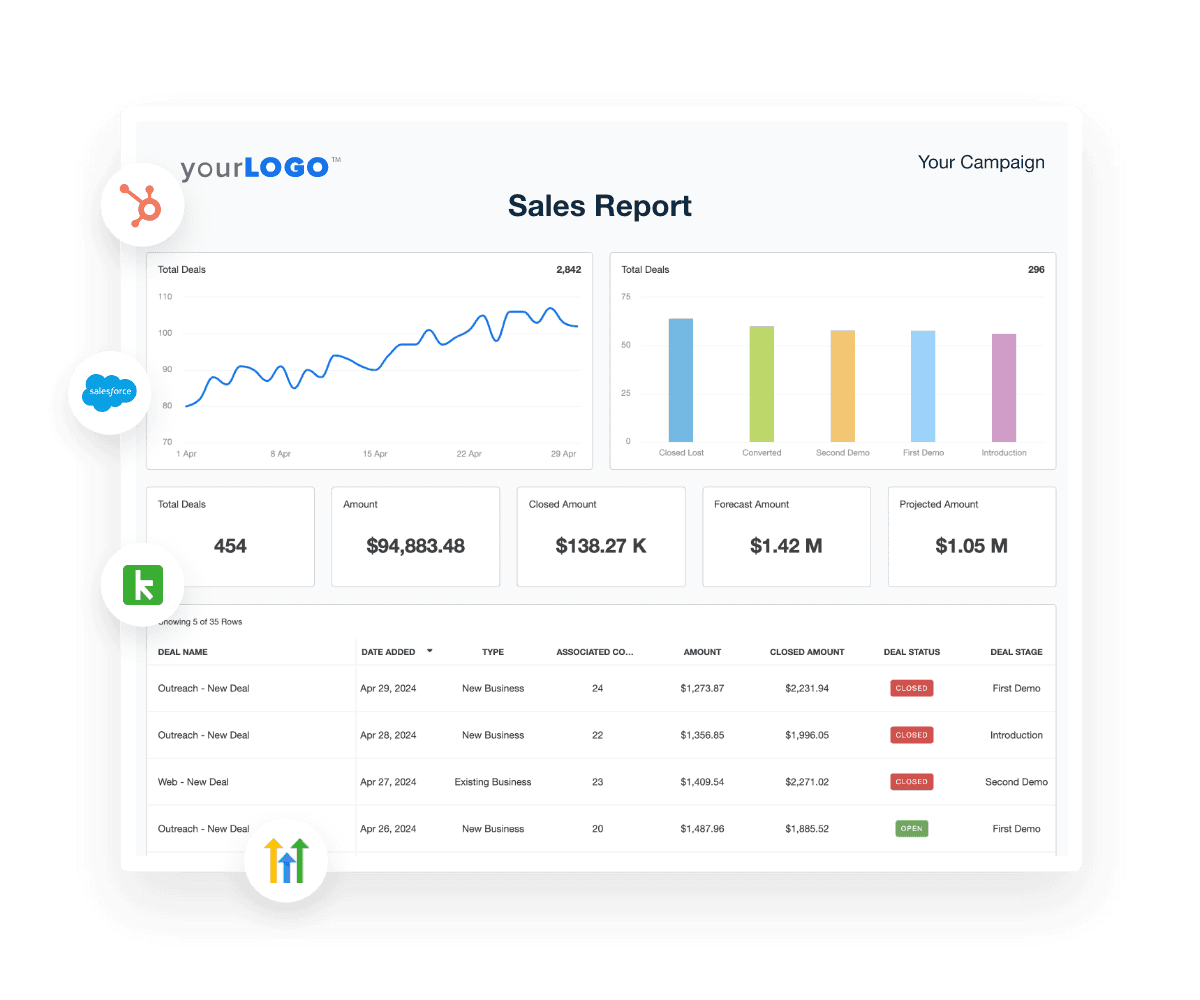
Your clients want to know if their marketing initiatives are driving business growth. Tracking sales metrics bridges the gap between digital marketing performance and actual revenue, giving clients confidence that your efforts are moving the needle.
Whether you’re reporting on inbound leads, ecommerce sales, or B2B pipeline health, these are the key sales performance metrics to include:
1. Leads Generated
Show how many new prospects have entered the sales funnel during the reporting period. When paired with source attribution, this metric helps demonstrate the impact of specific marketing campaigns.
2. Marketing Qualified Leads (MQLs)
Not all leads are equal. Reporting on MQLs shows how many prospects meet the criteria for sales-readiness, and how well your content marketing efforts or ad campaigns attract your client’s ideal customer.
3. Deals Closed / Customers Acquired
This metric connects the dots between traffic, leads, and actual paying customers. It's a powerful way to prove marketing effectiveness, especially when tied back to specific campaigns or channels.
4. Sales Funnel Conversion Rates
Track performance at each stage of the funnel, such as lead-to-MQL, MQL-to-SQL, and SQL-to-close. This helps identify bottlenecks and guide strategic adjustments in sales and marketing flow.
We'll help set up the flow of leads into the CRM and mark the leads with the channel and even campaign source. Once those leads are closed, we can roll up to a cost per acquisition figure that is reasonably accurate. Now we can see what levers we can pull across the entire MQL-SQL journey, whether it be better landing pages and conversion rates, or better close ratios on SQLs.
Ryan Kelly, CEO, Pear Analytics
5. Customer Retention Rate
A sale isn’t the end of the story. Clients who focus on recurring revenue components—like subscriptions, services, or retainers—should track how well they retain existing customers over time.
6. Monthly Recurring Revenue (MRR)
For SaaS and subscription-based clients, MRR is the gold standard for growth. Tracking it over time gives a clear picture of momentum and helps forecast future performance.
7. Revenue Churn
This shows how much recurring revenue was lost during the period, helping clients spot gaps in their customer journey or product offering.
Sales metrics help quantify the full value of marketing—from initial touchpoint to closed deal. When you connect your campaigns to real revenue outcomes, you move from marketing vendor to strategic growth partner.
It's essential to show value to clients with key metrics that matter, business owners & marketing managers want to see the results simplified to measure marketing against business growth/sales.
Pat Akkawi, Director, The Marketing Co
Local Marketing Metrics: Measuring Community Impact
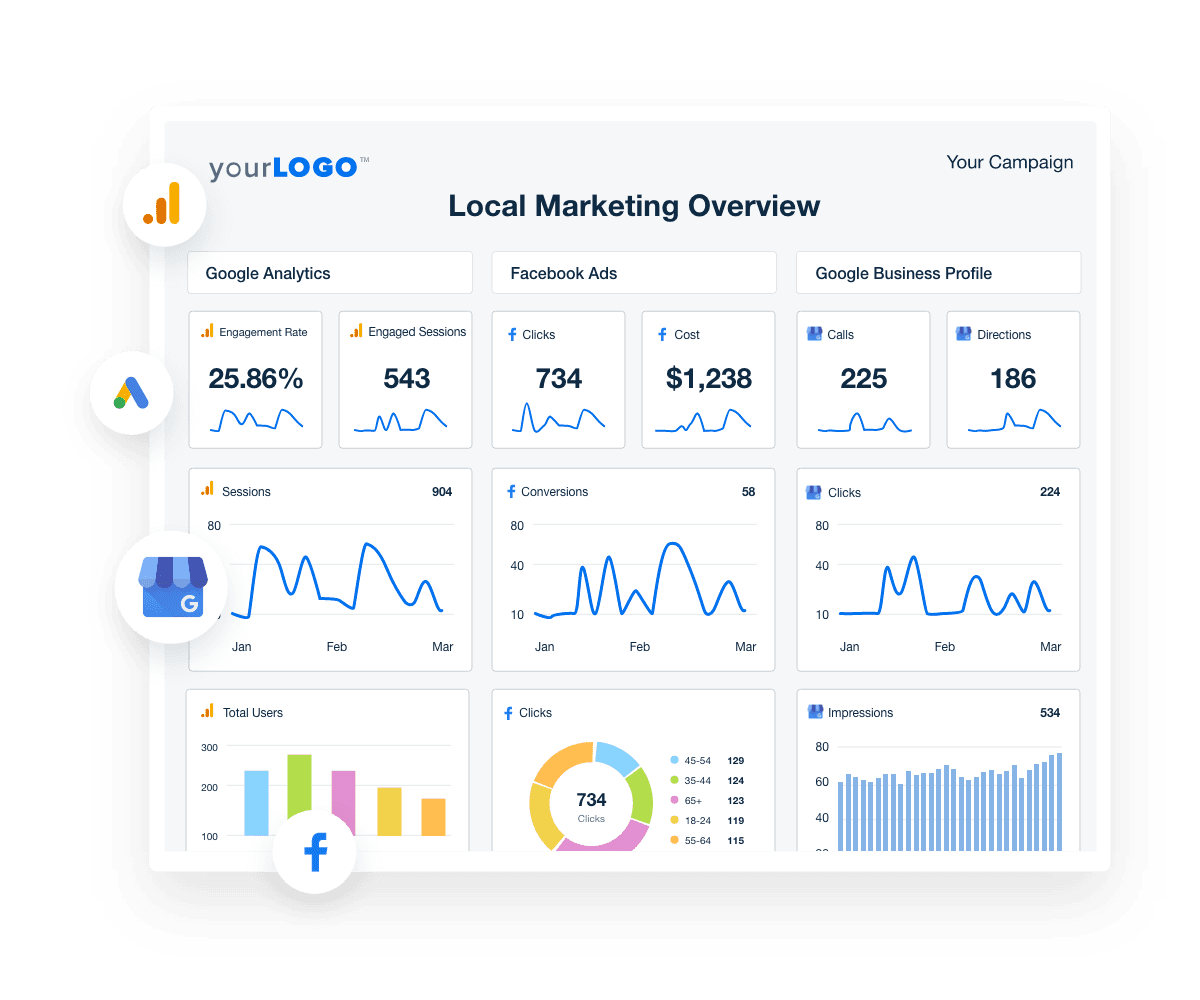
Local marketing metrics help answer a critical question for agencies working with brick-and-mortar businesses: Are we driving foot traffic and local visibility? These data points often come from sources like Google Business Profile (GBP), local listings, and reviews—and are essential for proving the ROI of local marketing initiatives.
Here are the most critical local-focused metrics to include in your local marketing reports:
1. Google Business Profile (GBP) Views
Track how often your client’s business appears in local searches and Google Maps. It’s often the first impression a potential customer gets—and it plays a major role in local SEO performance.
2. Direction Requests
How many people asked Google Maps for directions to your client’s location? It’s a strong offline conversion signal and a tangible way to demonstrate local intent.
3. Call Volume from GBP
Track how many direct calls were made from your client’s business listing. These calls are often driven by urgency—making them high-intent actions.
4. Local Keyword Rankings
Are your clients ranking for location-based keywords? Focus on non-branded searches that align with their offerings and target audience.
5. Local Click-Through Rate (CTR)
When your client appears in a local pack, are people clicking to their site or calling directly? Local CTR can help assess visibility and engagement.
Impressions, visits to website, calls, and driving directions are the most important positive metrics to get a broader viewpoint if growth is happening in your local community.
Kira Krostag, CEO/Founder, Site Smart Marketing
6. Paid Ad Performance
For many local businesses, Google Ads, Meta, and Google Local Services Ads (LSAs) are critical drivers of local traffic and leads. Track performance metrics such as impressions, CTR, call volume, booked appointments, cost per lead, and return on ad spend.
7. Review Activity
Combine review volume, frequency, and sentiment to paint a clear picture of how customers feel about the brand—and how visible and trusted it is within the local community.
Local marketing metrics help demonstrate whether a client’s digital presence translates into real-world engagement. These aren’t vanity stats but vital indicators of foot traffic, community relevance, and marketing success.
With custom reports, we can zoom in on the key performance indicators and metrics that matter most to our clients, making our reporting experience incredibly valuable and directly relevant to their success.
Michelle van Blerck, Communications Manager, Digital Freak
Website Analytics Metrics: The Hub of Digital Performance
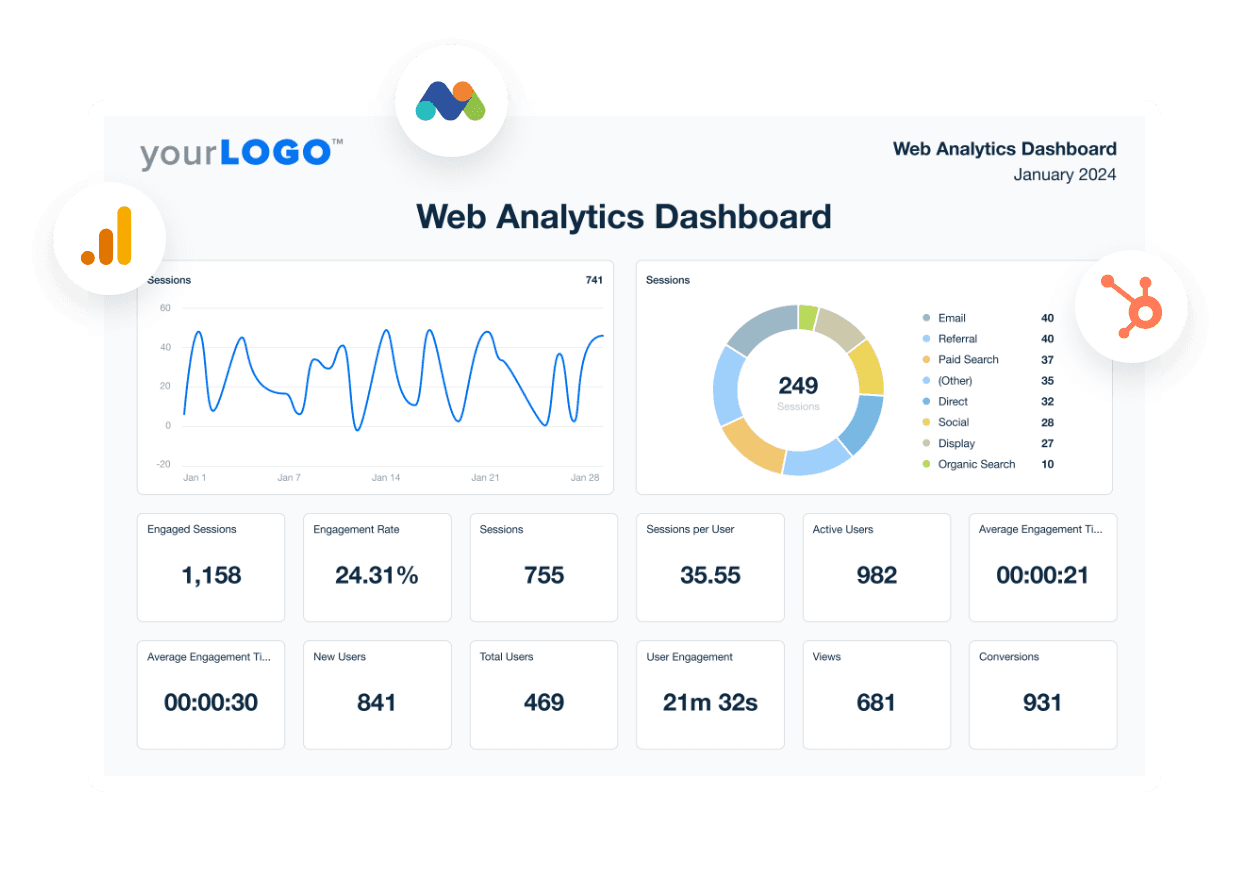
No matter what channels your client uses—social media platforms, paid ads, email, or content marketing efforts—it all leads back to one central destination: their website. That’s why website performance metrics are so important. They give you a complete picture of how visitors interact with your client’s brand online and how well each part of their digital marketing strategy is working.
Below are the most essential metrics to include when reporting on website performance:
1. Total Website Traffic
Start with the big picture. This shows how many people visited the site during a given period and can be segmented by source (organic, paid, referral, direct, social, etc.) to see what’s driving results.
2. Bounce Rate & Time on Site
These engagement metrics help assess content relevance and user experience. High bounce rates or low time-on-site may signal disconnects between ad or organic content and landing pages.
3. Conversion Rate
What percentage of site visitors complete a desired action—filling out a form, booking a consultation, or making a purchase? This metric directly ties traffic to outcomes and helps refine digital marketing performance across the board.
Clear, concise, and visually engaging reports enable our clients to understand the data, metrics, and insights effectively, fostering better communication and alignment.
Alexa Rees, SEO Manager, seoplus+
4. Top Landing Pages
Which pages are bringing in the most visitors? Understanding entry points helps you optimize content and prioritize key marketing initiatives.
5. Traffic by Device & Location
Mobile vs. desktop performance and geographic insights help tailor design and messaging to the right user base. This data is especially important for location-specific marketing campaigns.
6. User Flow & Exit Pages
Tools like Google Analytics can help you visualize how users navigate the site, where they drop off, and what friction points might negatively impact conversions.
Optional: Cost Attribution & CPA Marketing Analysis
Suppose you’re tying marketing costs (e.g., advertising or sales expenses) to digital outcomes, and tracking cost per action across channels. This shows how well your marketing strategy turns site visitors into acquired customers.
Website metrics bring all your digital efforts into focus. They offer relevant data that connects visibility, engagement, and conversion—helping your clients understand the full scope of your work.
By prioritizing professional and user-friendly reports, we consistently uphold our commitment to delivering exceptional quality and ensuring a positive client experience.
Alexa Rees, SEO Manager, seoplus+
Bring It All Together With the Right Metrics & Digital Marketing KPIs
When it comes to client reporting, clarity beats volume. With so many potential data points across channels, the challenge isn’t collecting more information—it’s choosing what to highlight.
Strong reports prioritize key digital metrics that reflect client goals, campaign strategy, and actual performance. They help clients understand what’s happening, why it matters, and where to focus next. That turns reports into a valuable part of your client experience—not just a monthly task.
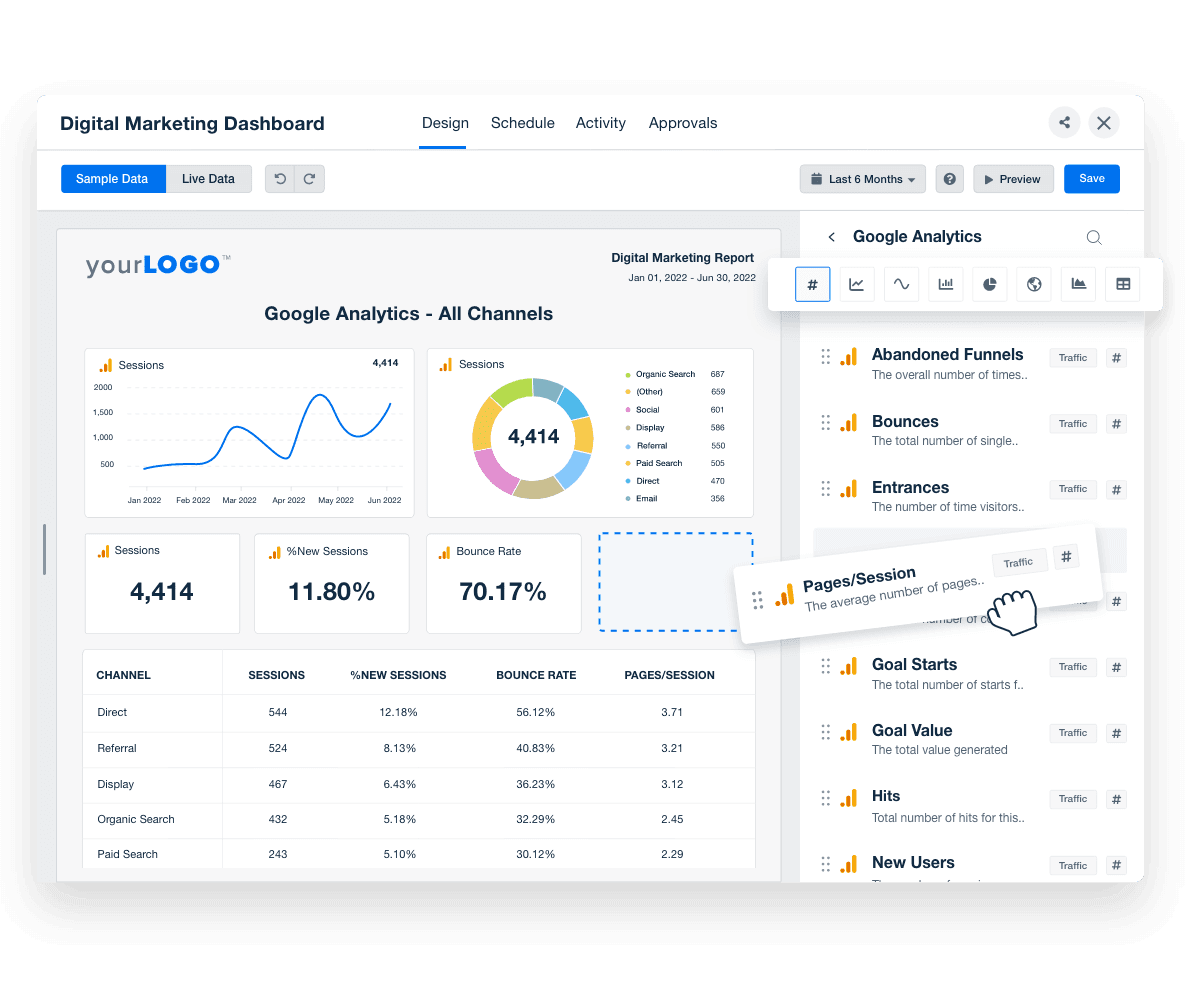
Don’t just show the metrics—show the why behind the metrics. Explain why it’s important to look at specific numbers each month and what they mean for the overall health of the business.
Jessica Weiss, Director of Marketing & Strategic Partnerships, One Firefly
Digital marketers who take this approach create alignment between their work and their client’s bottom line. Whether you’re tracking conversions from an ad campaign, website engagement, or long-term retention trends, your reporting should reflect the most relevant data for each initiative.
The biggest lesson we learned was understanding our clients' bottom-line needs... marketing metrics are meaningless if they don't directly contribute to our clients' profitability.
Ruben Roel, President, Investigator Marketing
Effective reporting doesn’t need to be complex. It needs to be intentional. By choosing the right channel-specific KPIs and aligning them with client goals, you’re not simply building better reports—you’re building better client relationships.
See how 7,000+ marketing agencies help clients win
Free 14-day trial. No credit card required.

