Table of Contents
QUICK SUMMARY:
Tracking the right ecommerce metrics is the difference between guessing and growing. This guide breaks down the 15+ most important metrics—from awareness and conversion to retention—showing how each drives revenue, improves efficiency, and proves ROI to clients. Learn which numbers matter, how often to track them, and how to turn insights into agency growth.
When scaling an ecommerce business, meticulously tracking the store’s metrics and KPIs is essential for profitability and growth. With ecommerce revenue continuing to grow rapidly, this channel has become mission-critical for many businesses.
According toeMarketer, US retail ecommerce sales will top $1.6 trillion by 2028, accounting for 20% of total retail sales.
As marketers, you’ve likely tried many growth strategies, but without closely tracking each campaign’s performance, you won’t know when to take the next step in scaling.
Aside from just executing marketing campaigns, often one minor tweak in an ecommerce store—for example, optimizing the checkout process and reducing cart abandonment rates—will lead to significantly higher margins and the ability to invest more in customer acquisition.
Taking a data-driven approach to growth enables marketers and ecommerce business owners to know precisely which ecommerce metrics and KPIs need more attention and when they’re ready to scale profitably.
With rapidly evolving ecommerce trends, keeping your finger on the pulse of what’s happening is key to success. In this guide, we’ll discuss 15+ metrics and KPIs to measure an ecommerce store's success.
Below, we’ll focus on metrics related to our Shopify integration, although keep in mind that these metrics can be applied to WooCommerce, BigCommerce, or any other ecommerce platform.
What are the most important ecommerce metrics? In particular, we’ve broken each of these top marketing metrics down based on where they fit in the ecommerce sales funnel.
But first, let’s tackle a few key concepts to set the stage.
What is an ecommerce metric?
An ecommerce metric is a measurable data point that reflects how your client’s online store is performing. Think of it as the scoreboard for every part of your client’s business—from how many people discover their brand to how much profit they keep after each sale.
For agency leaders, these numbers are more than historical data. They’re the real-time signals that show whether a client’s strategy is delivering results or needs an adjustment.
The key is to focus on metrics that:
Tie directly to business goals.
Can be acted on quickly.
Provide context over time (month-over-month or year-over-year trends).
For example, total sessions tells your client how many visits their store gets, but pairing it with conversion rate reveals whether those visits are turning into paying customers. That’s why the best ecommerce metrics don’t live in isolation. They work together to tell the whole story.
How to determine which key ecommerce metrics are non-negotiable
Monitoring hundreds of ecommerce analytics, metrics, and key performance indicators (KPIs) has little to no value for your clients if they don’t significantly influence the long-term performance of their ecommerce site. Identifying key metrics is critical as they help monitor sales performance, track operational effectiveness, and provide actionable insights to enhance online selling strategies.
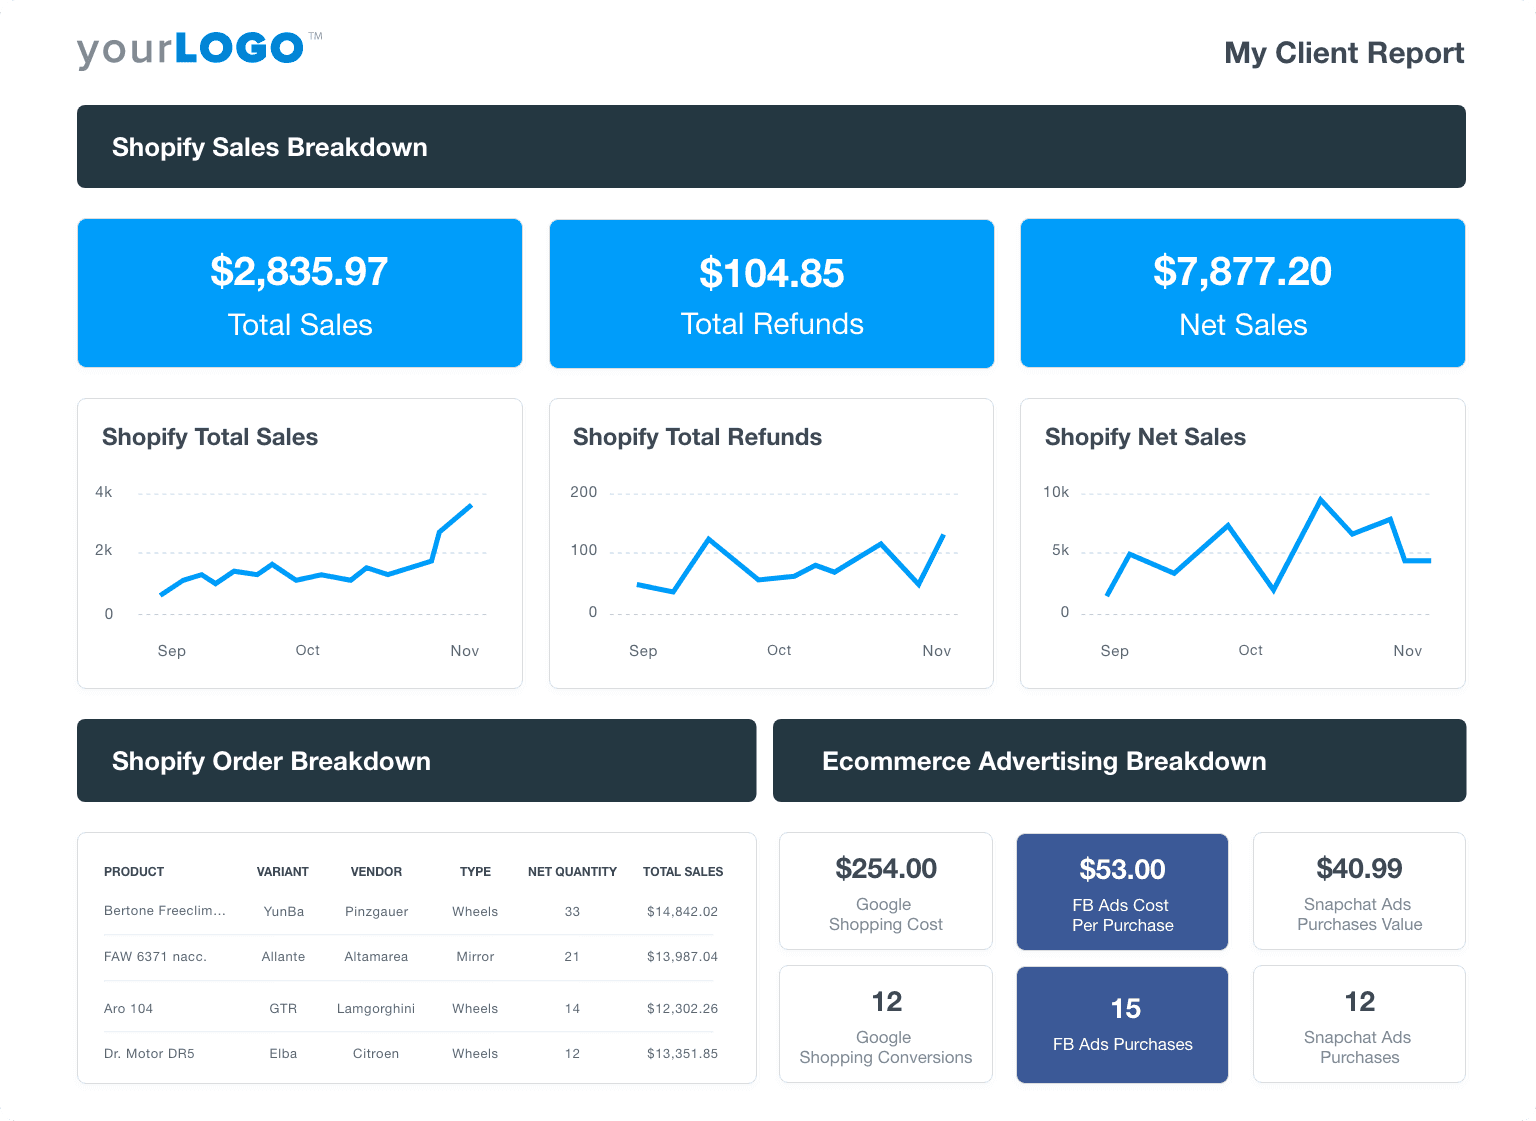
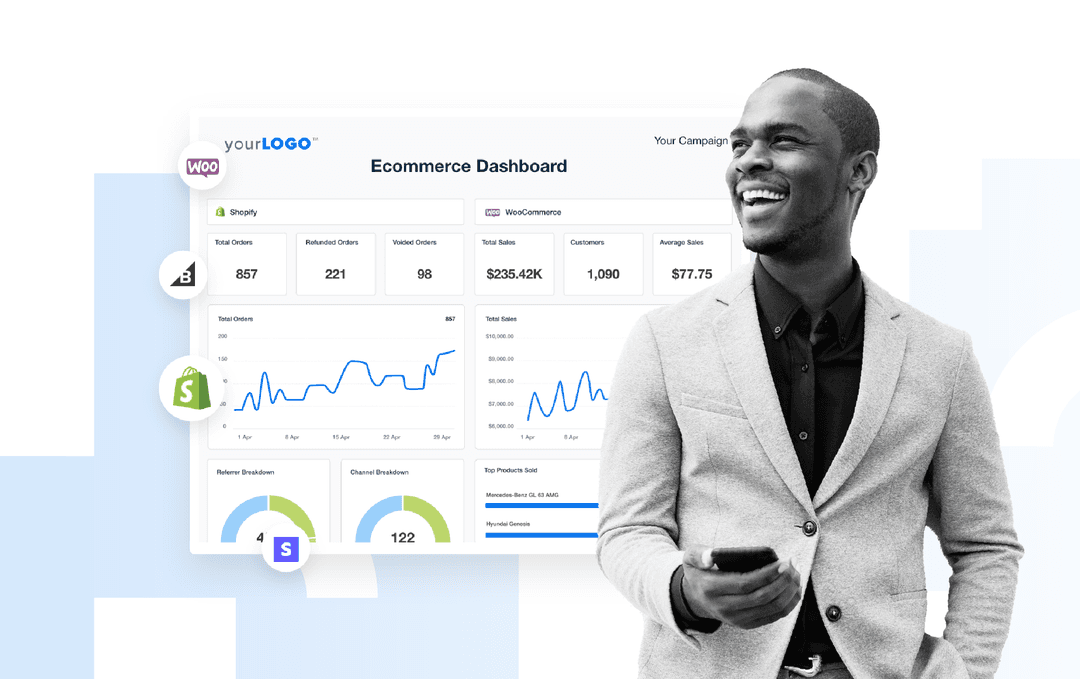
Want to make your ecommerce reporting easier? Use the customizable ecommerce dashboard! Try AgencyAnalytics free for 14 days!
Here’s what we recommend: From the bigger list of metrics you now measure, determine the KPIs that regularly have the most significant influence on the overall company objectives. Basically, you're looking for metrics that help drive and measure ecommerce success.
The difference between an ecommerce metric and an ecommerce KPI
Here’s how to differentiate the metrics vs KPIs: Metrics assess the progress of every business activity, whereas KPIs demonstrate how effective you are at accomplishing specific goals.
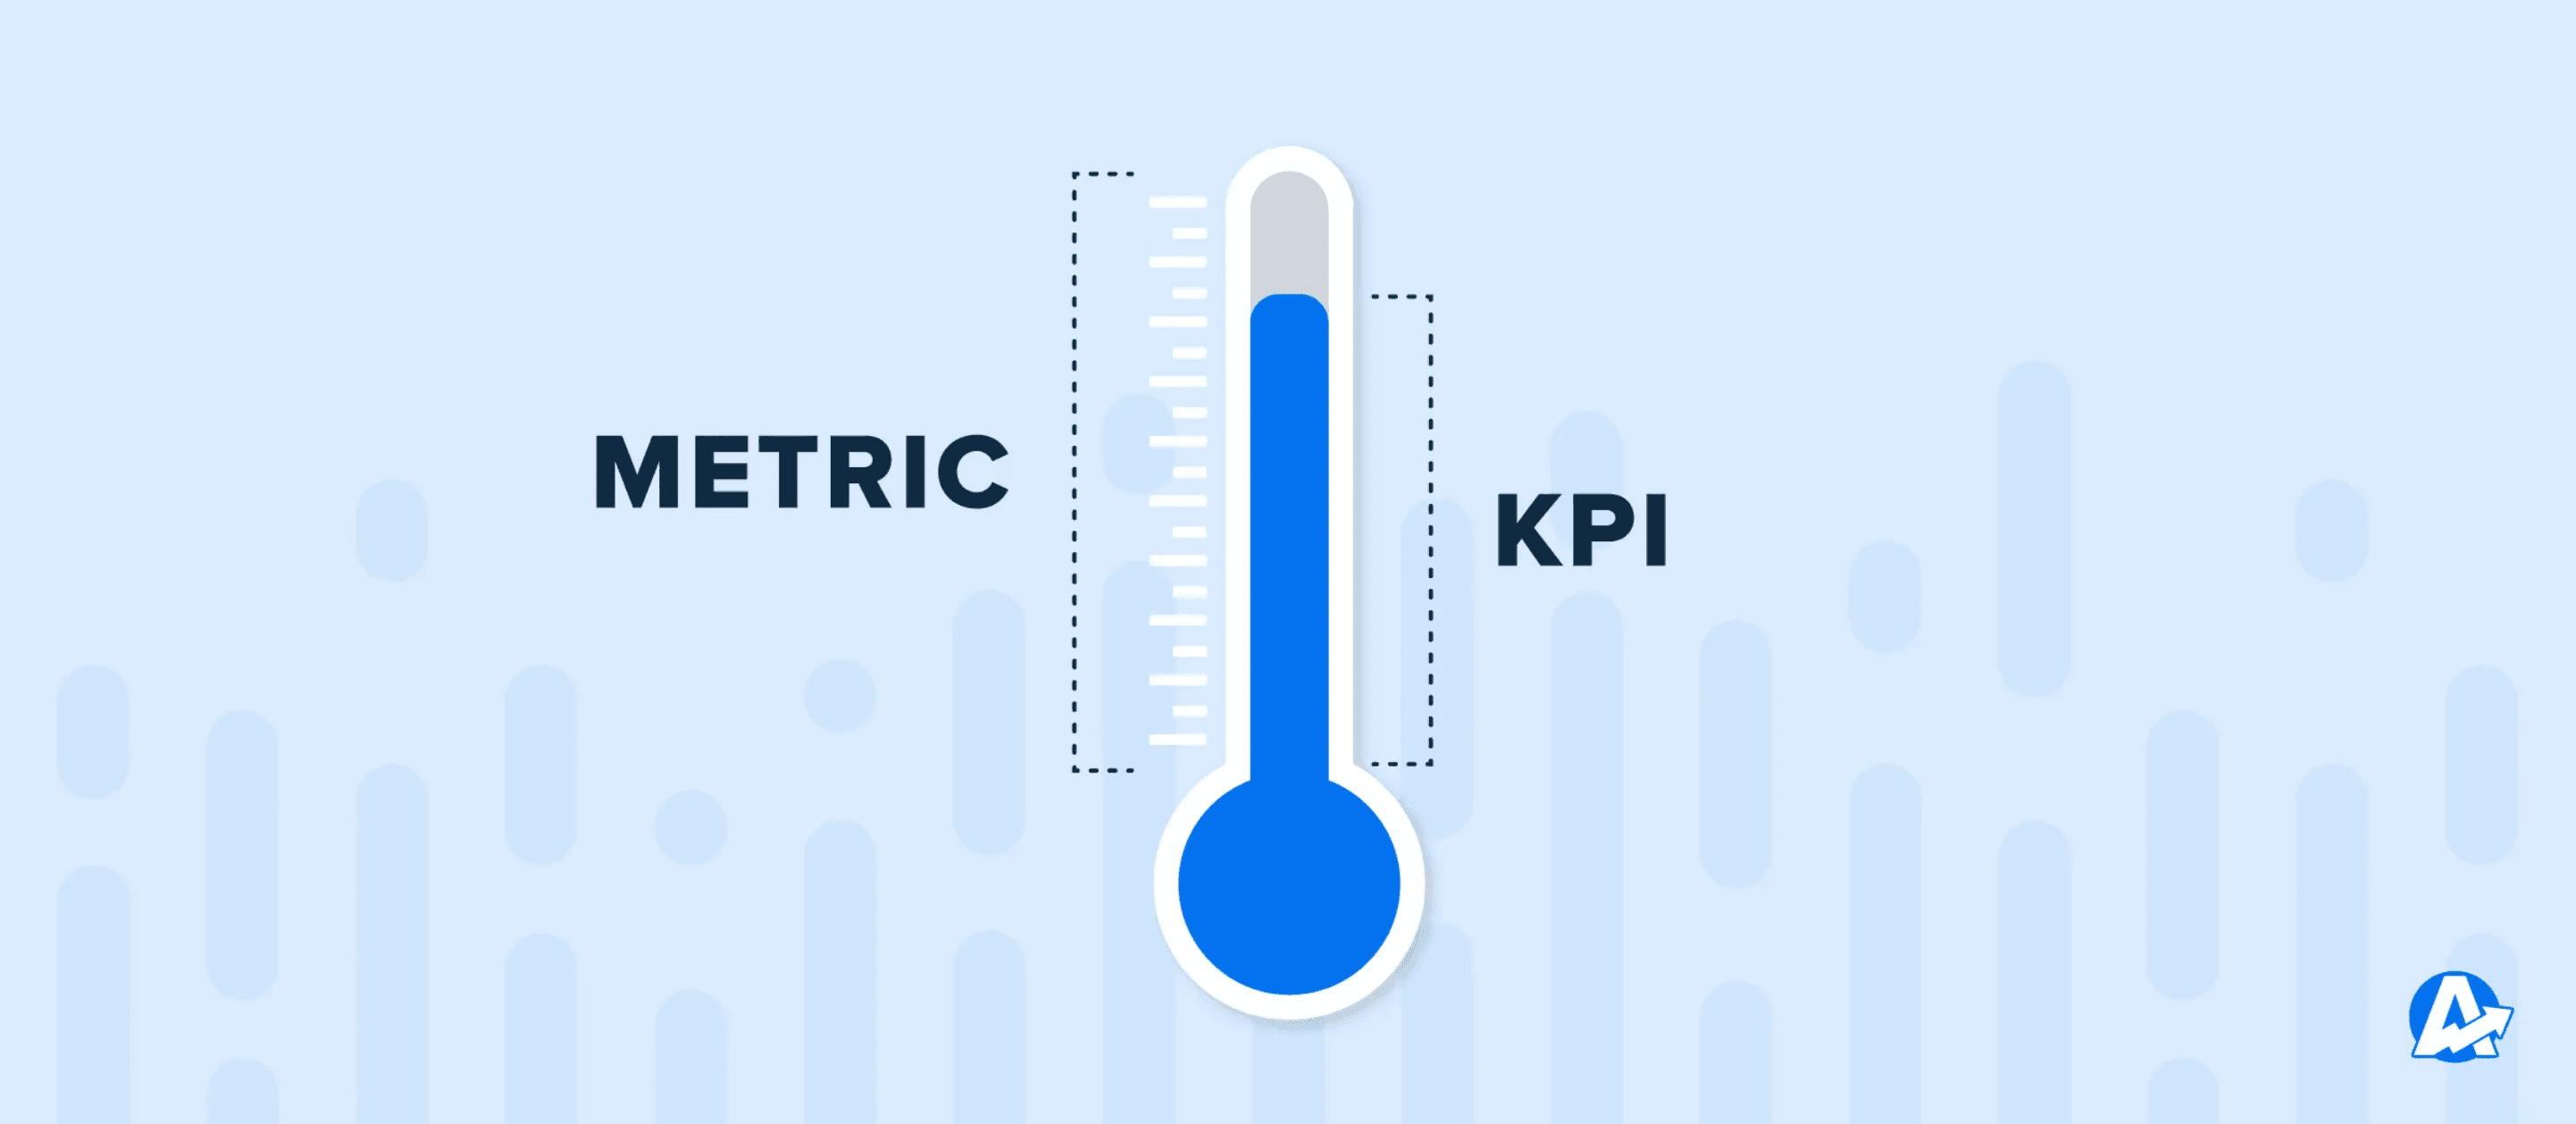
The terms often get swapped, but they’re not the same thing.
Ecommerce metrics are raw measurements. They tell your client what’s happening, like conversion rate, total sessions, or average order value.
Ecommerce KPIs are the specific indicators that measure progress toward a defined business goal.
Example: If your client’s goal is to grow repeat purchases by 20% this year, the Repeat Customer Rate becomes a KPI. It’s now a target you’re actively working toward.
Clearly distinguishing ecommerce metrics from KPIs—and using a KPI dashboard—ensures your client reports highlight actionable data and prevent overwhelming them with noise.
How often should I check my most important ecommerce metrics?
The short answer: Often enough to catch problems early, but not so often that you’re reacting to normal fluctuations.
For most ecommerce clients, the sweet spot looks like this:
Daily: Metrics tied to active campaigns or critical store functions, like conversion rate, site uptime, and ad spend pacing.
Weekly: Traffic sources, sales by referrer, and ROAS to spot trends before they become problems.
Monthly: Retention and customer value metrics like CLV, repeat customer rate, and NPS. These need more data to be meaningful.
Quarterly: Strategic big-picture metrics such as year-over-year growth, channel profitability, and customer acquisition cost trends.
With the right ecommerce metrics dashboard, you’ll track trends in real time without getting lost in the data.
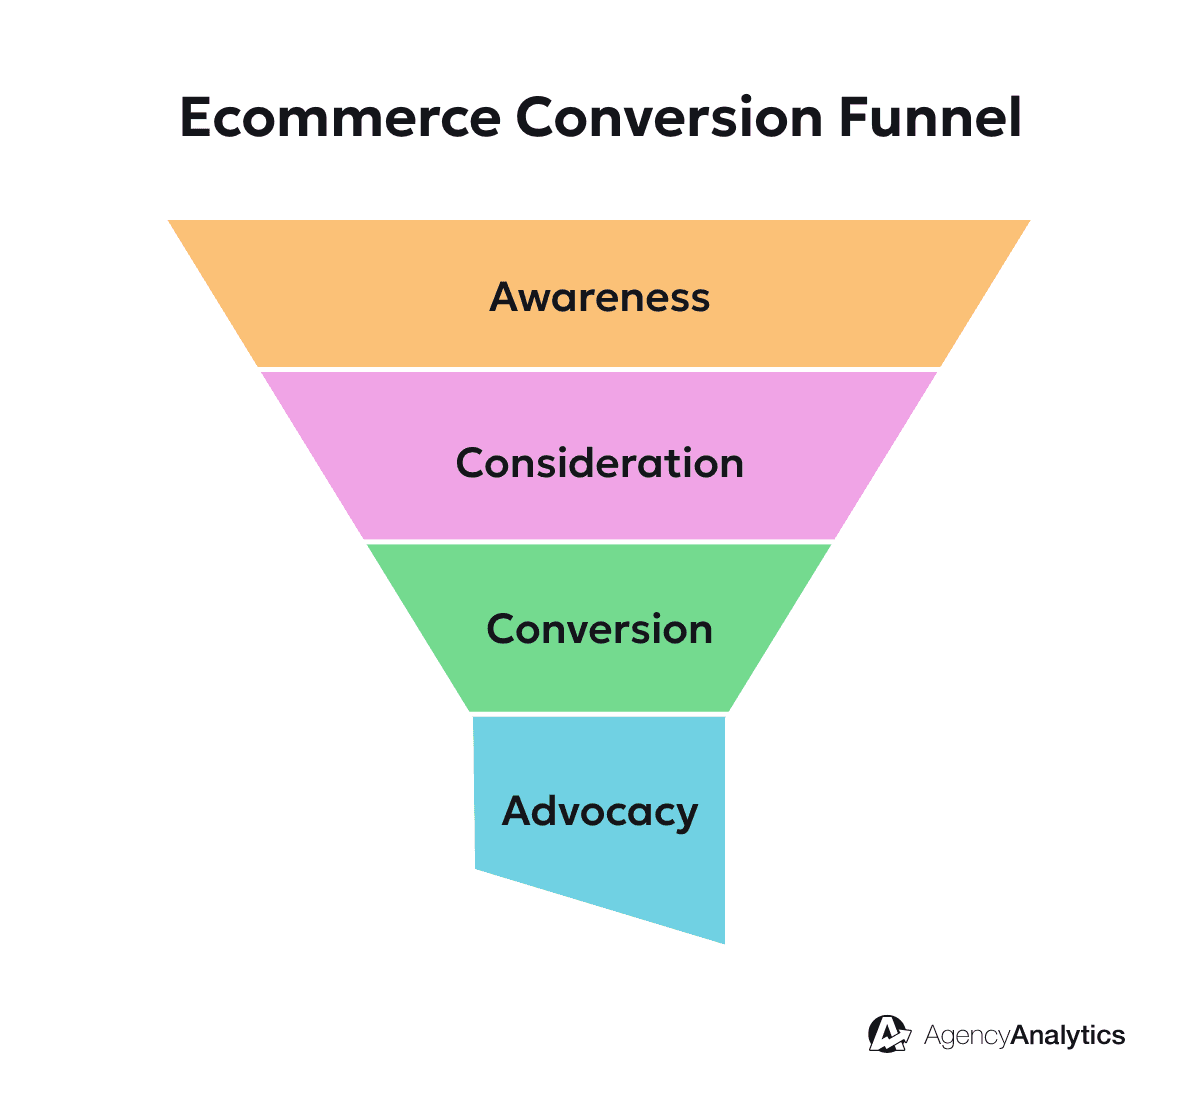
The 15+ most important ecommerce metrics
Awareness and consideration metrics
Before even thinking about conversions, awareness and consideration metrics allow you to measure how effectively your clients are attracting people to the top of the funnel. These metrics are key to understanding where your client’s highest-value channels, campaigns, traffic, and engagement are coming from.
Total sessions
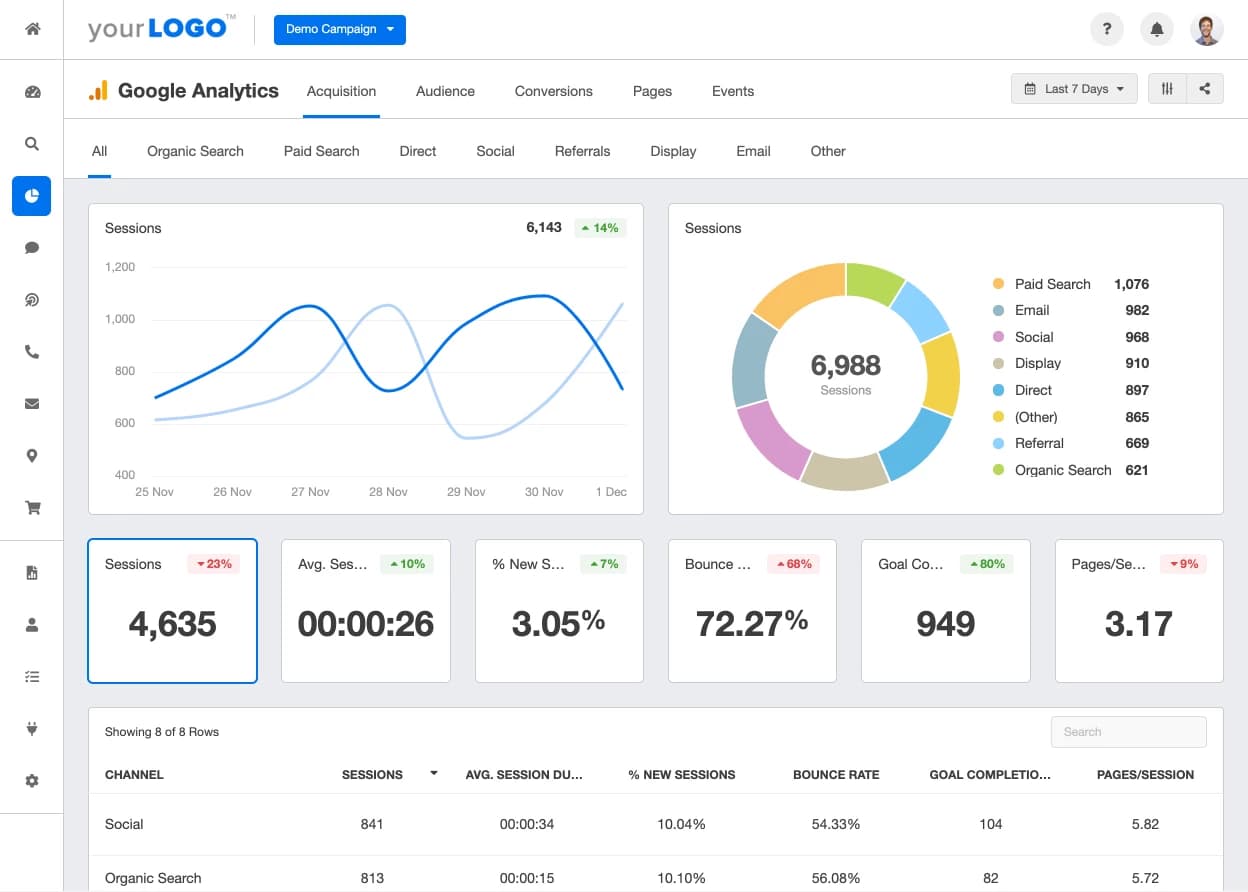
At the top of the ecommerce funnel, one of the most foundational metrics to track is total sessions. Google Analytics defines a session as a group of user interactions on the website that takes place within a given time frame, which by default lasts for 30 minutes of inactivity. Since each session represents a new potential customer, total sessions are key to evaluating both the short-term and long-term success of an ecommerce store.
Sessions by source
Since not all traffic is created equal, it’s important to break each session down by source. When it comes to the ecommerce sales funnel, often top-of-funnel traffic will come from one source—for example, social media—and conversions will come later through an email or retargeting campaign.
Whatever the case, knowing your client’s highest-performing sources is key to scaling their organic and paid traffic. Both total sessions and sessions by source can easily be tracked with our Google Analytics integration.
New vs. returning visitors
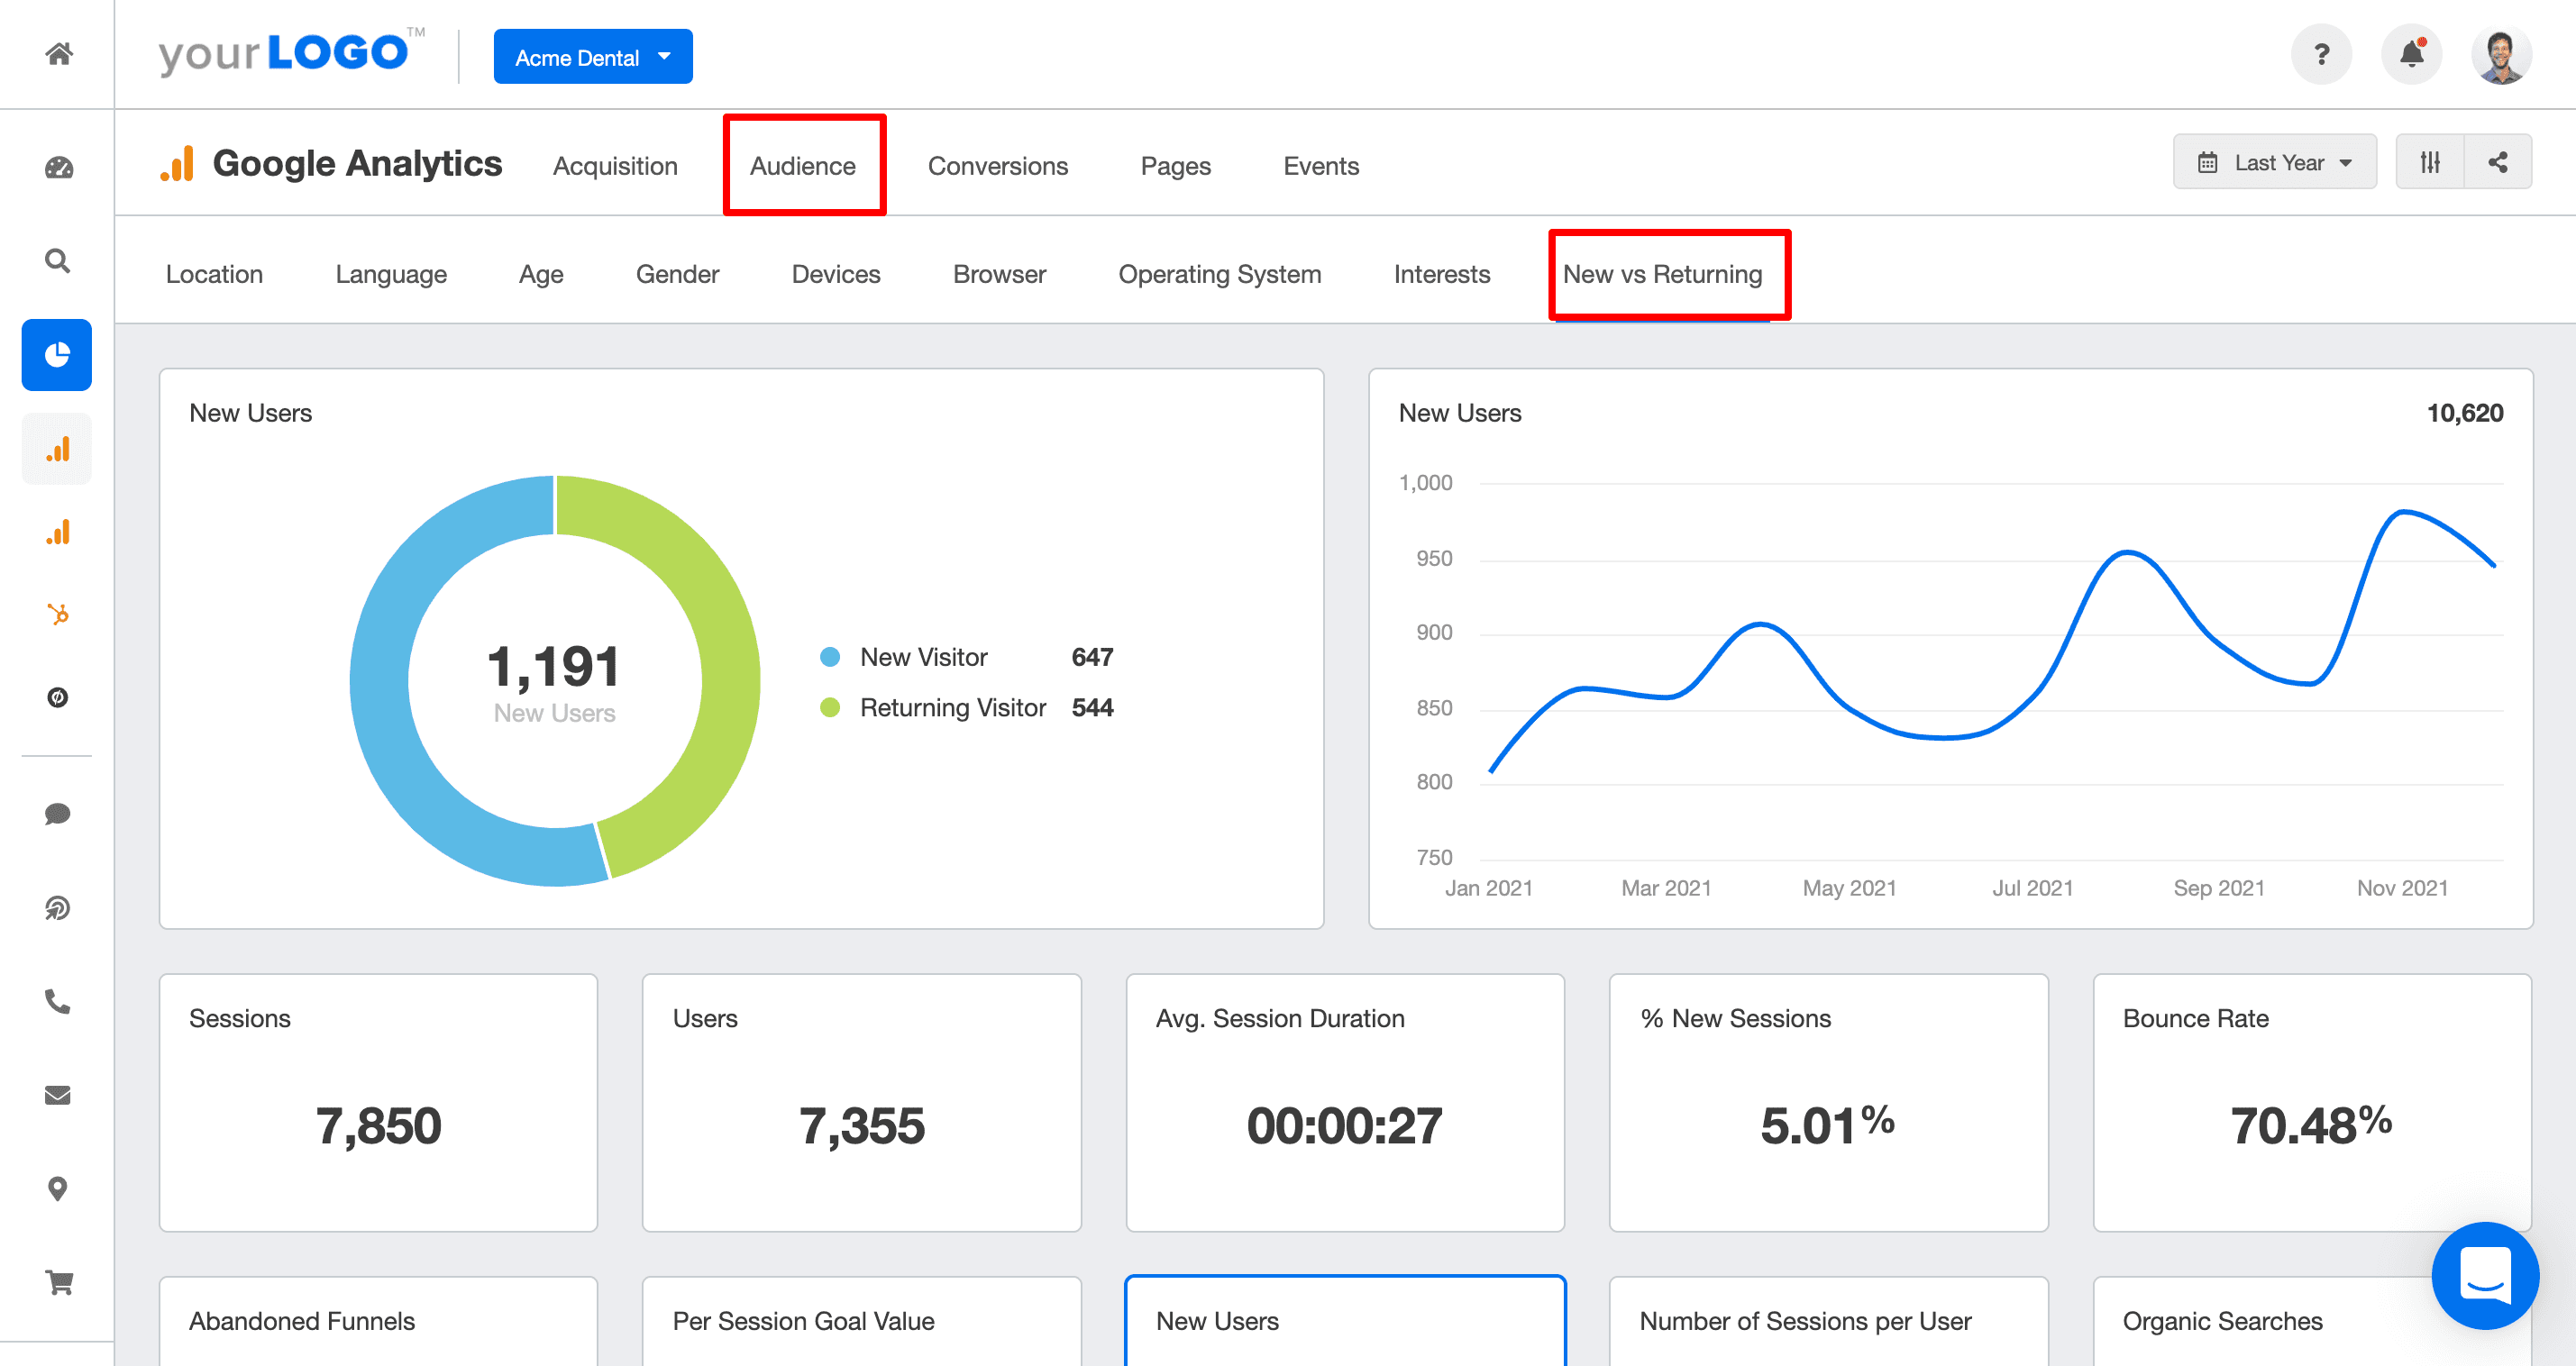
Most conversions won’t occur on the first visit, which is why tracking new vs. returning visitors is so important. Often, potential buyers just need a reminder about your client’s store, so this metric can gauge how effective retargeting or email marketing campaigns are at bringing people back. This is easily tracked with Google Analytics using the "% of New Sessions" metric.
Social media engagement
Tracking social media engagement across each platform can provide your agency with insight into the type of content that performs with the client’s audience. There are many individual metrics to monitor engagement, so if social media is the main traffic source of the store, it’s recommended to use a dedicated social media dashboard.
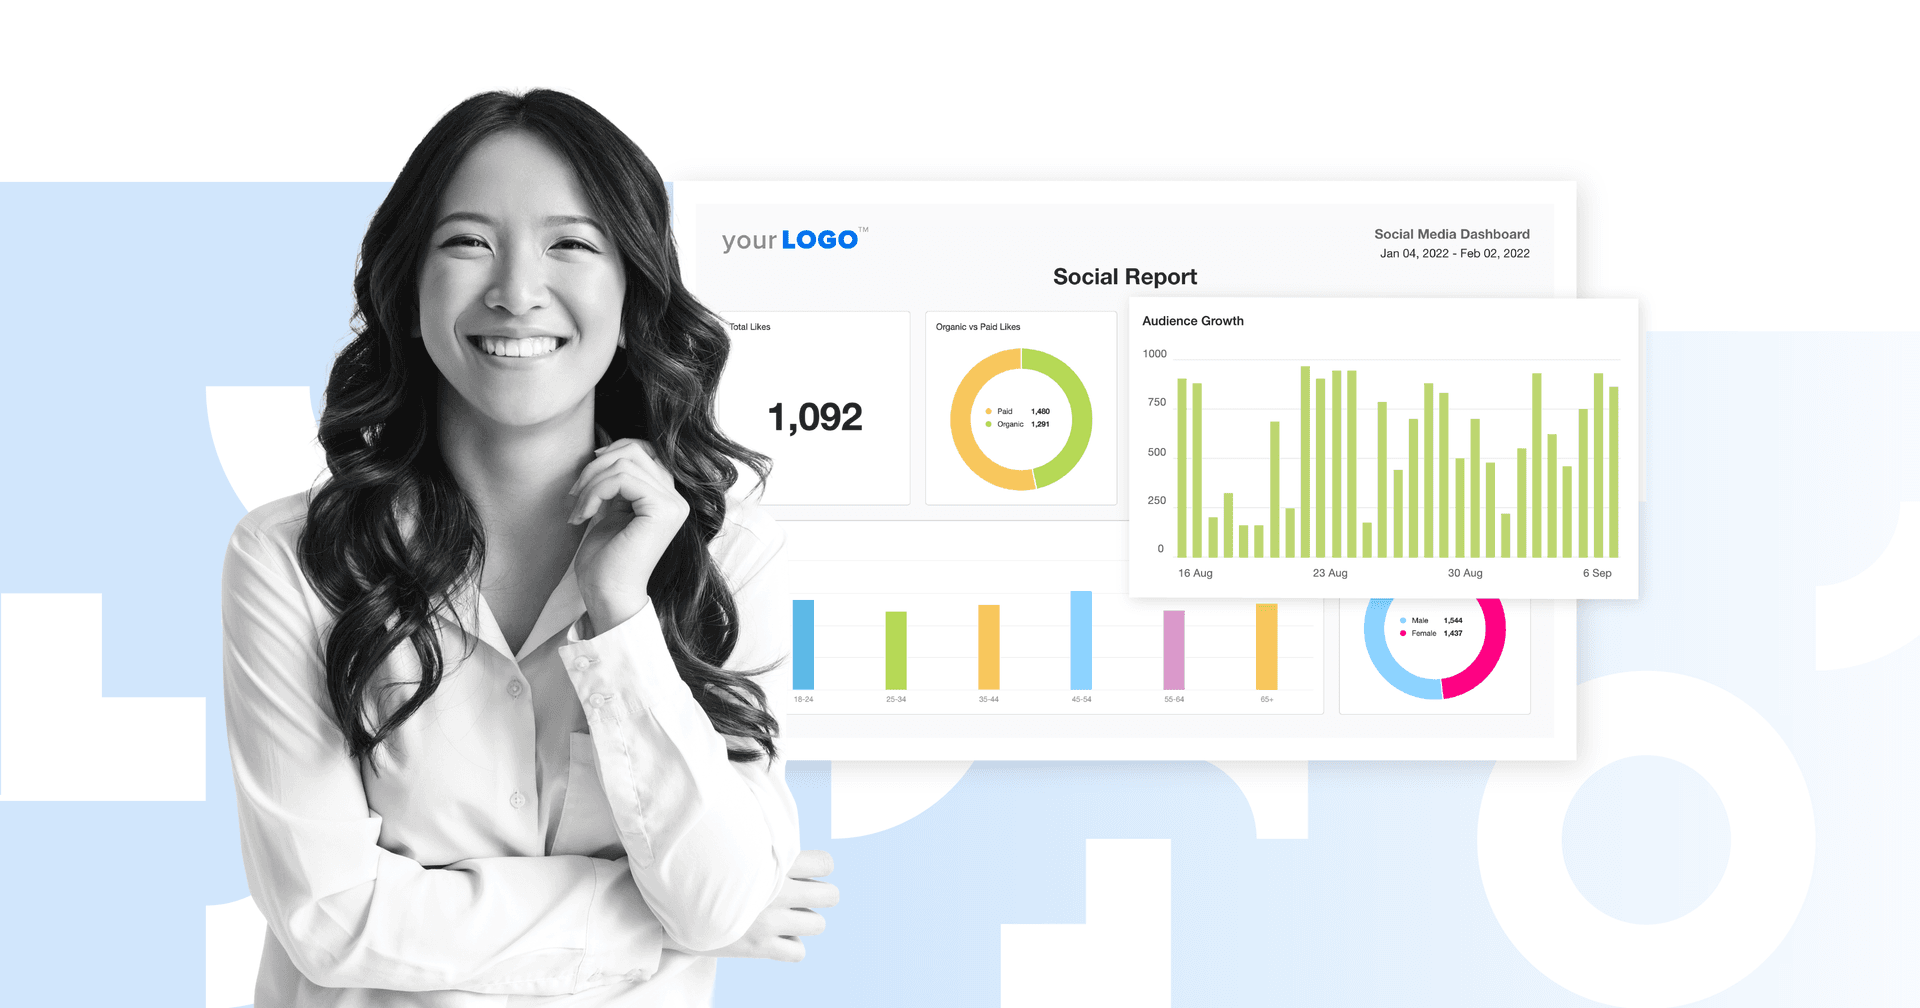
For example, if you're building a social media report for clients, we’ve included some of the social media KPIs to track in the customizable template, including:
Subscribers/followers
Conversions for social
Revenue from social
Traffic from social
Comments & Likes
Number of posts/videos
Posts/video feed
Demographics and geographics of subscribers
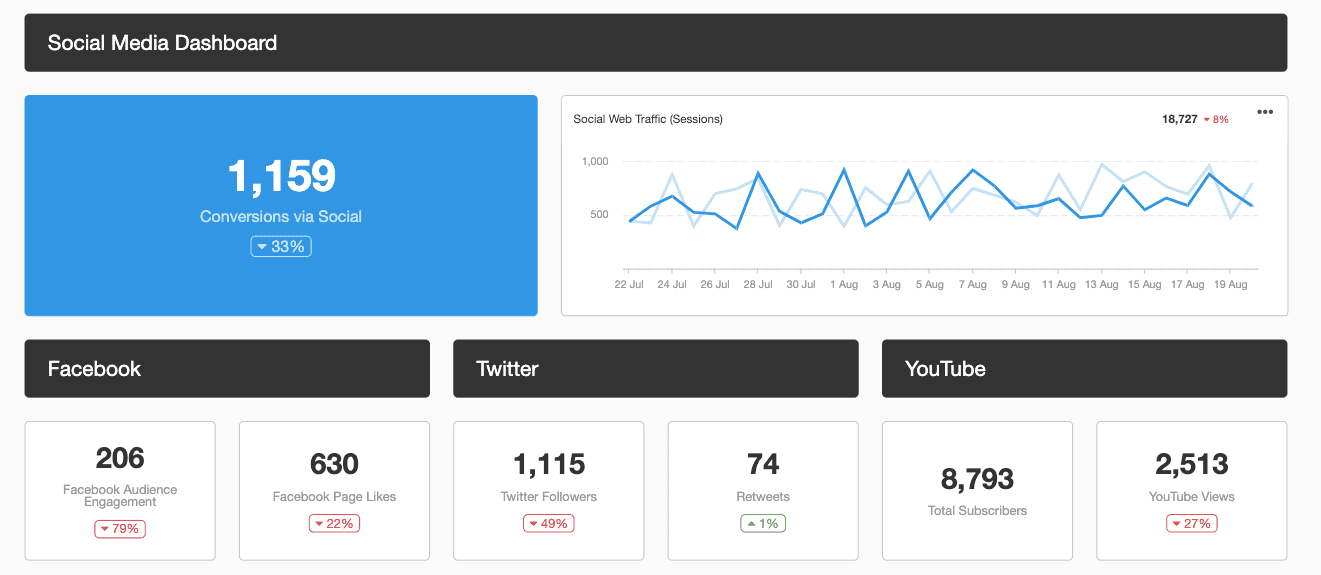
Streamline social media campaign performance reporting with a white label Social Media Dashboard. Get started with a 14-day free trial!
Top organic keywords
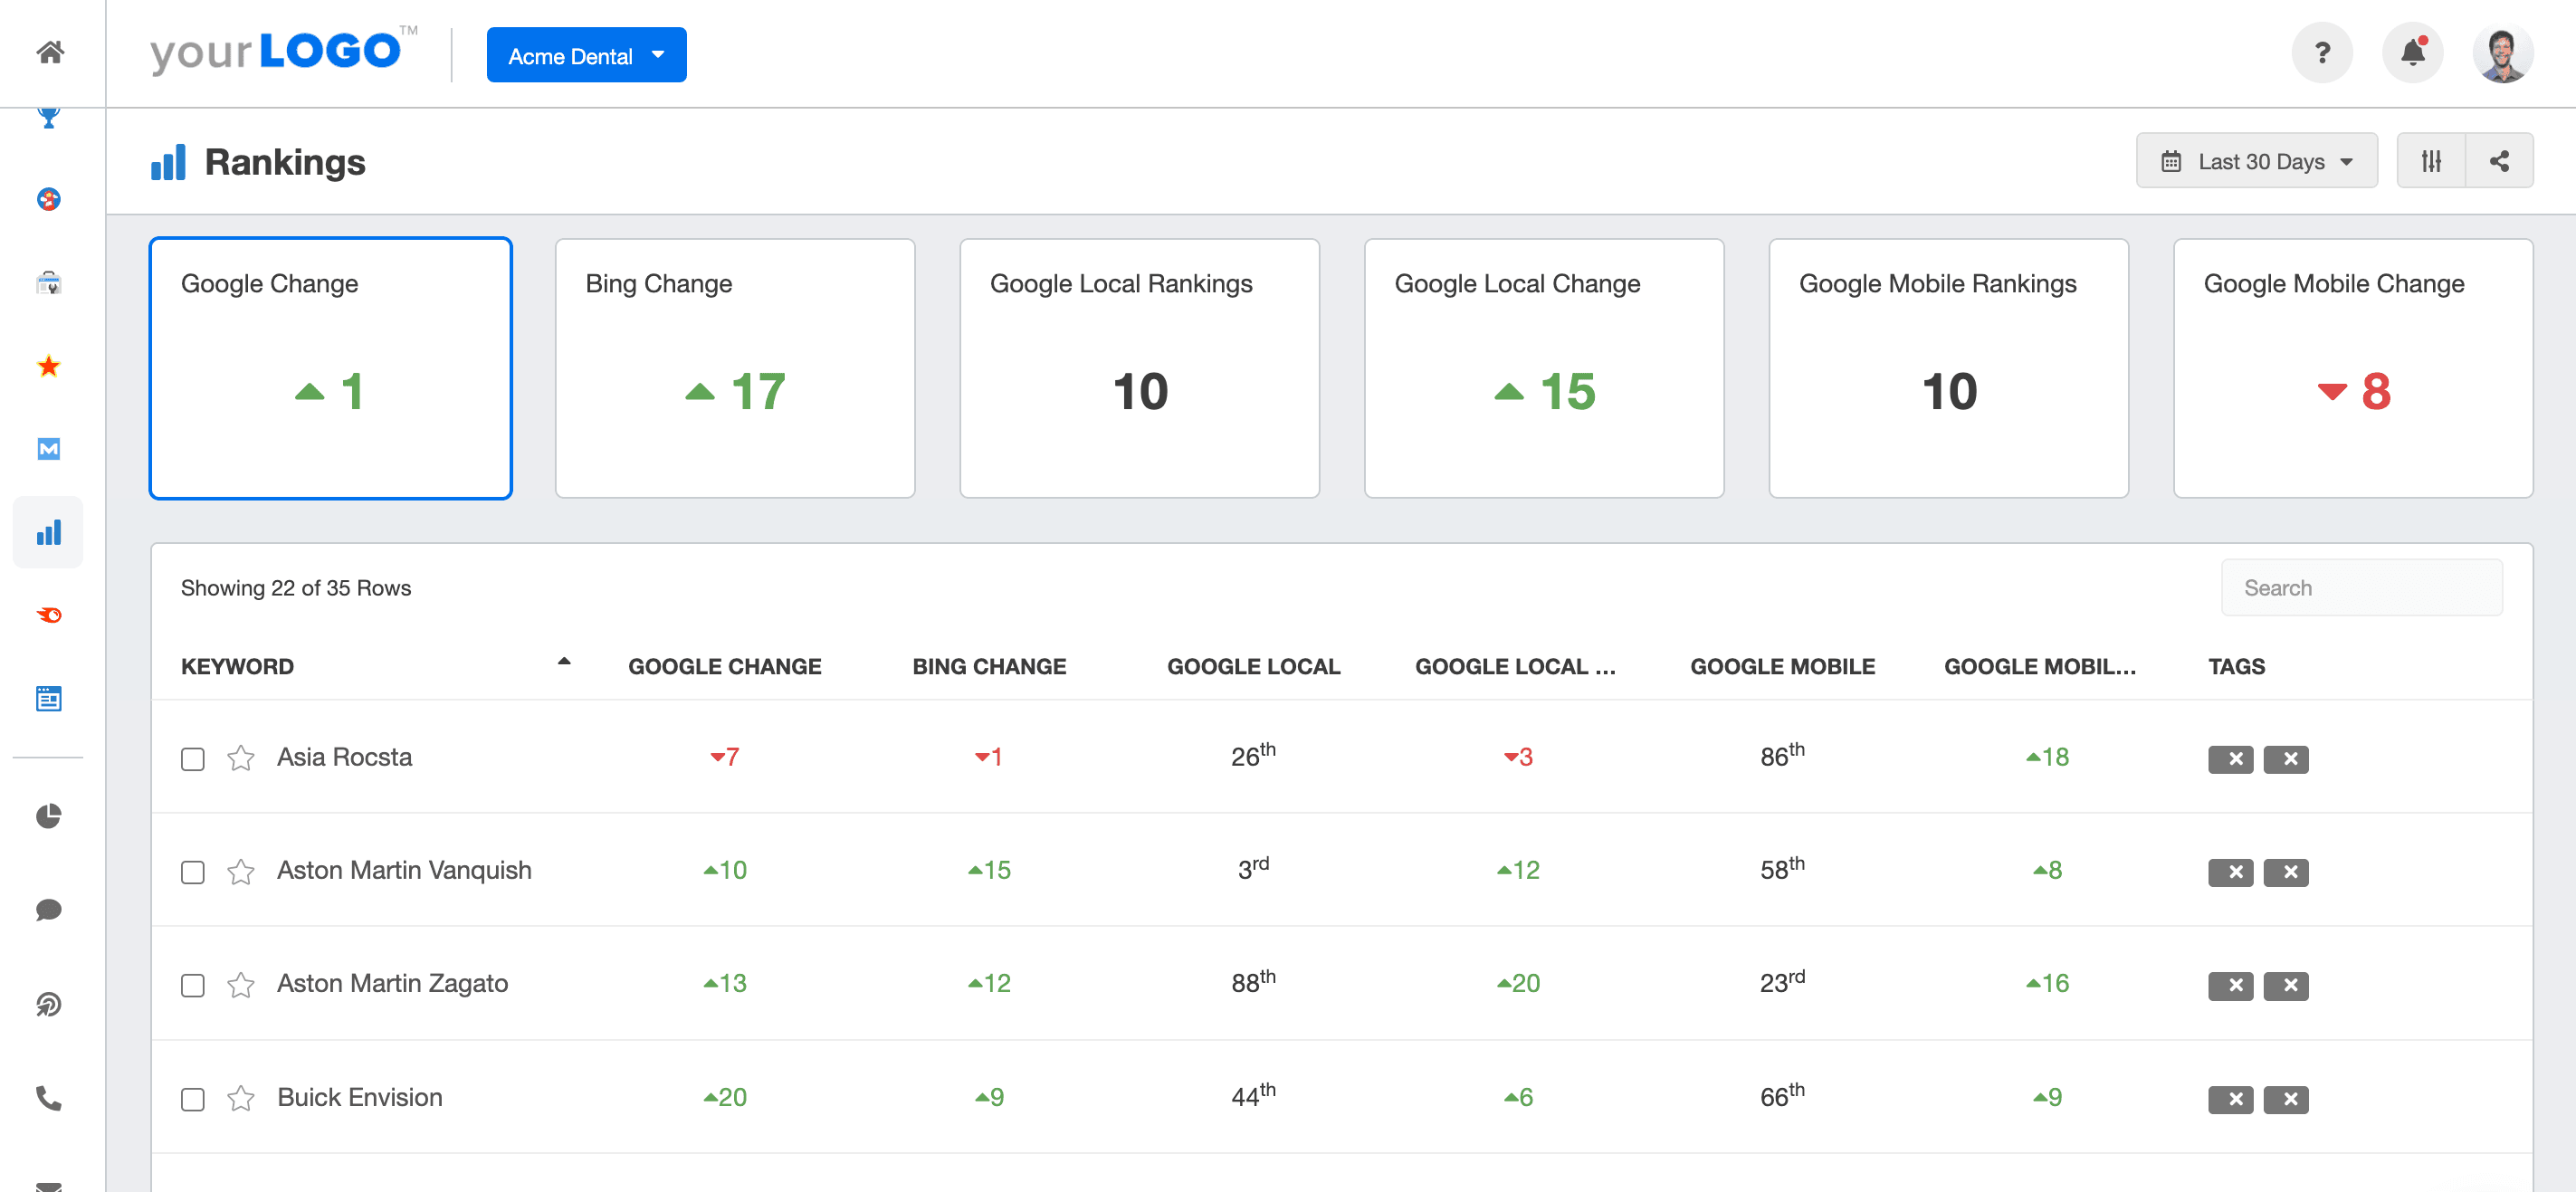
Although many ecommerce businesses focus on paid traffic for growth, ranking for organic keywords in search engines can also generate a significant ROI. Since SEO is a much longer-term investment than paid traffic, monitoring traffic from organic keywords with a rank tracker is key to evaluating its performance.
Email opt-ins
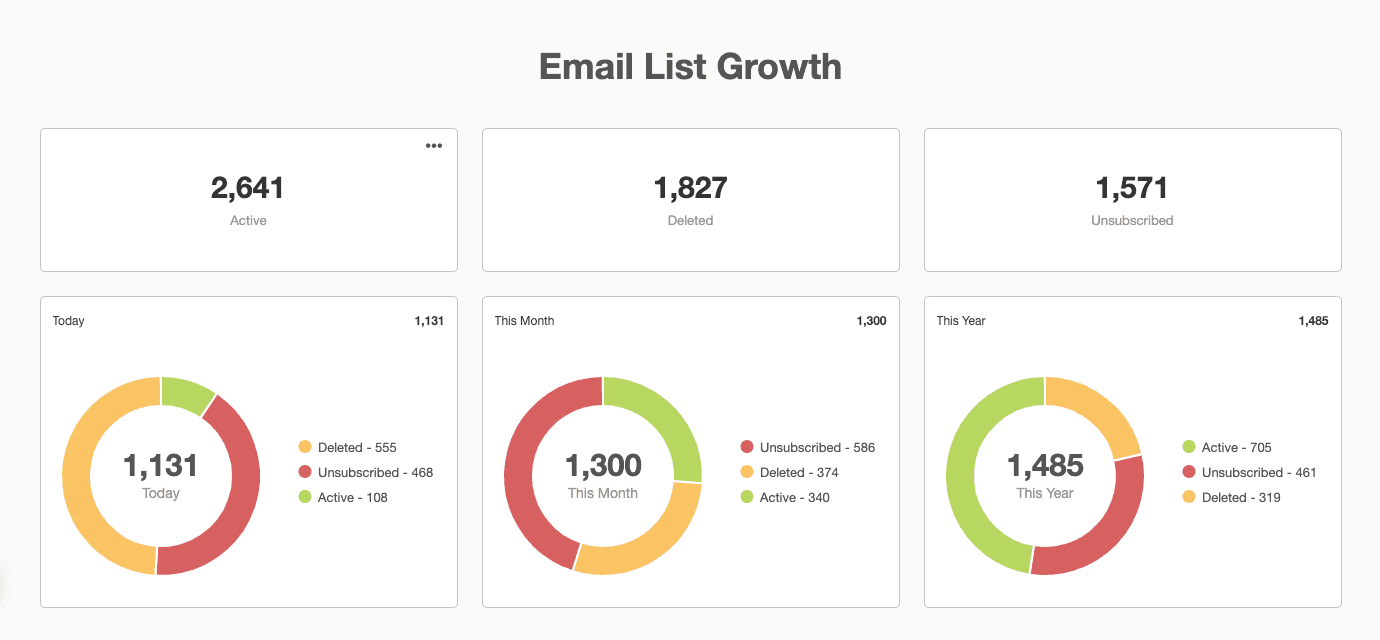
In terms of ROI, email marketing is often one of the most valuable channels for both first-time and repeat purchases. In fact, a study by Campaign Monitor found that email can generate an ROI of 4400%, or $44 for every $1 spent on an email campaign. In order to track email opt-ins, you can either use the built-in analytics from your email provider in an email marketing report template or use a conversion goal in Google Analytics to track the opt-in’s “thank you” page.
Marketing Qualified Leads (MQLs) and Sales Qualified Leads (SQLs)
Marketing Qualified Leads (MQLs) and Sales Qualified Leads (SQLs) are essential metrics for ecommerce clients, bridging the gap between marketing efforts and sales outcomes.
MQLs are leads that have shown interest in a product or service through marketing efforts, indicating potential for conversion.
SQLs, on the other hand, are MQLs that have been vetted further by the sales team and deemed ready for direct sales engagement. Tracking these metrics helps businesses understand lead quality and optimize the sales funnel.
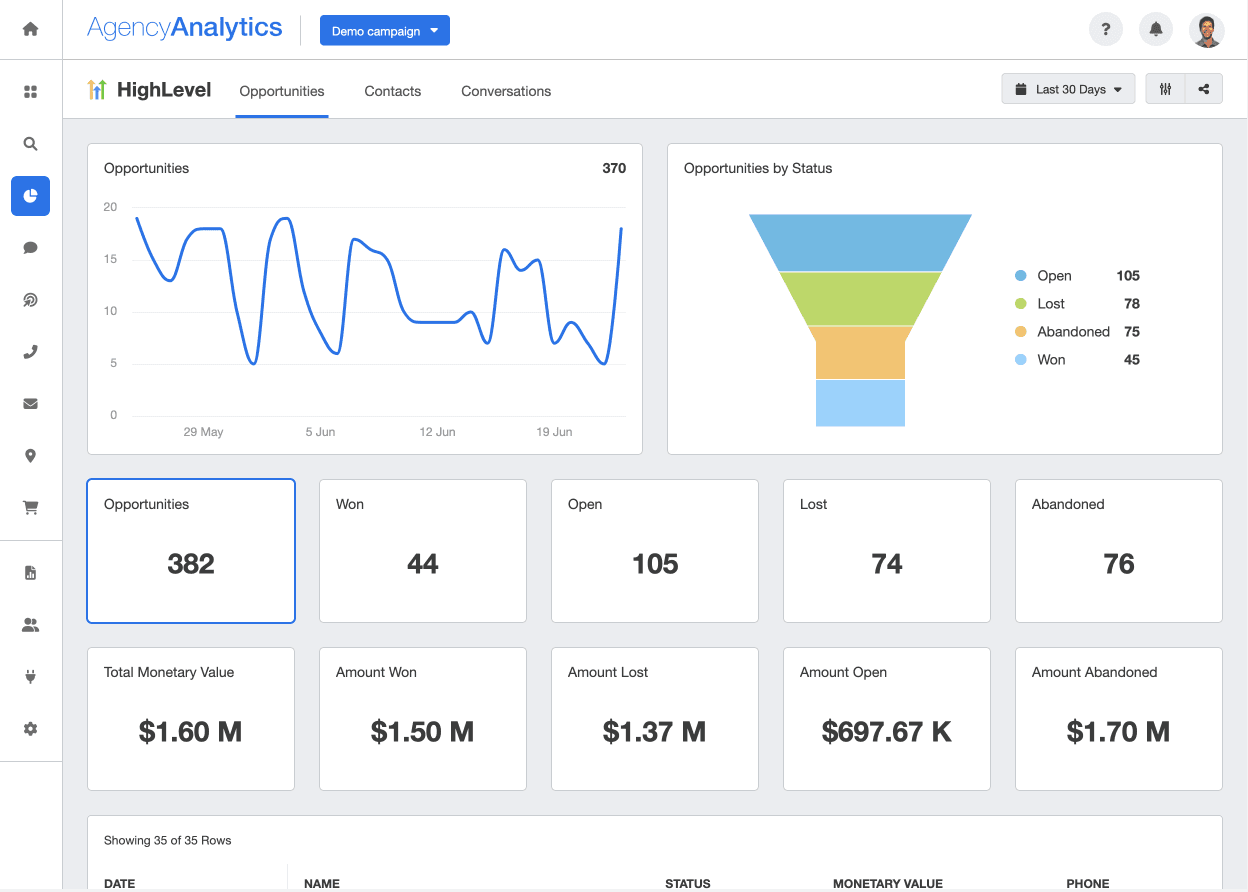
By effectively identifying and nurturing MQLs and SQLs, marketing agencies drive higher conversion rates and improve ROI for their clients. Agencies also tailor strategies to focus on generating high-quality MQLs and seamlessly transitioning them to SQLs, ensuring a more efficient sales process and, ultimately, increased revenue.
Ecommerce conversion metrics
After you’ve built brand awareness and traffic to the site, the next step is to optimize your client’s ecommerce conversion funnel. With enough traffic, even minor improvements to the conversion funnel can make a huge difference in profitability and scalability.
Conversion rate
Conversion rate is one of the most important metrics to track in your conversion funnel. Although average conversion rates will vary widely based on the product price, industry, and so on, Little Data highlights that a good benchmark to aim for is at least 1.75%.
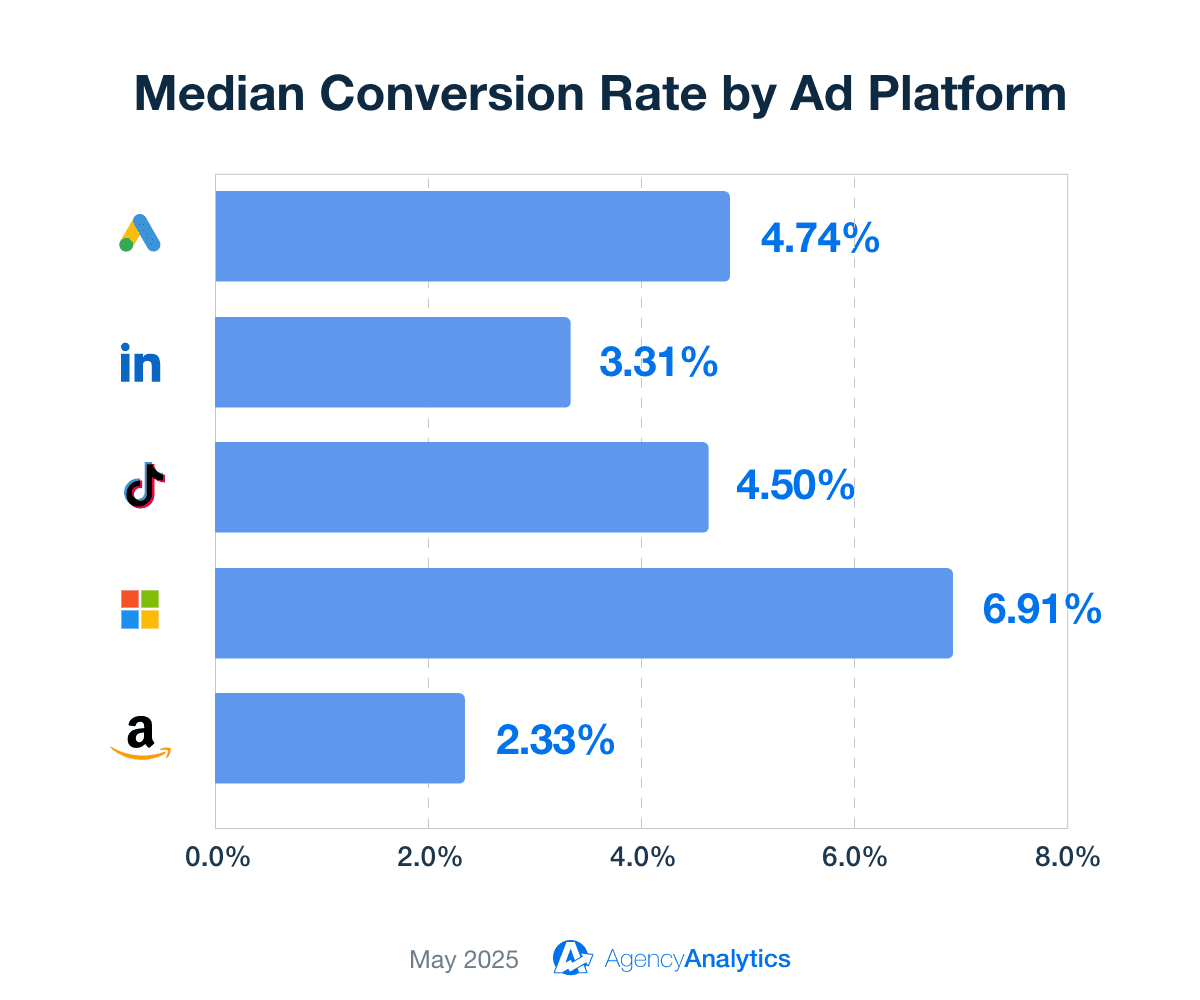
Conversion rate optimization is a very in-depth topic so we won’t cover it in this article, although check out Shopify's blog section dedicated to the subject here.
Though similar, sales conversion rate and ecommerce conversion rate focus on different aspects of online business performance. Sales conversion rate measures the percentage of leads or prospects who make a purchase across various sales channels, emphasizing the effectiveness of sales strategies and customer interactions.
Ecommerce conversion rate specifically refers to the proportion of visitors to an online store who complete a purchase online, highlighting the success of an ecommerce website in converting traffic into sales. The use of AI in conversion rate optimization is also an area well worth exploring, given its growing impact and potential.
Customer acquisition cost (CAC)
Customer acquisition cost (CAC) is a vital metric for any ecommerce business aiming to scale effectively. It measures the total cost of acquiring a new customer and includes all expenses related to marketing and sales efforts. This metric provides critical insights into the efficiency and effectiveness of your marketing strategies.
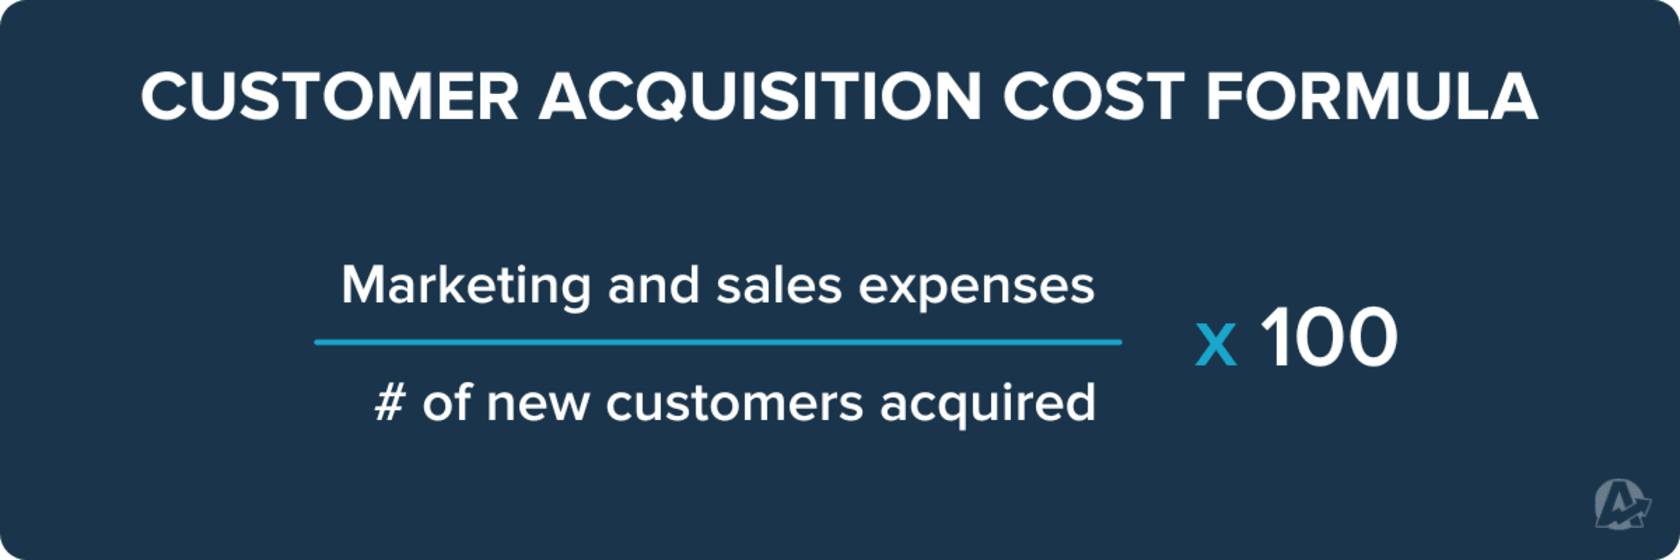
To calculate customer acquisition cost, divide the total marketing and sales expenses by the number of new customers acquired during a specific period. For example, if your client’s business spends $10,000 on marketing campaigns and gains 1,000 new customers, the CAC would be $10.
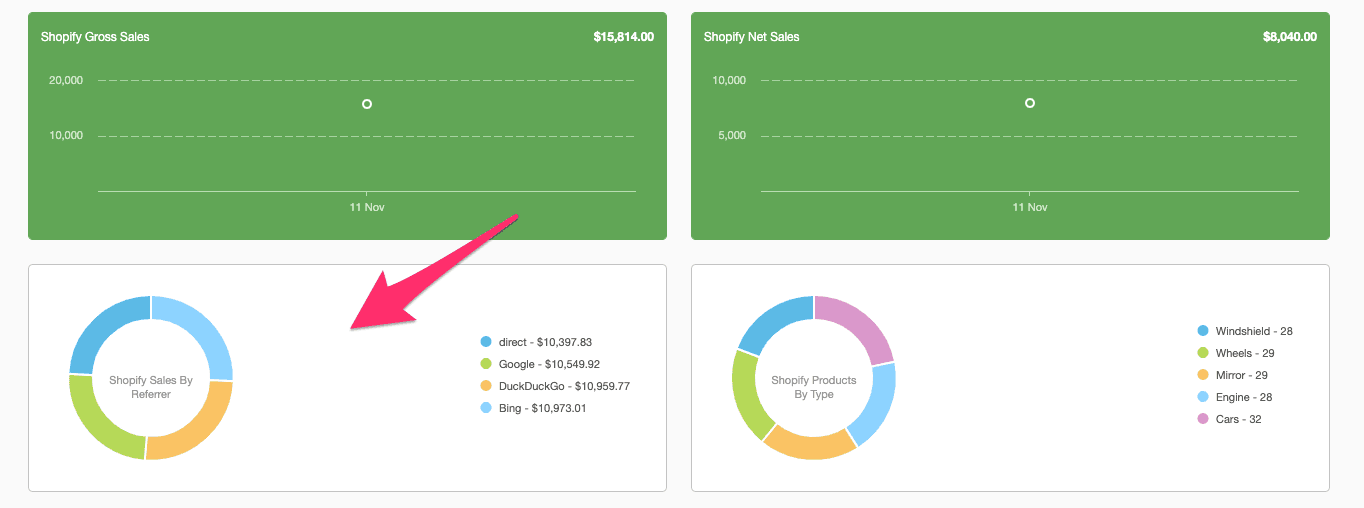
Sales by referrer
Just as knowing where traffic came from is essential, tracking sales by referrer is equally important. In our ecommerce dashboard, sales are broken down by referrer in a pie chart alongside the exact revenue from each source:
Average order value (AOV)
Average order value is another essential metric for any ecommerce business, as it estimates the amount the average customer will spend online. One of the main reasons it’s so essential to track AOV is that it shows exactly how much your client pays to profitably acquire a customer.
Keep in mind, however, that there are a number of strategies to increase AOV over time, for example, Shopify suggests these top five ways:
Create an order minimum for ‘free shipping’
Bundle products or create packages
Upsell or cross-sell complementary products
Set up a customer loyalty program
Provide live chat support for quick questions
Aside from AOV, in our ecommerce dashboard, you can also set an average order goal to ensure you’re hitting your client’s KPIs each month:

Cart abandonment rate
Cart abandonment rate is the rate at which users add a product to the cart and leave without completing their purchase. The research company Baymard estimates the average online shopping cart abandonment rate is 69.80%, so there will always naturally be a portion of visitors who will abandon.
To gather more information, take a look at how the abandonment rate compares to the add-to-cart rate, which reflects a user's first intent to purchase.
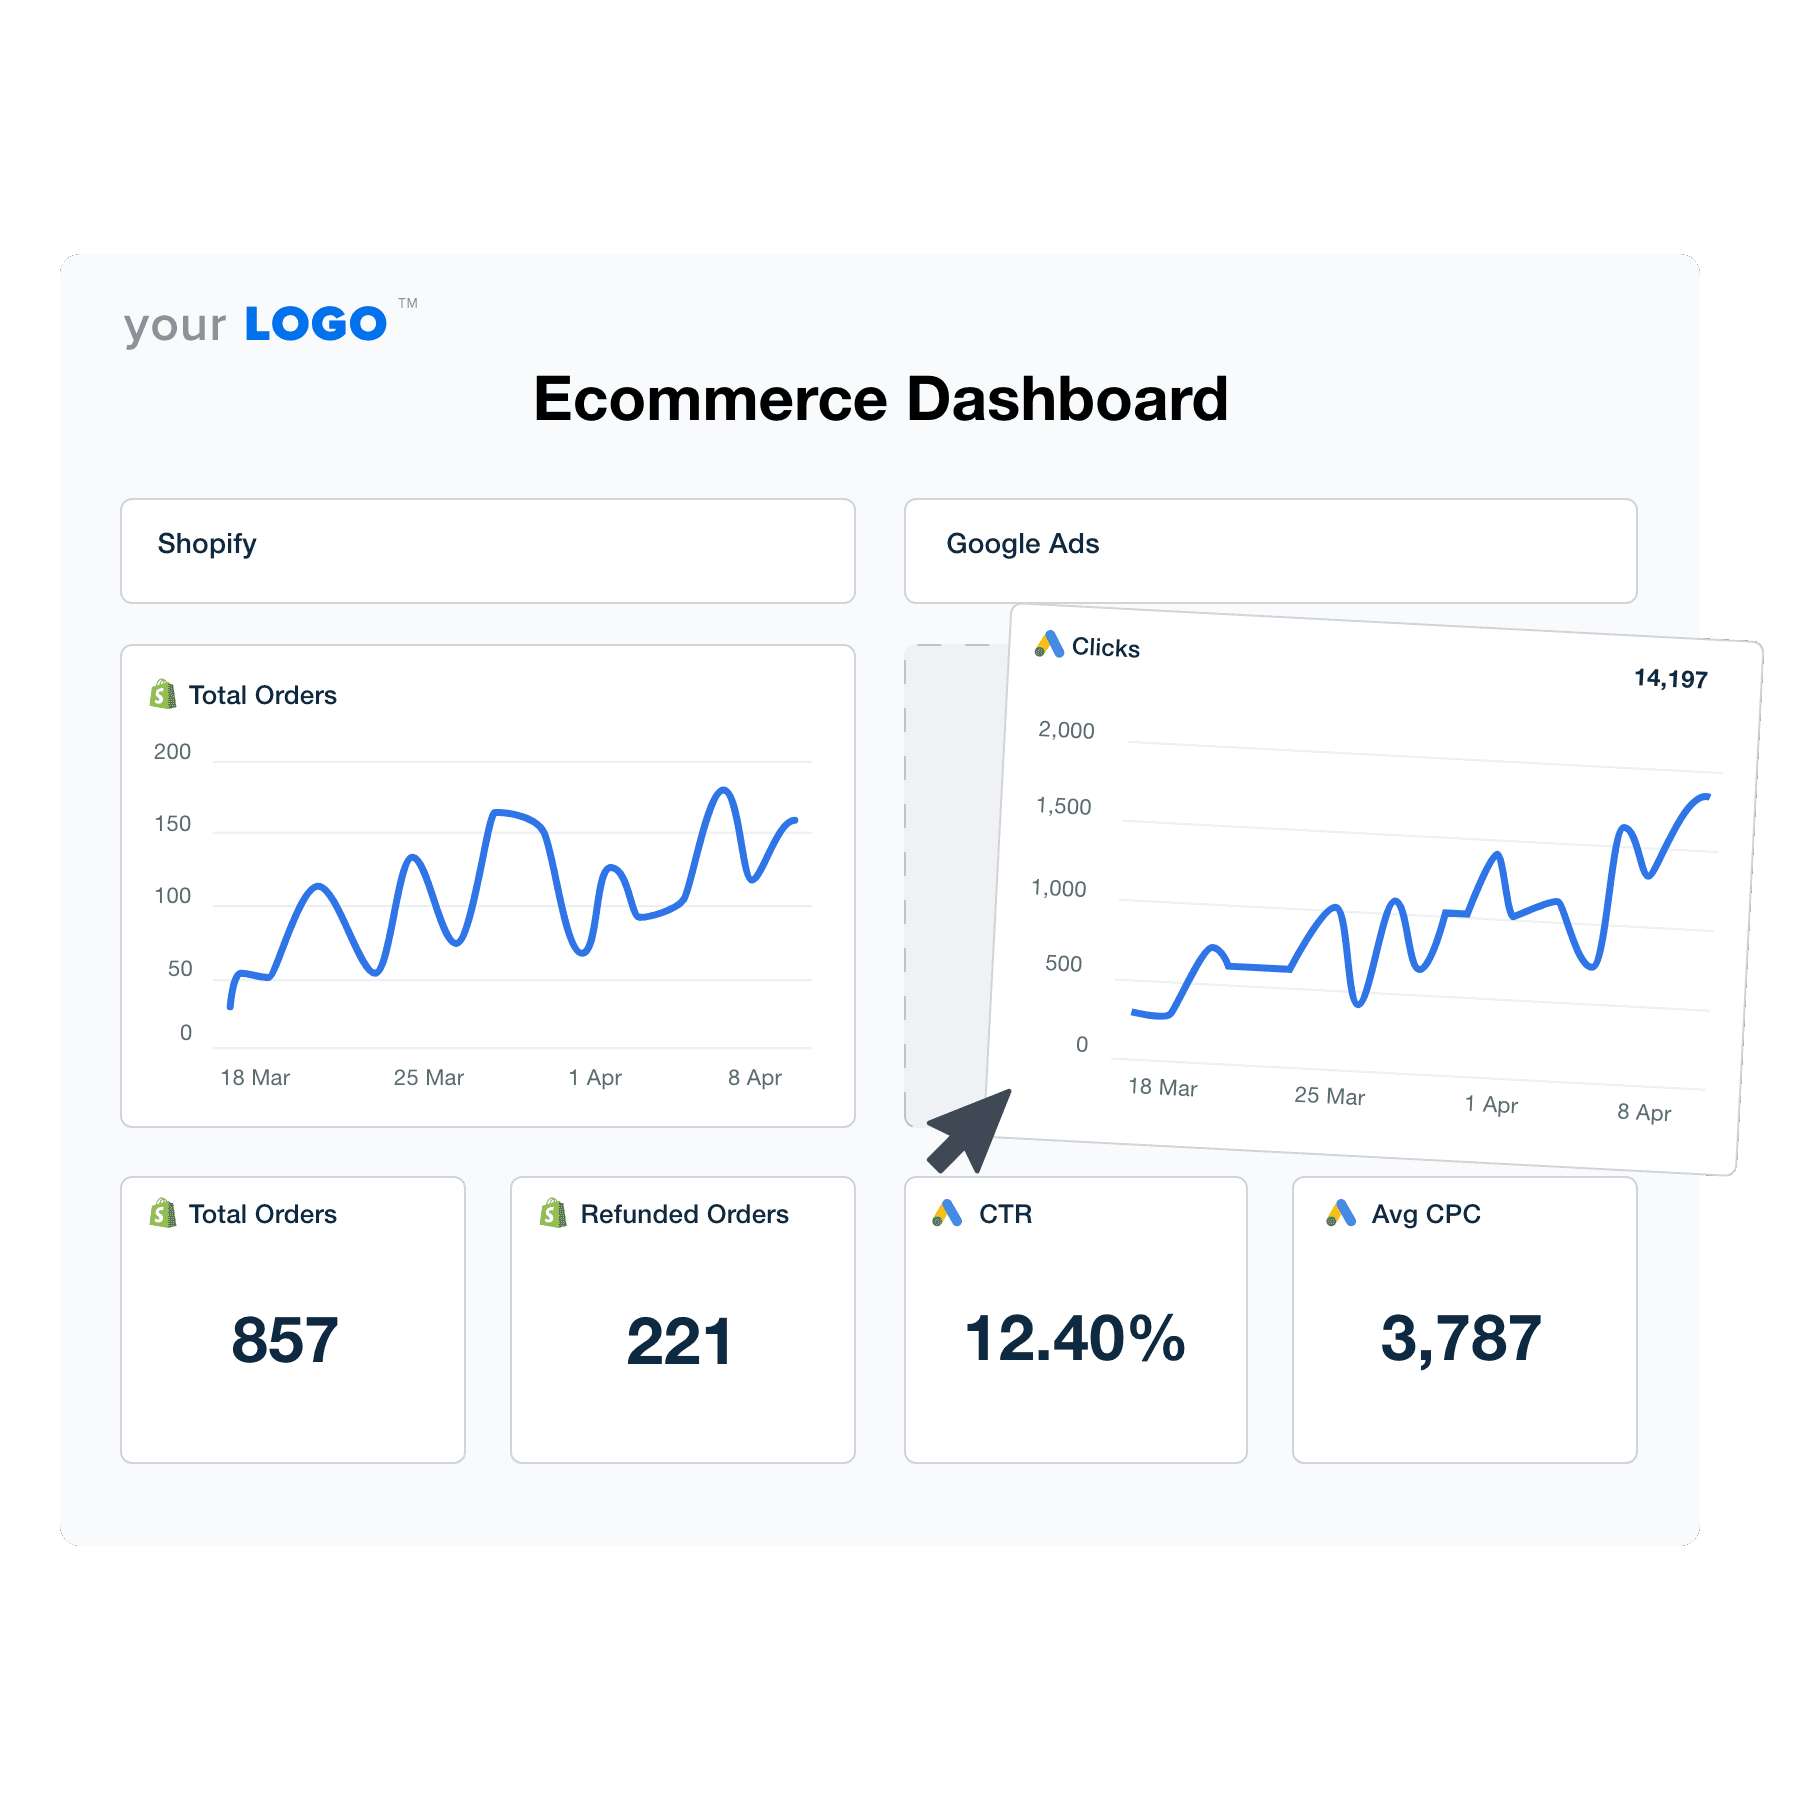
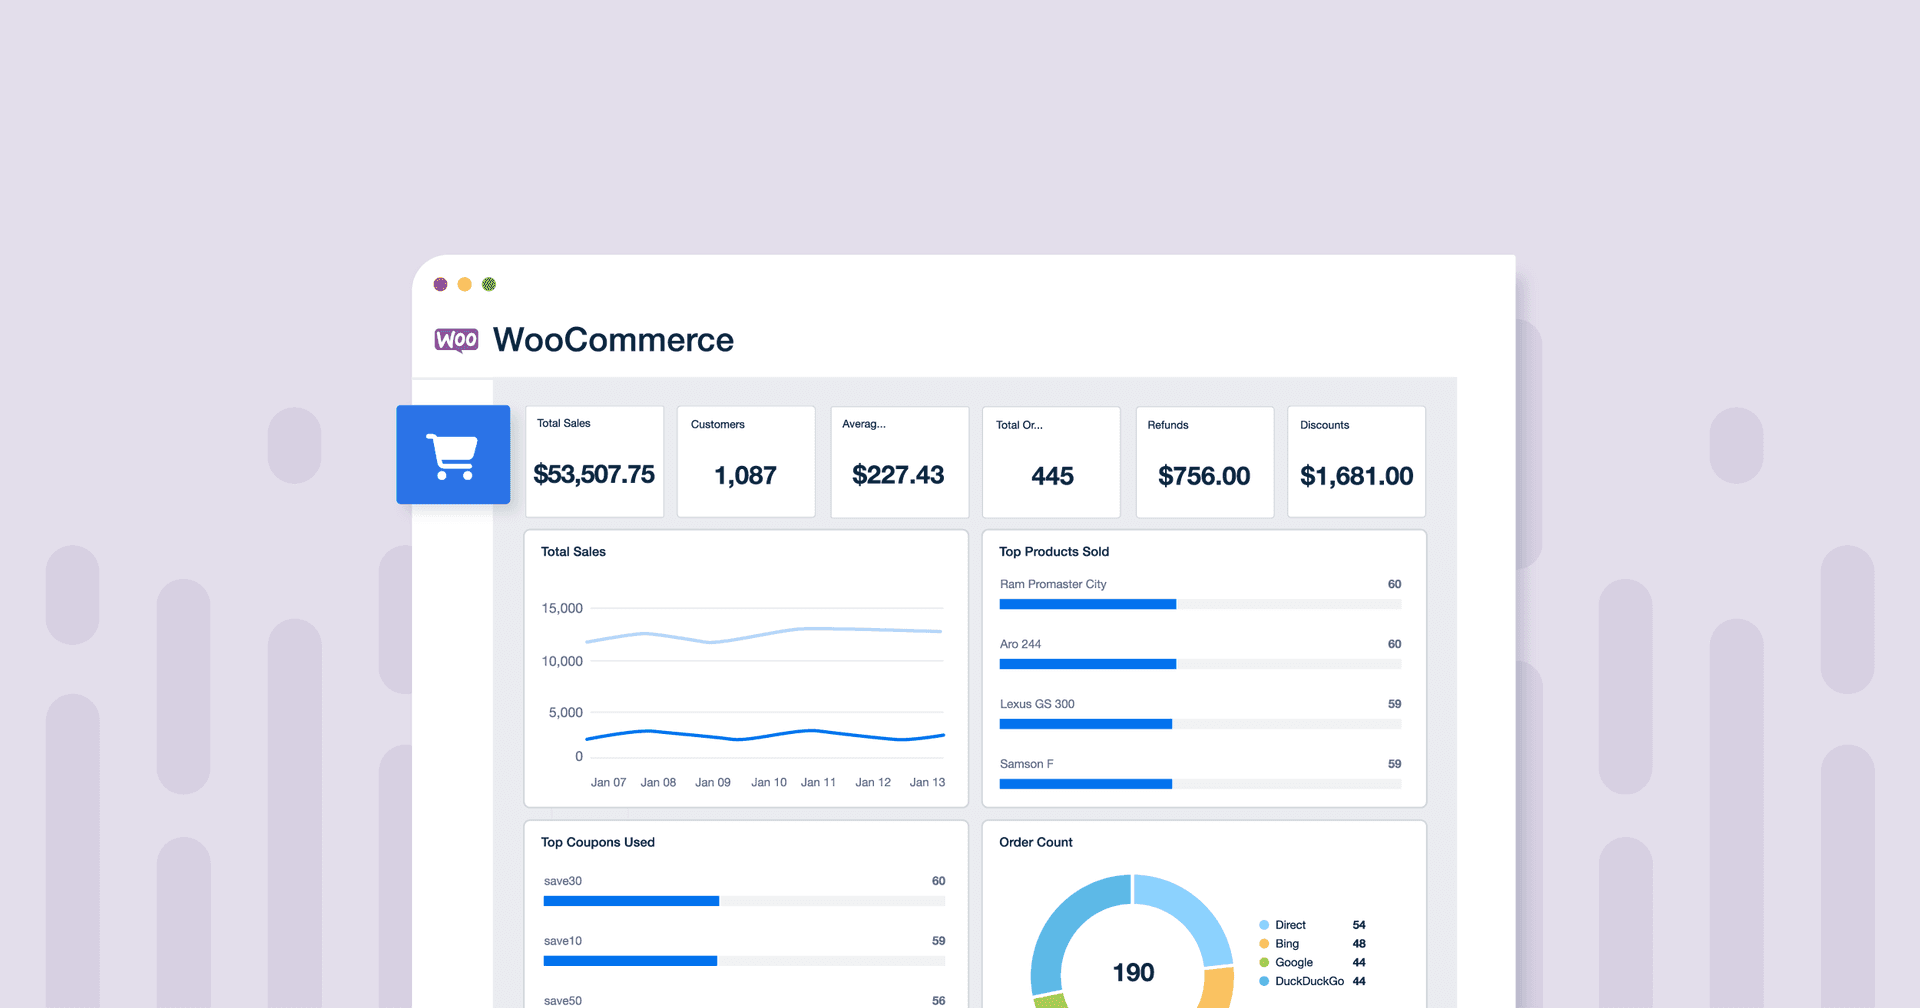
Track your client’s ecommerce KPIs, including clicks, orders, and cart abandonment, with a dedicated ecommerce dashboard template from AgencyAnalytics. Try it free for 14 days today!
Checkout abandonment rate
Checkout abandonment rate is distinct from cart abandonment rate, focusing specifically on customers who initiate the checkout process but do not complete their purchase.
While cart abandonment rate measures the percentage of users who add items to their cart but leave before starting the checkout, checkout abandonment rate zooms in on the final stage of the buying journey. This metric is crucial for ecommerce clients as it highlights potential issues in the checkout process, such as complicated forms, a lack of payment options, or unexpected shipping costs.
Marketing agencies leverage checkout abandonment rate to enhance the final steps of the purchase process. By focusing on simplifying checkout steps, offering multiple payment methods, and ensuring transparency in costs, agencies will significantly reduce the checkout abandonment rate. This leads to a smoother customer experience, higher conversion rates, and increased revenue, ultimately benefiting the client’s ecommerce performance.
Cost per acquisition (CPA)
Regardless of the marketing channel your client uses, knowing their cost per acquisition is crucial to scaling ad budgets. Aside from the overall cost per acquisition of each channel, it’s helpful to get more granular with this metric and look at it at the campaign, landing page, and individual product level to know what’s working best.
As mentioned, looking at CPA alongside other ROI metrics such as customer lifetime value (CLV) and AOV provides a much more complete picture. As BigCommerce highlights, ecommerce companies use average order value (AOV) and customer lifetime value to define a sustainable cost per acquisition (CPA). Conversion rates measure marketing efficiency, but CPA reveals whether a campaign is profitable.
Read more: Most Important BigCommerce Analytics to Track
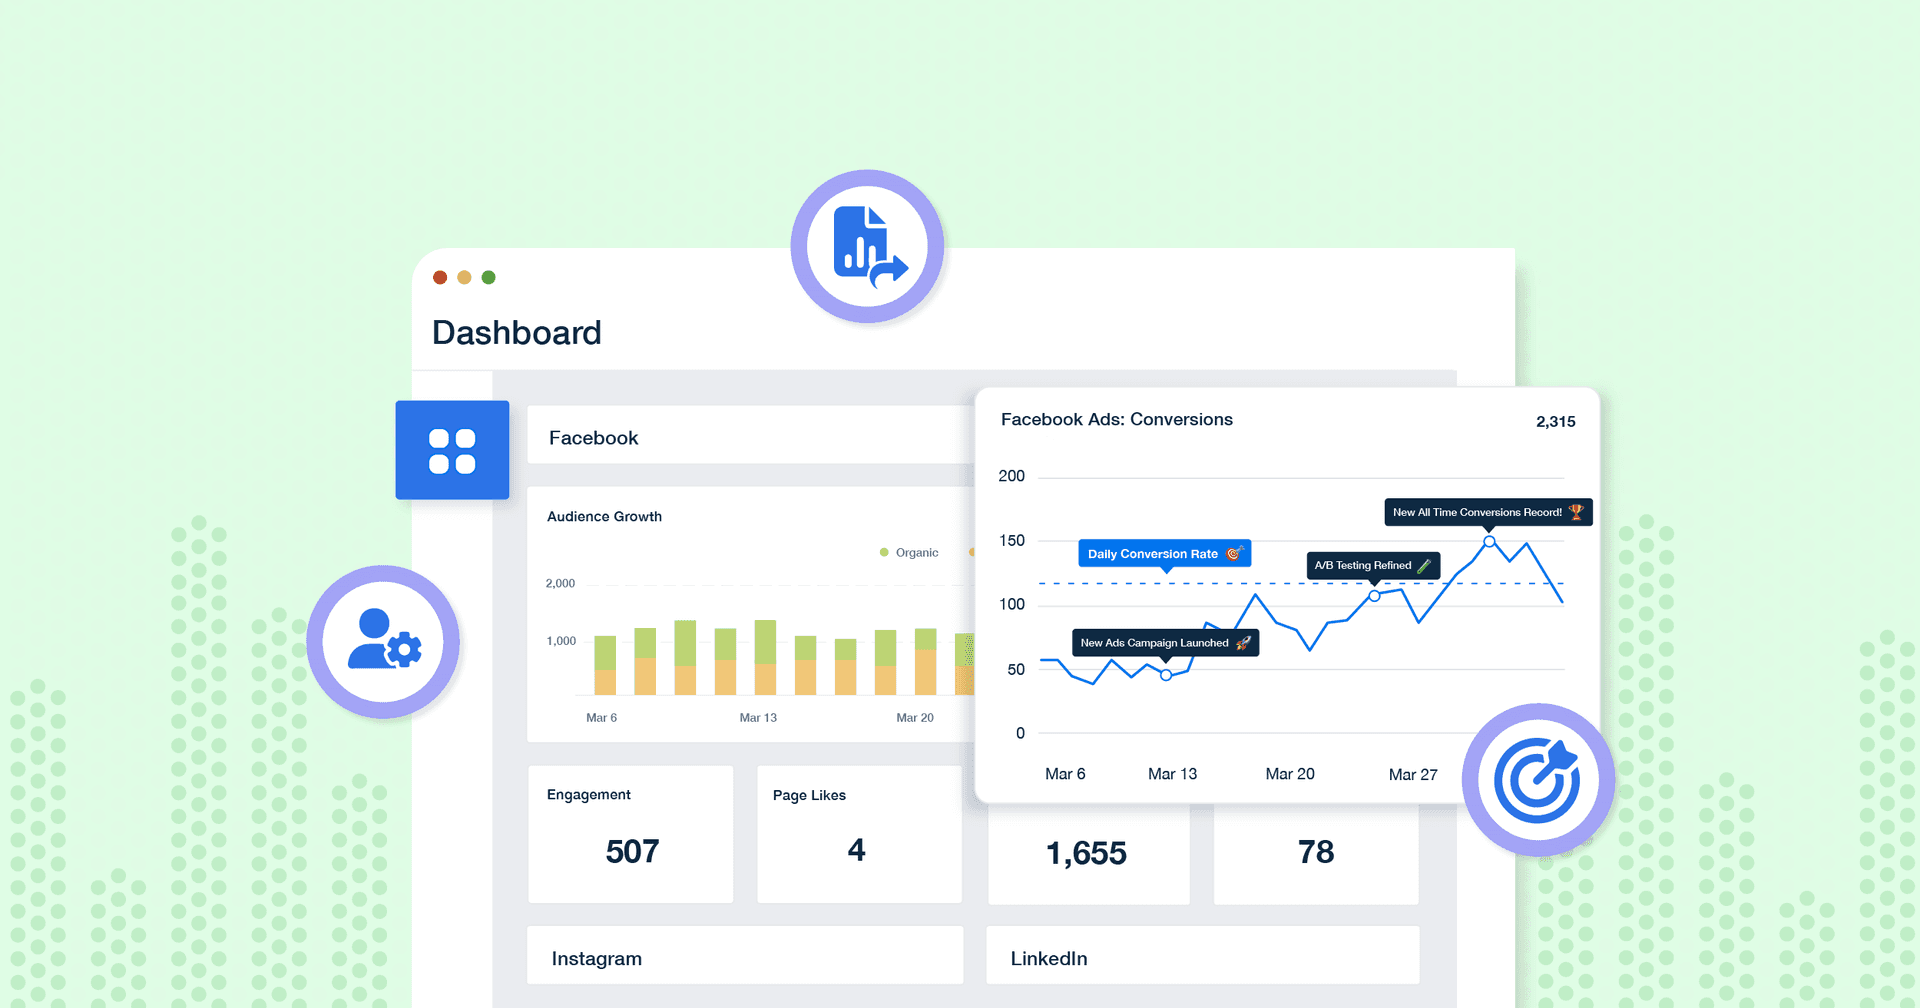
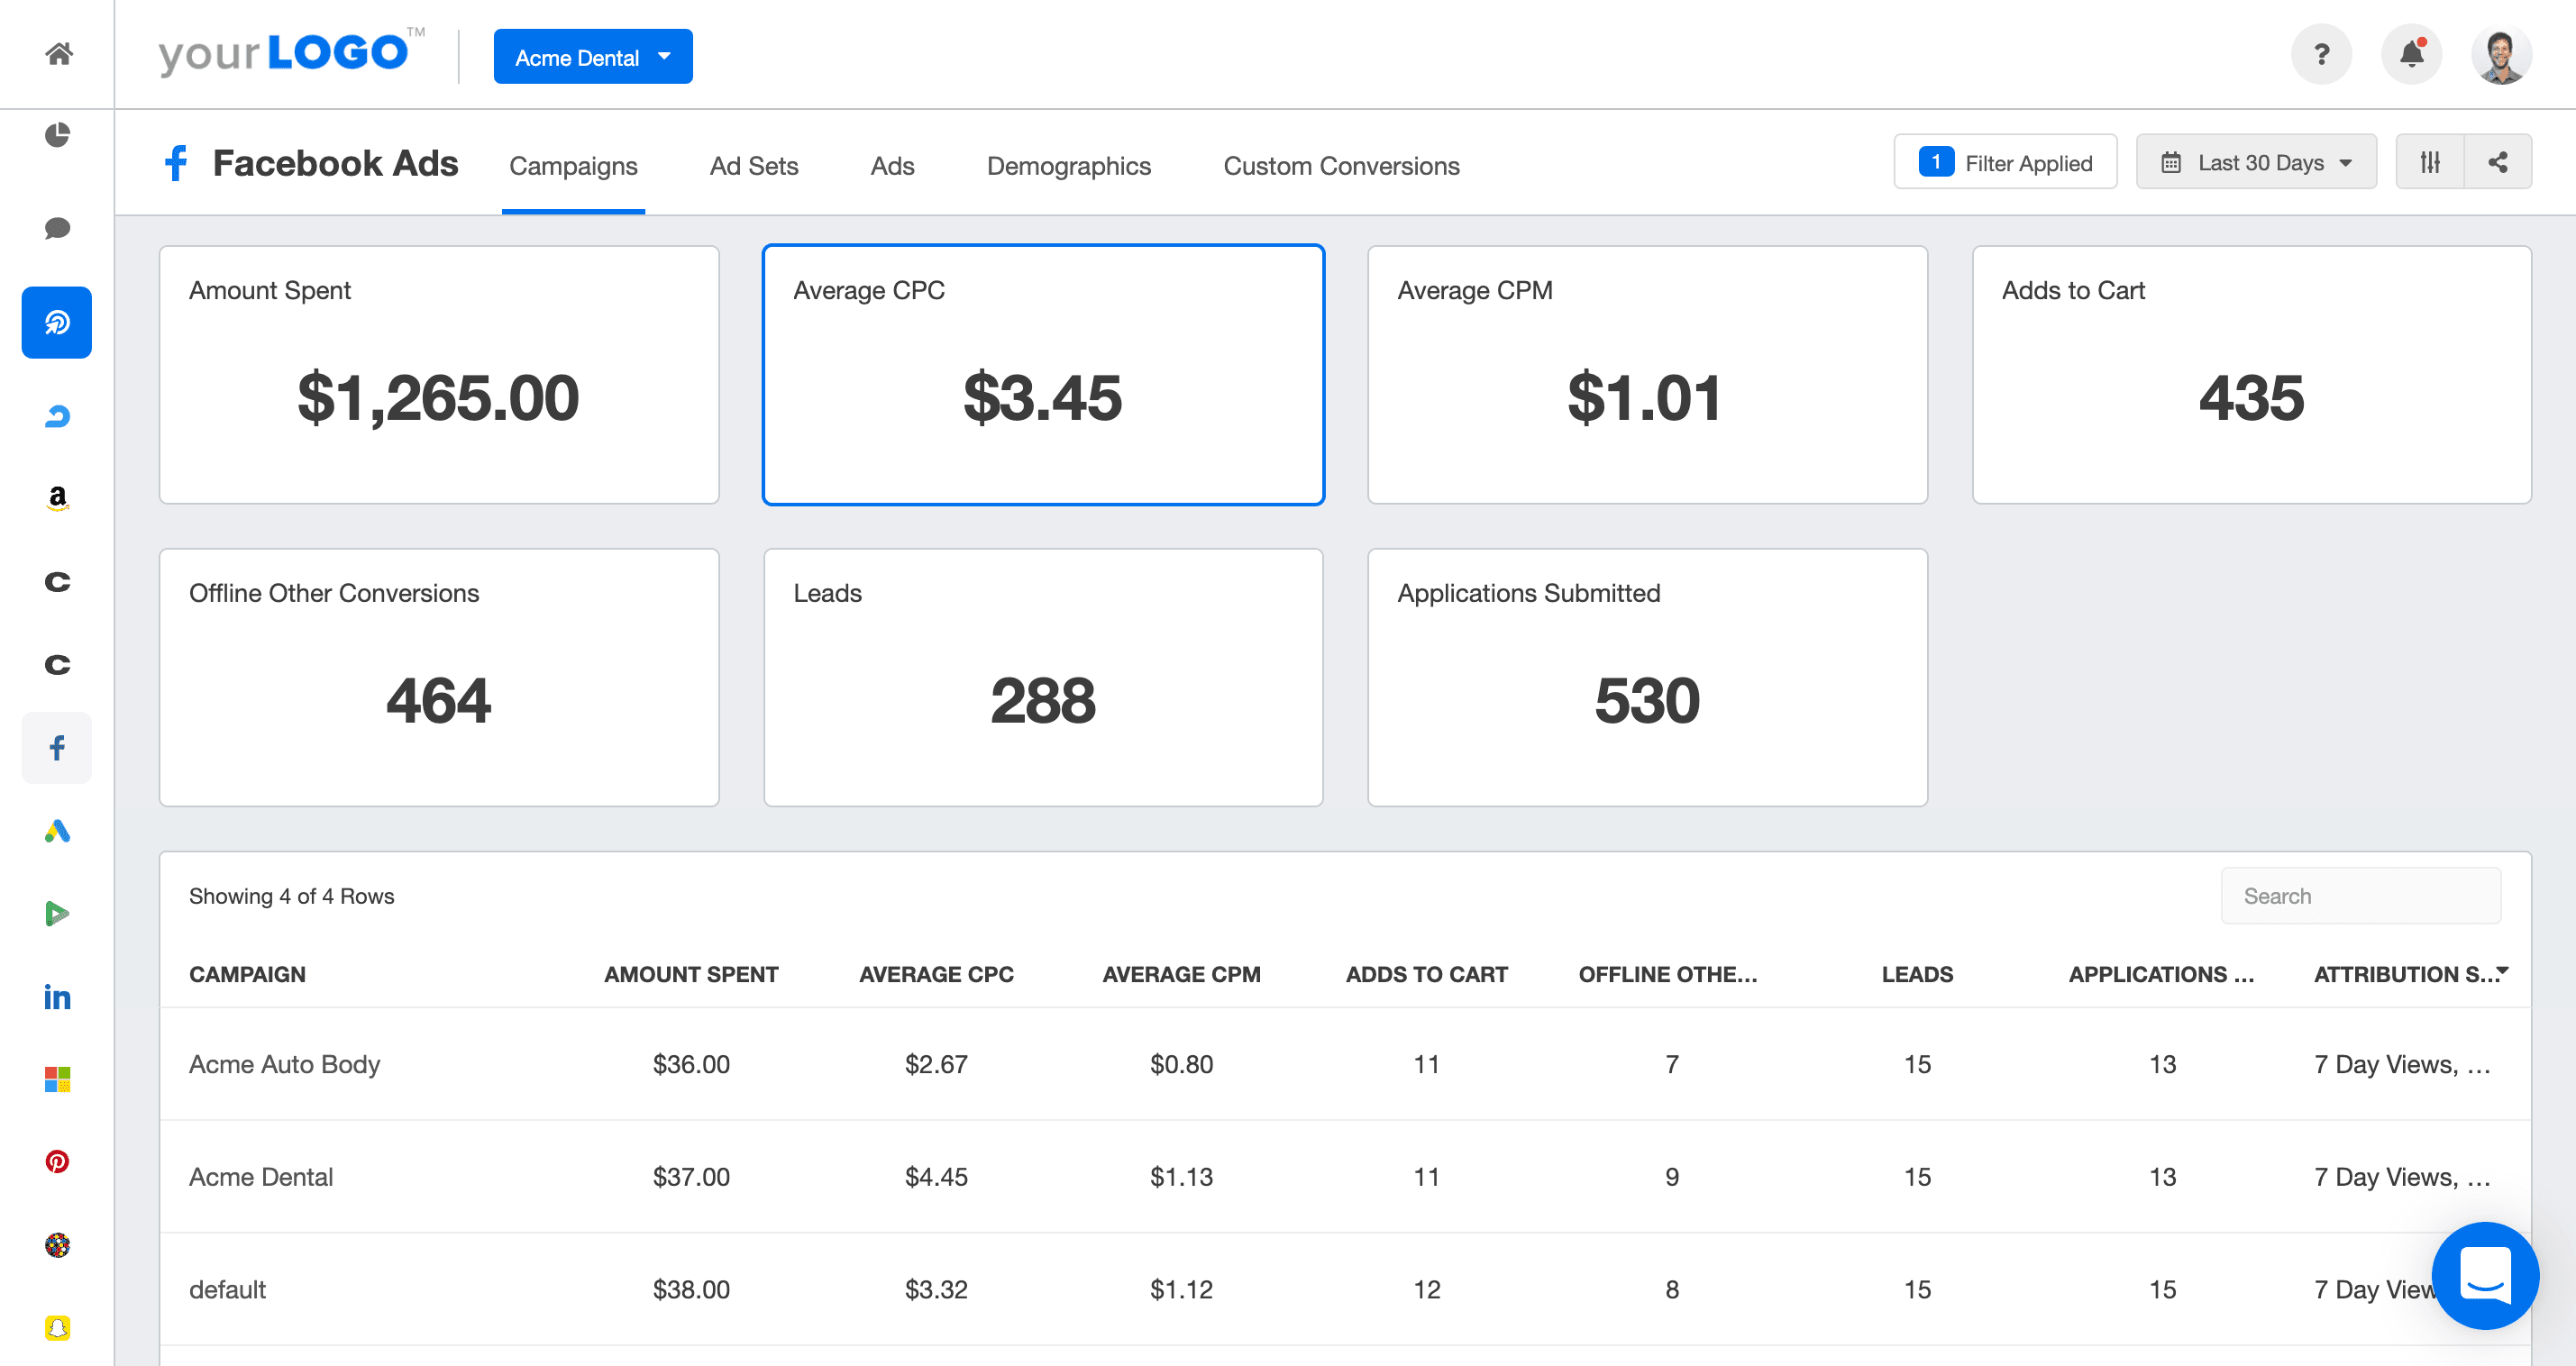
Below, you’ll see an example of a Facebook Ads dashboard that tracks cost per website conversion over time, along with the CPA of each publisher platform:
Return on ad spend (ROAS)
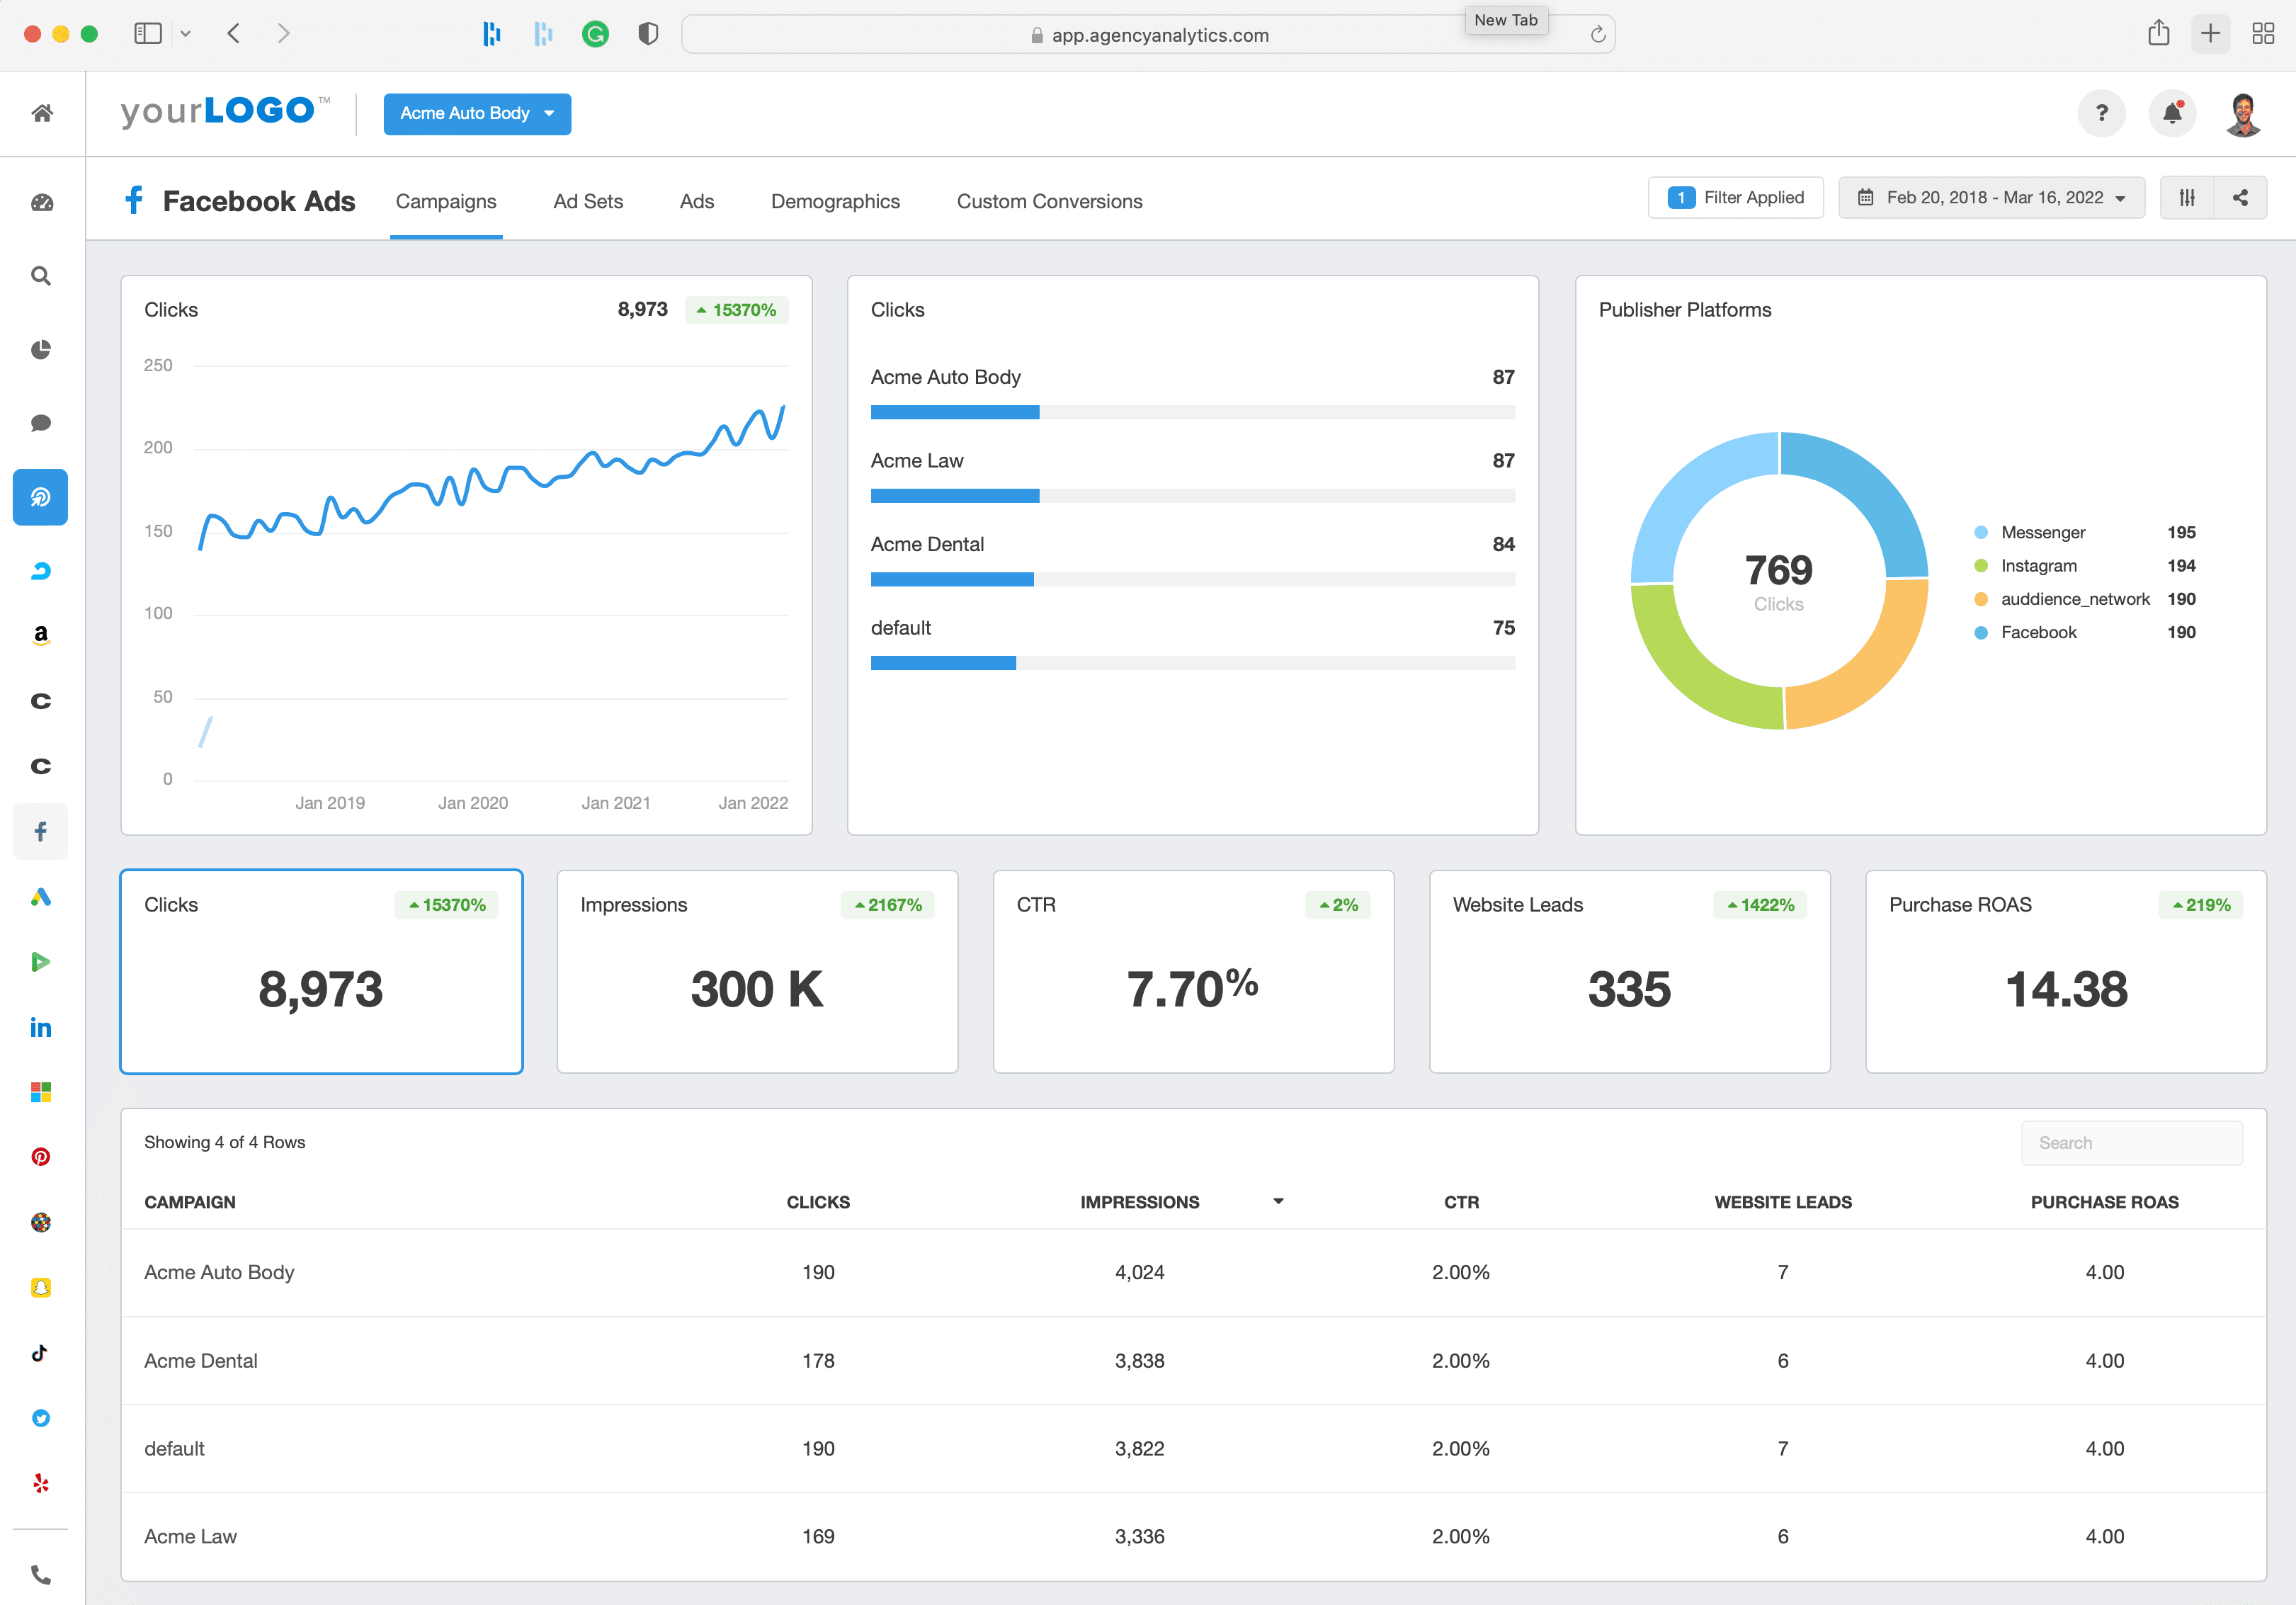
Similar to a business's overall ROI, ROAS tracks the amount of revenue generated for each dollar invested in advertising. Several factors go into determining what’s considered a “good” ROAS, although the most common benchmark used is a 4x or 400%, meaning for every dollar your client invests in ads, the store generates $4 in revenue.
What is the importance of ROAS for ecommerce stores? It shows which ads, ad groups, or campaigns deliver results, helping you decide where to invest more and what to cut back.
Customer retention and advocacy metrics
It’s often said that it’s much cheaper to get current customers to make another purchase than it is to acquire a new one, and this couldn’t be truer in ecommerce. Customer retention refers to the strategies a business uses to keep customers coming back and to maximize the value of each one.
In this section, we’ll look at several metrics and KPIs every ecommerce business should track to increase its repeat customer rate and profitability.
Read more: An Agency Guide to Shopify Analytics
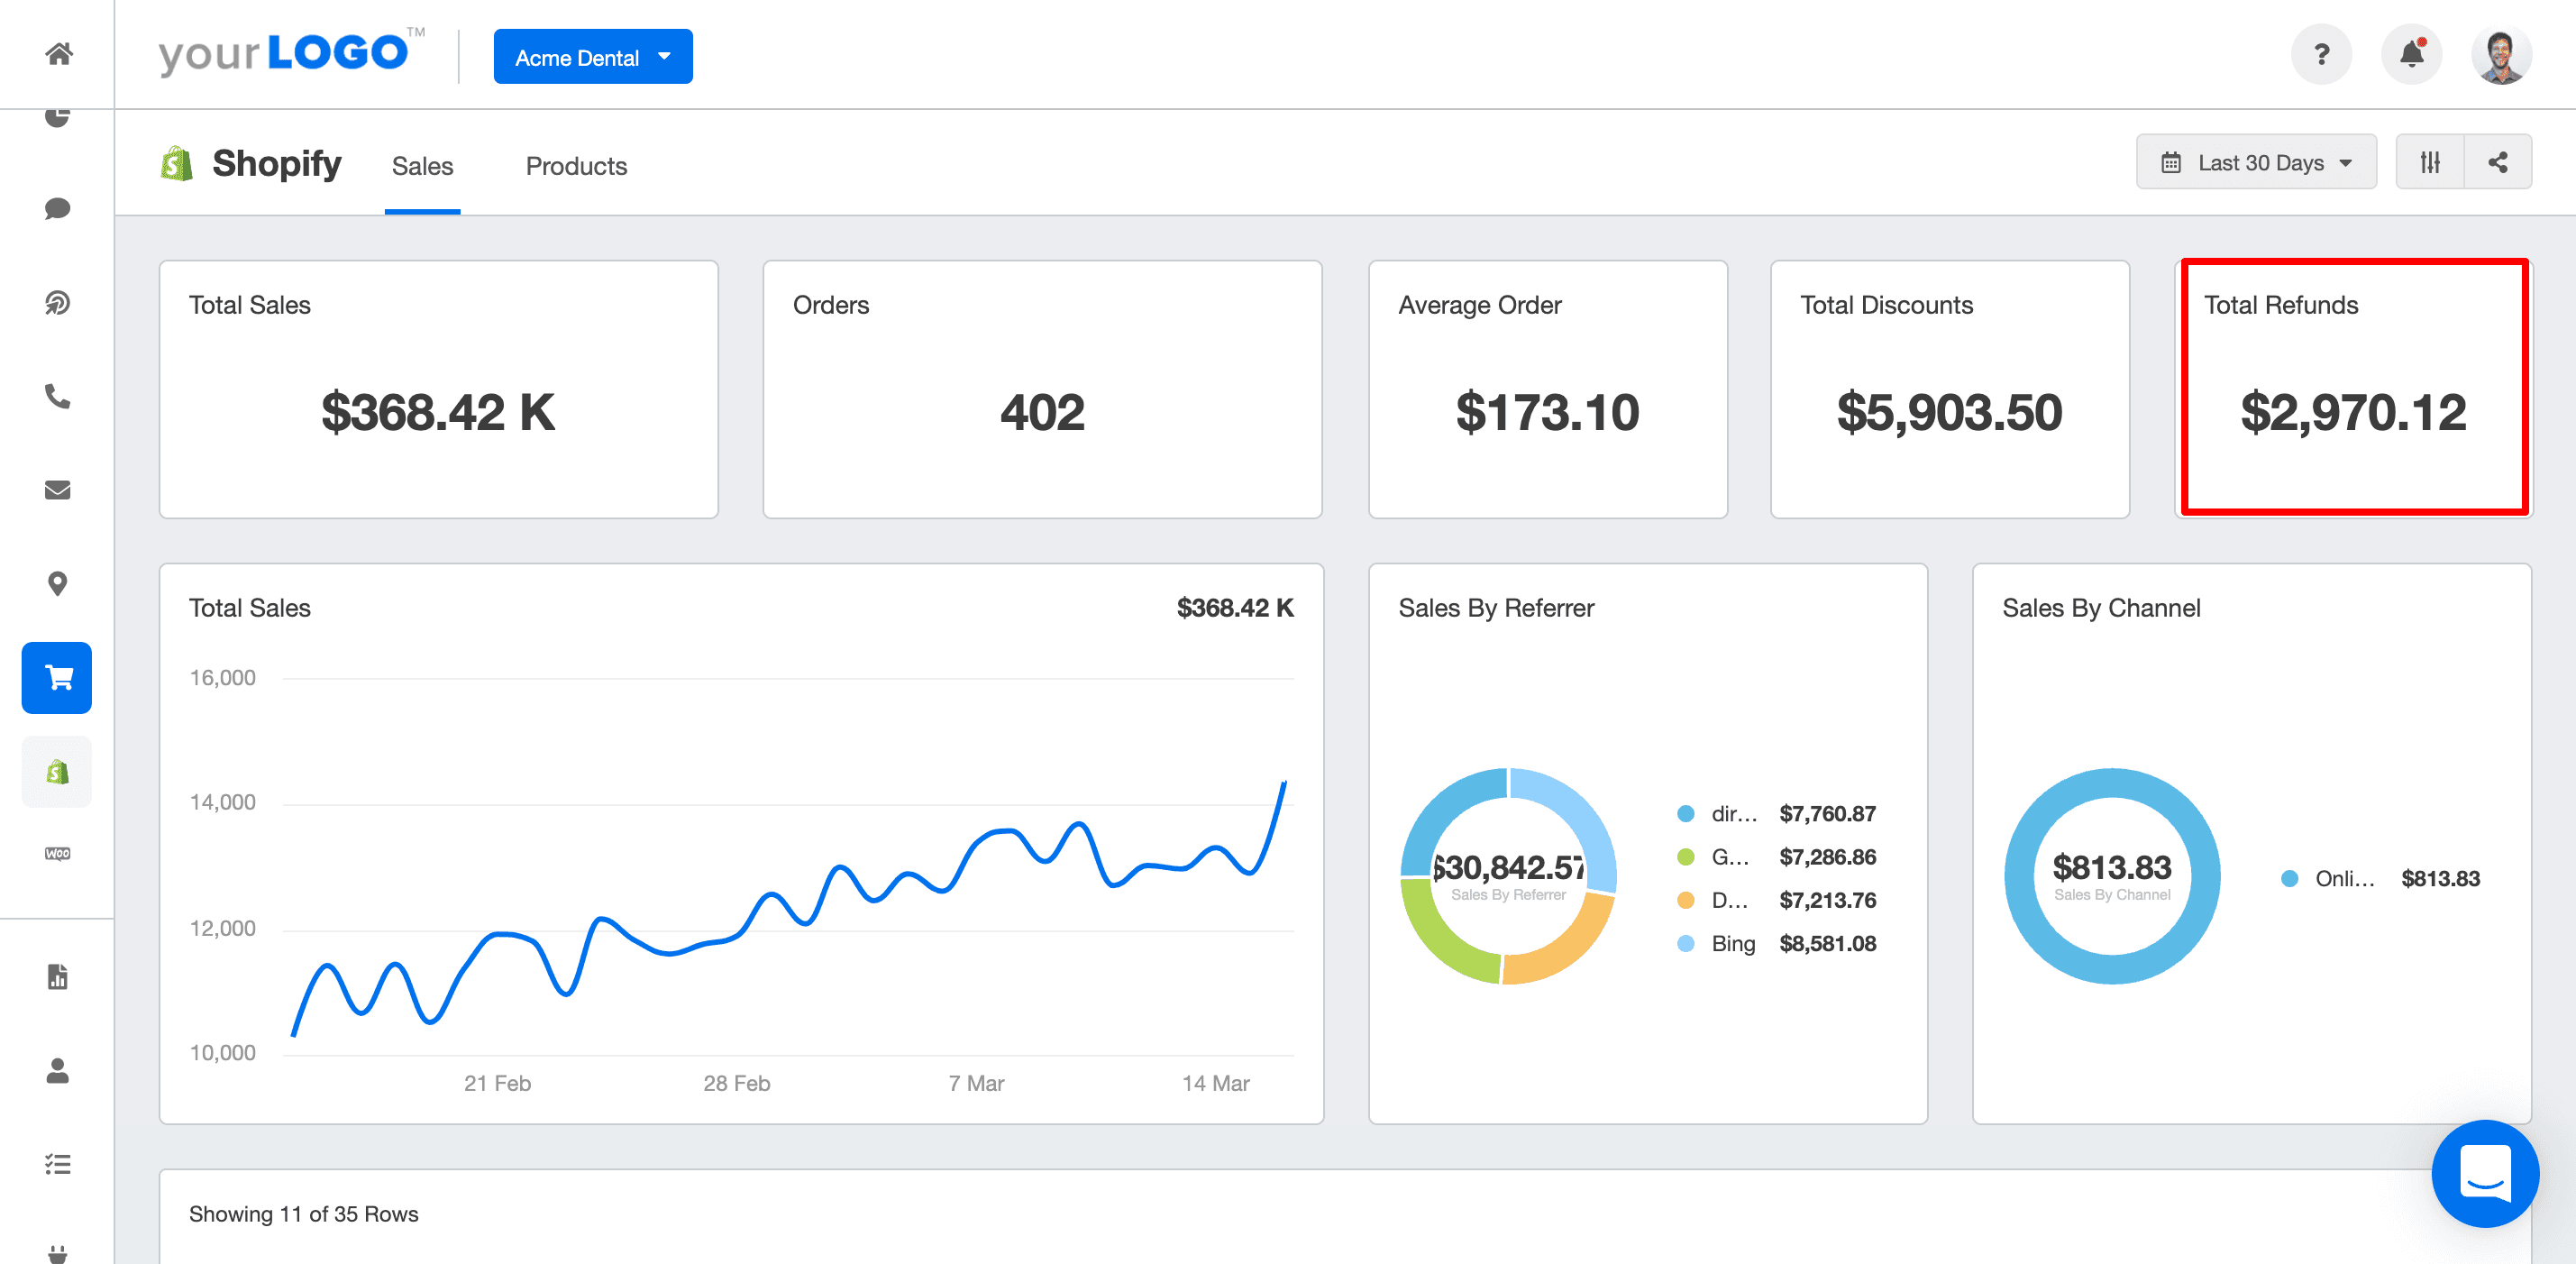
Refund and return rate
In analyzing the performance of individual products, it's critical to monitor the refund and return rate. Depending on the industry, returns may be relatively common—for example, in the fashion industry—and thus need to be a part of your client’s financial models.
Returns can be a powerful incentive for customers to click “buy now.” Knowing your store offers free returns or hassle-free exchanges reduces a shopper’s fear of buyer’s remorse and builds confidence in their decision. So, instead of treating returns and refunds as a cost, position them as an opportunity to strengthen trust, improve the customer experience, and ultimately drive long-term growth for your business.
That said, evaluating each product's refund and return rate is key to monitoring an ecommerce store's financial health.
Repeat customer rate
Customer retention and loyalty are all about increasing your client’s repeat customer rate, which is calculated as the number of customers who bought more than once divided by the total number of customers, typically over a 365-day rolling period. One of the main reasons this metric is so important is that as ad costs steadily go up, your client must make the most of its existing customers. In most studies, the average repeat customer rate is between 20% to 40%.
Some effective ways to improve customer retention include focusing on customer satisfaction, creating targeted retention email campaigns, launching a rewards program, and incorporating gamification into your ecommerce store.
Net promoter score (NPS) and customer satisfaction score (CSAT)
Net promoter score (NPS) and customer satisfaction score (CSAT) are vital advocacy metrics for ecommerce clients. They provide clear insights into customer loyalty and overall satisfaction. NPS measures the likelihood of customers recommending a business to others, while CSAT gauges their satisfaction with specific interactions or purchases. Both metrics help businesses understand customer sentiment and identify areas for improvement.
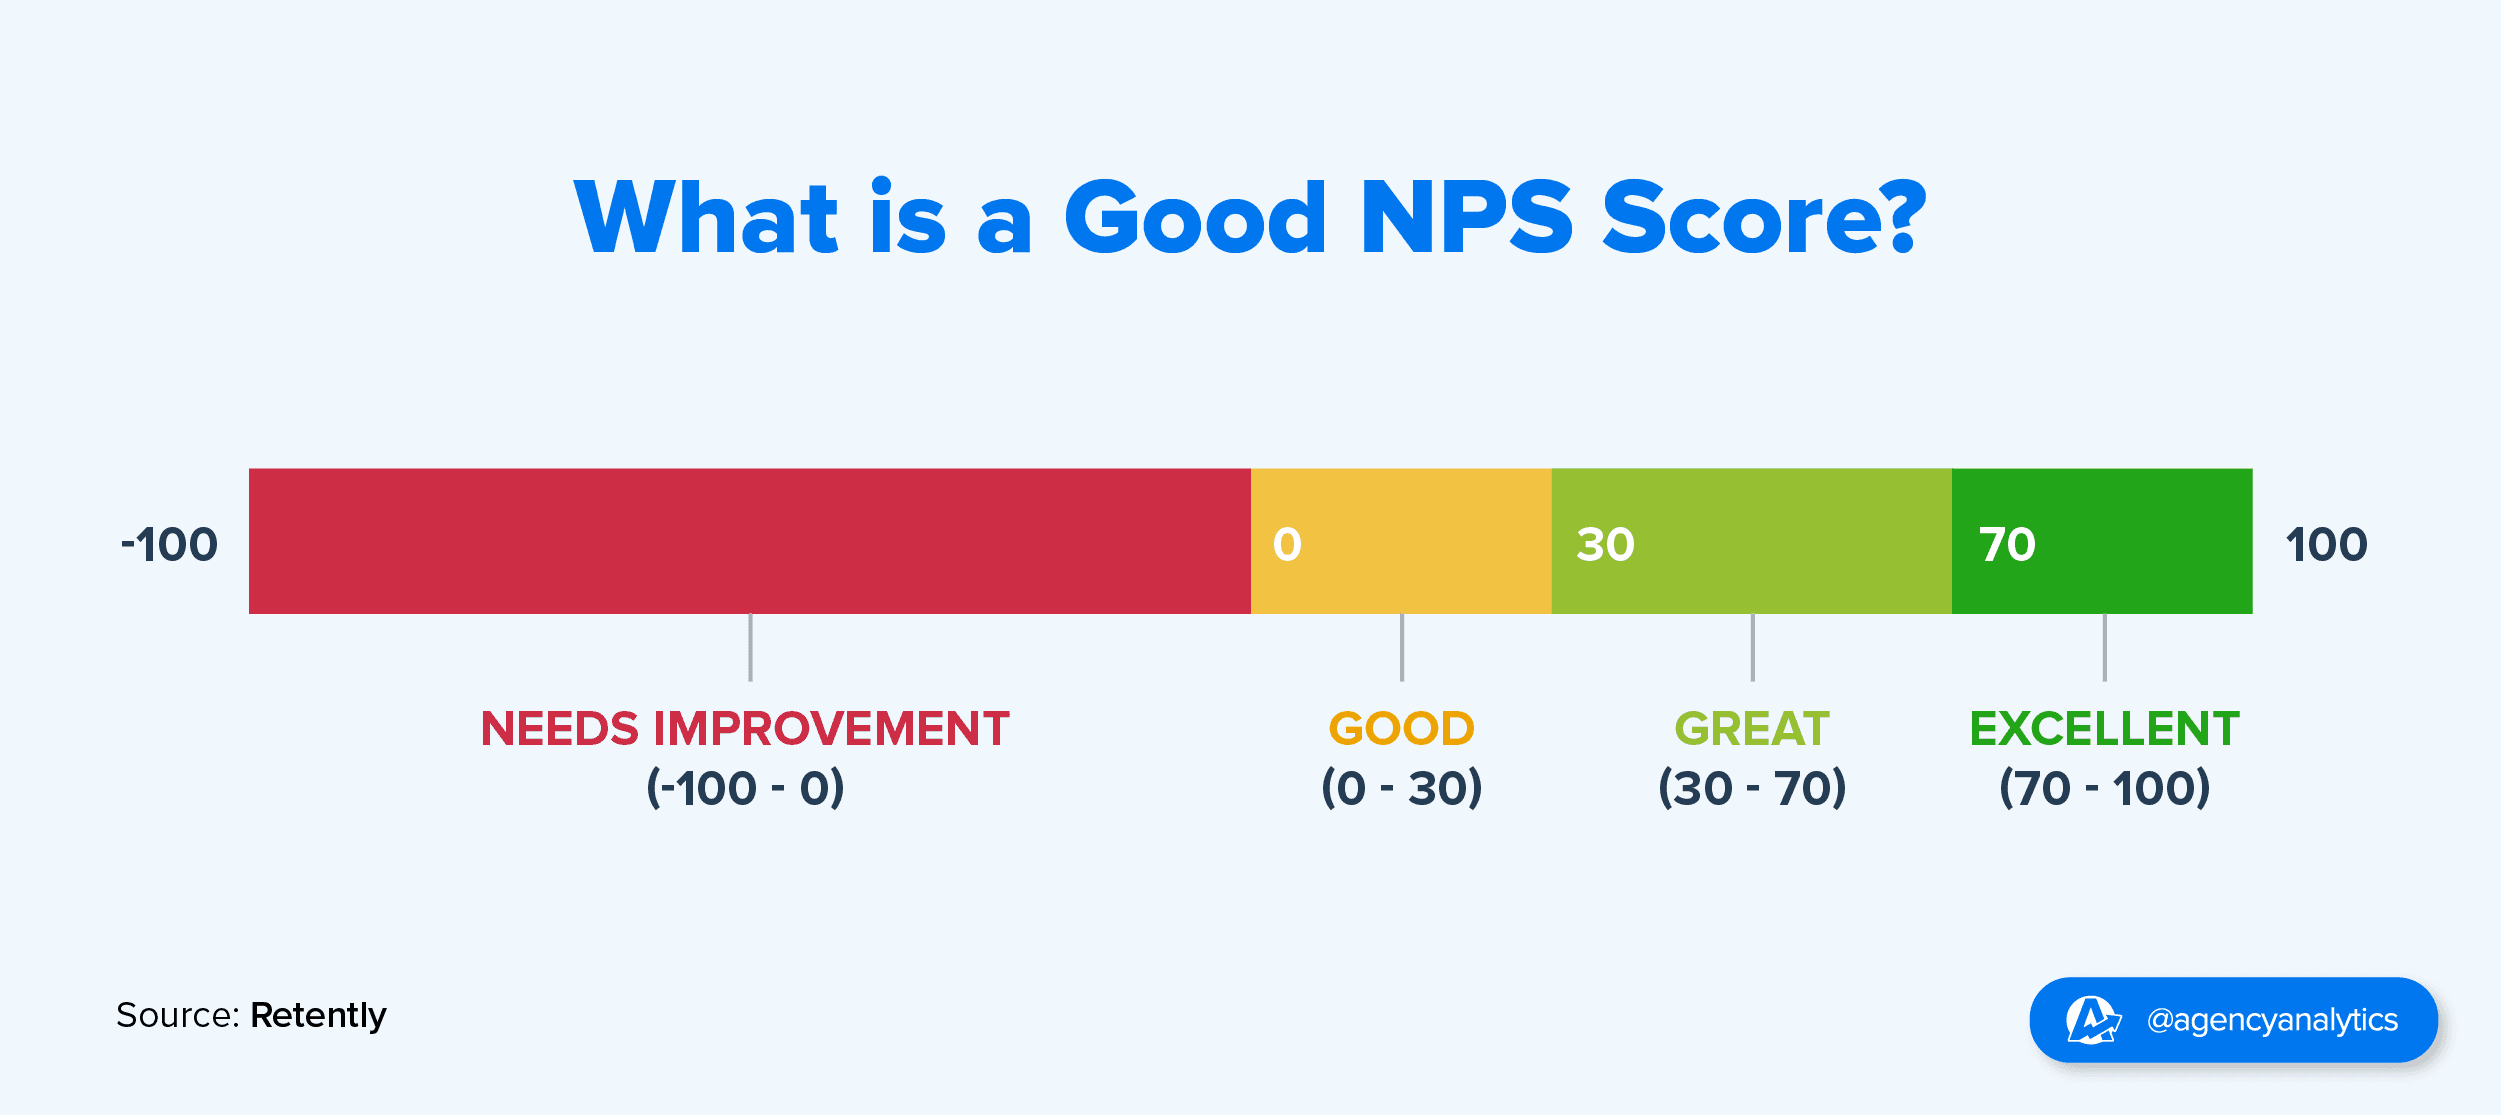
By regularly tracking NPS and CSAT, marketing agencies develop strategies to enhance customer experience and loyalty. High NPS and CSAT scores indicate positive customer experiences, leading to repeat business and referrals. Agencies use these metrics to pinpoint successful practices and address any areas of concern, ultimately driving long-term growth and boosting customer retention rate.
Customer lifetime value (CLV)
Finally, when it comes to retention, knowing your client’s customer lifetime value is key to planning ad budgets and understanding their timeline of profitability. The “lifetime” of an ecommerce customer is typically measured at 12 and 24 months and indicates at what point your client will break even with new customers and reach profitability.
Calculating CLV enables agencies like ours to estimate the long-term value of acquiring a new customer, which is essential for determining the profitability of acquisition efforts.
Ken Krystofik, Head of Client Development, Intellisea
In other words, CLV is the single most important ecommerce metric to track to make informed marketing decisions and increase the bottom line.
Impress clients and save hours with custom, automated reporting.
Join 7,000+ agencies that create reports in under 30 minutes per client using AgencyAnalytics. Get started for free. No credit card required.
Already have an account?
Log inFocus on tracking the right ecommerce metrics
Running a successful ecommerce business involves wearing many hats—from branding, marketing, managing suppliers, and providing customer support. As an agency, it’s essential to track the metrics that drive profitability for your clients. Key metrics are foundational indicators of success for ecommerce businesses, helping to monitor sales performance, track operational effectiveness, and provide actionable insights.
Each of the ecommerce metrics mentioned above help you with this goal by helping you identify which strategies are performing and which need more attention.
Use customizable marketing dashboards and KPI reports to create comprehensive reports for your clients. Simply customize the template for each client, and their live metrics will populate on their own.
Read More: 15 Marketing Dashboards To Help Your Marketing Agency Scale
Your agency only needs to provide the marketing creative and write a simple executive summary before each report.
Taking a data-driven approach to growth is a valuable endeavor for any ecommerce business. If you’re ready to track these metrics, check out our prebuilt ecommerce dashboard template or our comprehensive ecommerce report template to start automating your client’s ecommerce analytics.

Written by
Peter Foy is a content marketer with a focus on SaaS companies. Based in Toronto, when he’s not writing he’s usually studying data science and machine learning.
Read more posts by Peter FoySee how 7,000+ marketing agencies help clients win
Free 14-day trial. No credit card required.


