Table of Contents
QUICK SUMMARY:
Tired of dashboards that just spit out metrics? Learn how to build strategic dashboards that actually drive decisions. We’ll walk through how agencies use them to track performance, align client goals, and grow smarter, plus we’ll share some strategic dashboard examples to illustrate exactly how to use these powerful analytics tools in the context of everyday marketing agency life.
Tracking performance metrics is table stakes for any data-driven agency. The real challenge? Turning those metrics into direction.
Too many dashboards get stuck in reactive mode. They monitor Key Performance Indicators (KPIs), visualize data sets, and highlight performance metrics… but stop short of telling a useful story that decision makers can act on.
That’s where strategic dashboards change the game. They go beyond status updates to connect execution with long-term business goals, giving you a clearer picture of what’s working, what’s off track, and where to focus next.
In this guide, you’ll learn how to build strategic dashboards that actually move the needle. We’ll break down how they differ from other dashboard types, when to use them, and how to create ones that drive results for your clients and growth for your agency.
How Are Strategic Dashboards Different From Operational Dashboards?
Not all dashboards serve the same purpose. To lead effectively, you need to separate the tools that help you execute from those that help you steer.
Operational Dashboards (AKA Tactical Dashboards / Analytical Dashboards)
Operational dashboards are your go-to tools for managing day-to-day activity. They give your account managers the real-time insights they need to keep campaigns moving and budgets on track. They’re built for quick reactions, like flagging issues, monitoring trends, and supporting fast, informed decisions.
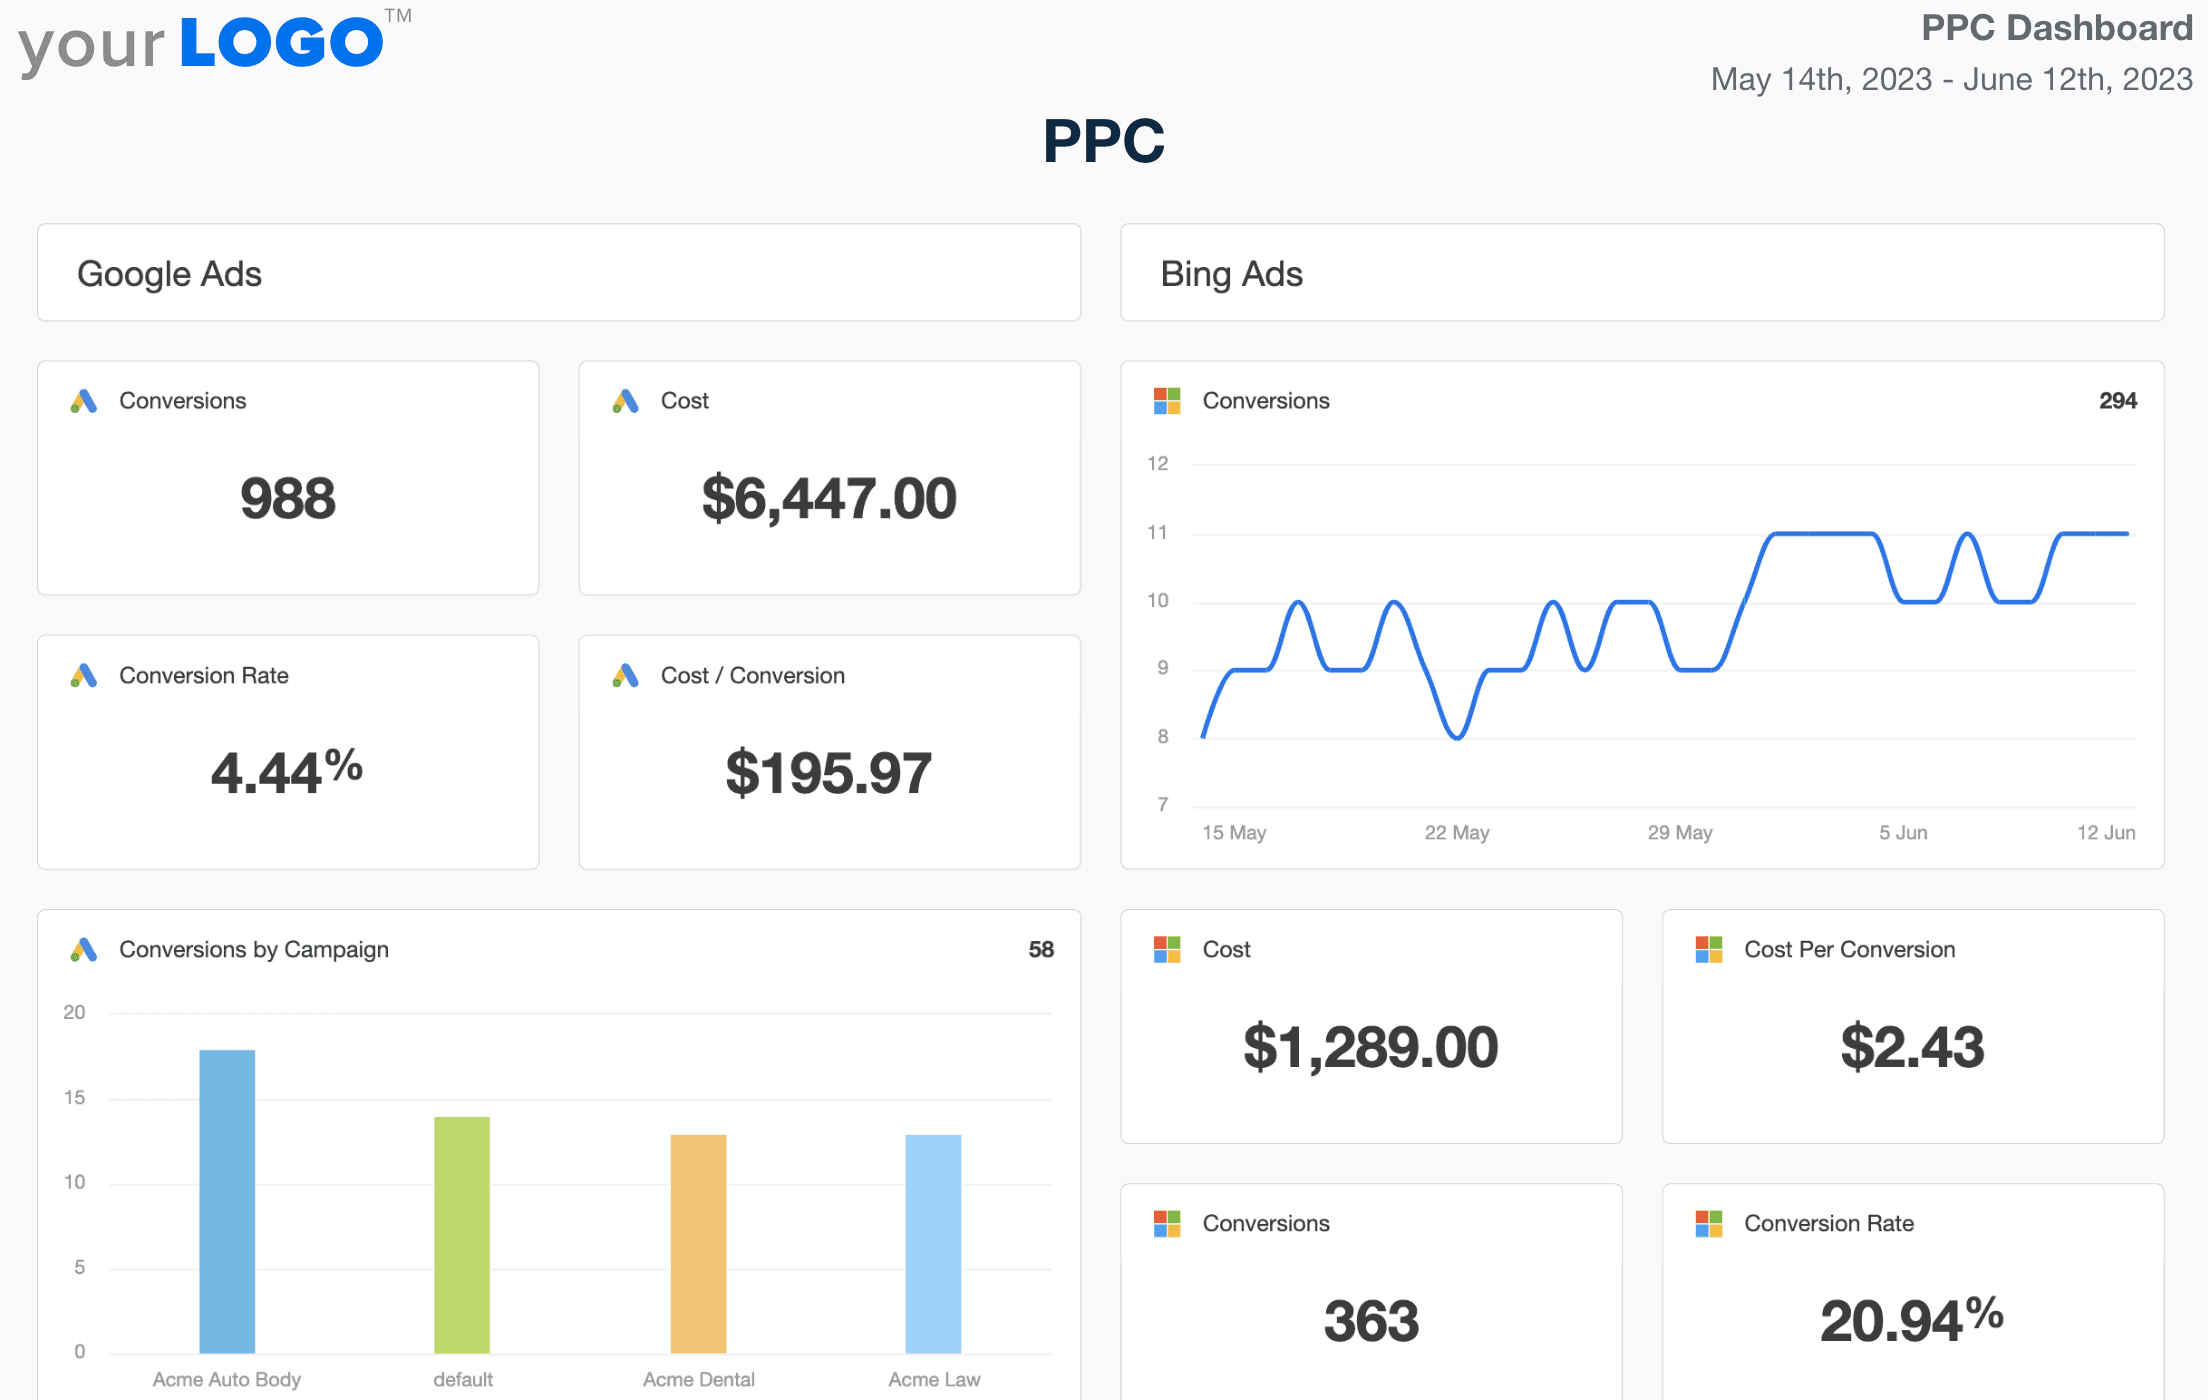
A PPC dashboard is a good example of a tactical dashboard. It helps account managers track daily spend, conversions, ROAS, and performance trends. It’s perfect for dialing in budget pacing, identifying underperforming campaigns, and optimizing performance mid-flight.
Another example: this KPI dashboard answers questions like:
Are we pacing correctly against the monthly PPC budget?
Which campaigns are underdelivering on conversions?
Is CPC increasing in a way that needs intervention?
Tactical dashboards don’t replace strategic planning, but they do make sure your team can execute it with precision.
Strategic Dashboards
Unlike operational dashboards, strategic dashboards consolidate complex information from data analytics platforms, CRMs, sales tools, and campaign data to show a bird's-eye view of overall progress, whether for clients or your agency.
You can depend on strategic dashboards to answer questions like:
Are we improving client retention and lifetime value over time?
Which channels are bringing in the highest quality leads this quarter?
Are we moving the needle on our growth and revenue targets?
A good example of a strategic dashboard is a multi-client agency dashboard you would use to understand client health, pipeline efficiency, revenue by channel, and campaign impact.
We’ll get into more examples of strategic dashboards in the next section. For now, here’s how these two types of dashboards compare:
| Operational Dashboards | Strategic Dashboards |
|---|---|---|
Primary Focus | Day-to-day execution | Long-term goals and trends |
Typical Users | Account managers, specialists | Senior managers, agency leaders, clients |
Data Depth | Channel-specific, granular metrics | High-level, cross-channel KPIs |
Key Questions Answered | What’s happening right now? | Are we making progress? What should change? |
Common Use Cases | Campaign pacing, task progress, daily KPIs | Client retention, growth metrics, ROI over time |
Use both and you’ll always know what’s happening now and where you're going next.
Impress clients and save hours with custom, automated reporting.
Join 7,000+ agencies that create reports in under 30 minutes per client using AgencyAnalytics. Get started for free. No credit card required.
Already have an account?
Log inStrategic Dashboard Examples
Now that you have a better idea of the differences between strategic and operational dashboards, what do strategic dashboards look like?
Here are a few dashboard examples that show how agencies are putting their data to work.
Marketing Agency Dashboard / Multi-Client Dashboard
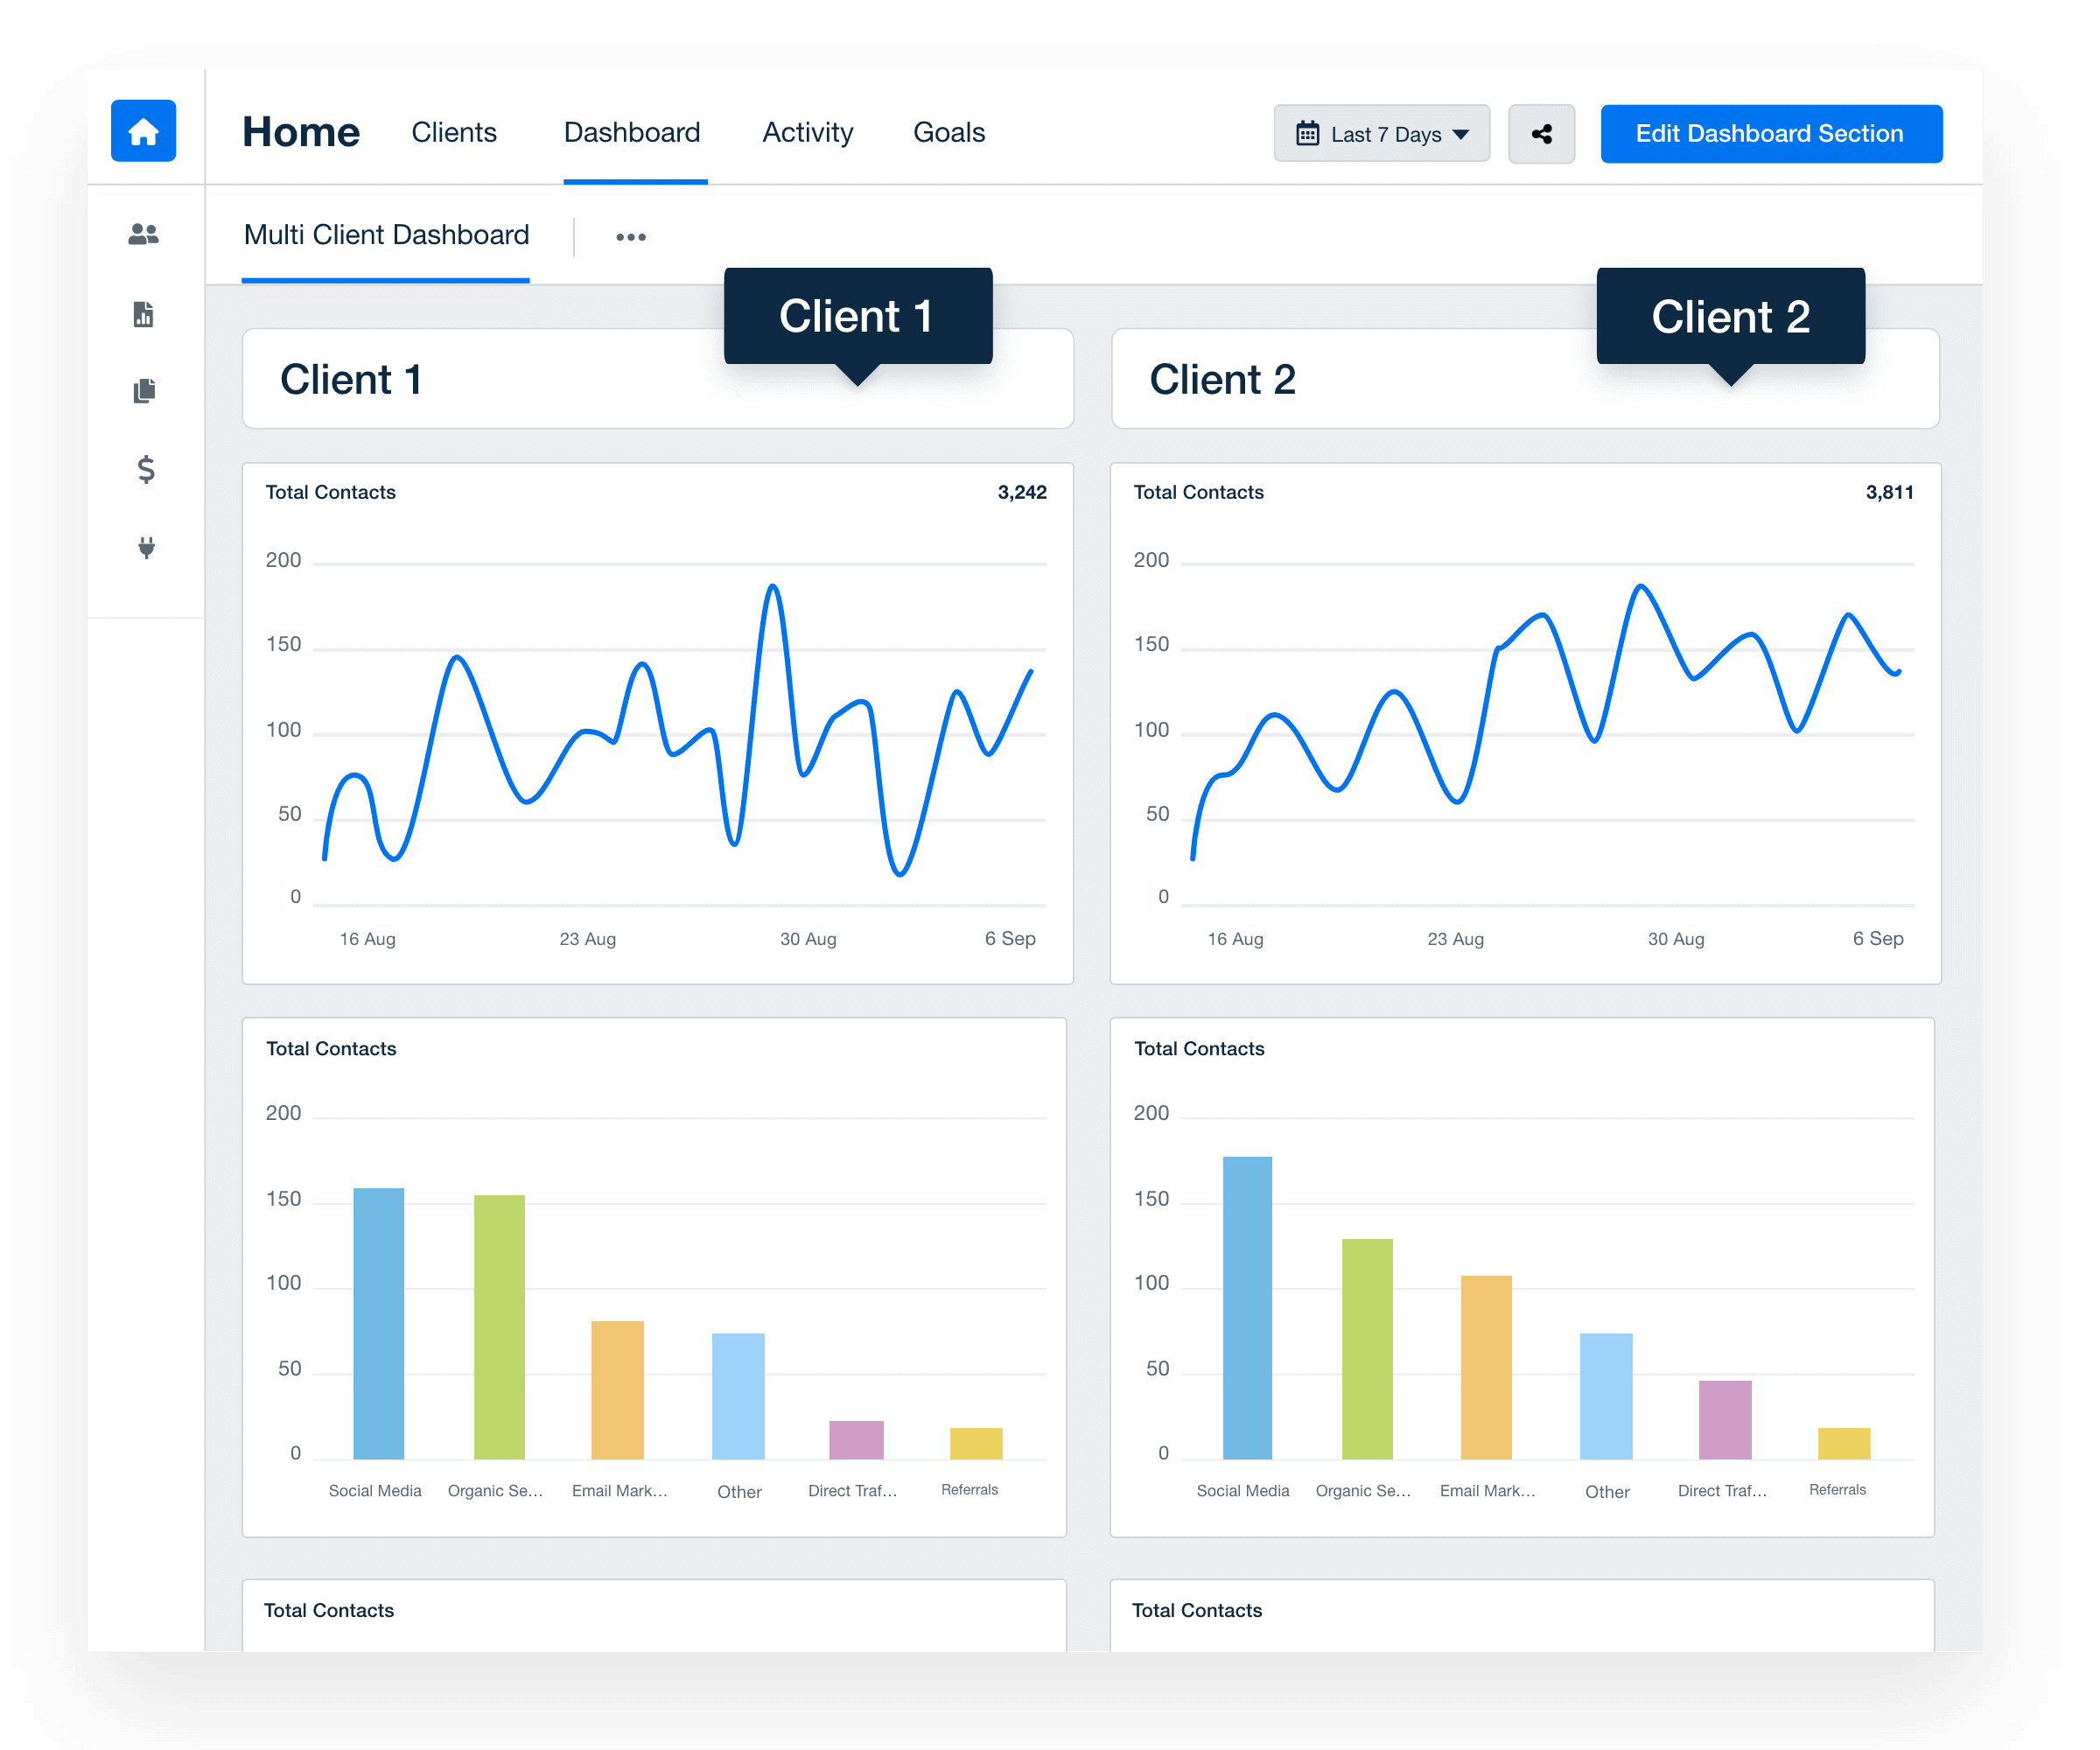
A Marketing Agency Dashboard (also known as a multi-client dashboard) gives agency leaders a centralized view of performance across their entire client portfolio, without having to dig through individual reports or log into separate platforms.
It helps you quickly spot which accounts are thriving, which ones need attention, and where your team’s time will have the biggest impact.
Use it to:
Monitor overall client health and performance trends at a glance.
Identify which accounts are on track to meet their strategic goals and which may be at risk.
Prioritize internal resources by focusing on clients with slipping metrics or strategic gaps.
Spot cross-client trends, benchmark against past trends, and monitor performance across verticals or service lines.
A multi-client dashboard is the perfect strategic dashboard for keeping your leadership team focused on the bigger picture.
Marketing Performance Dashboard
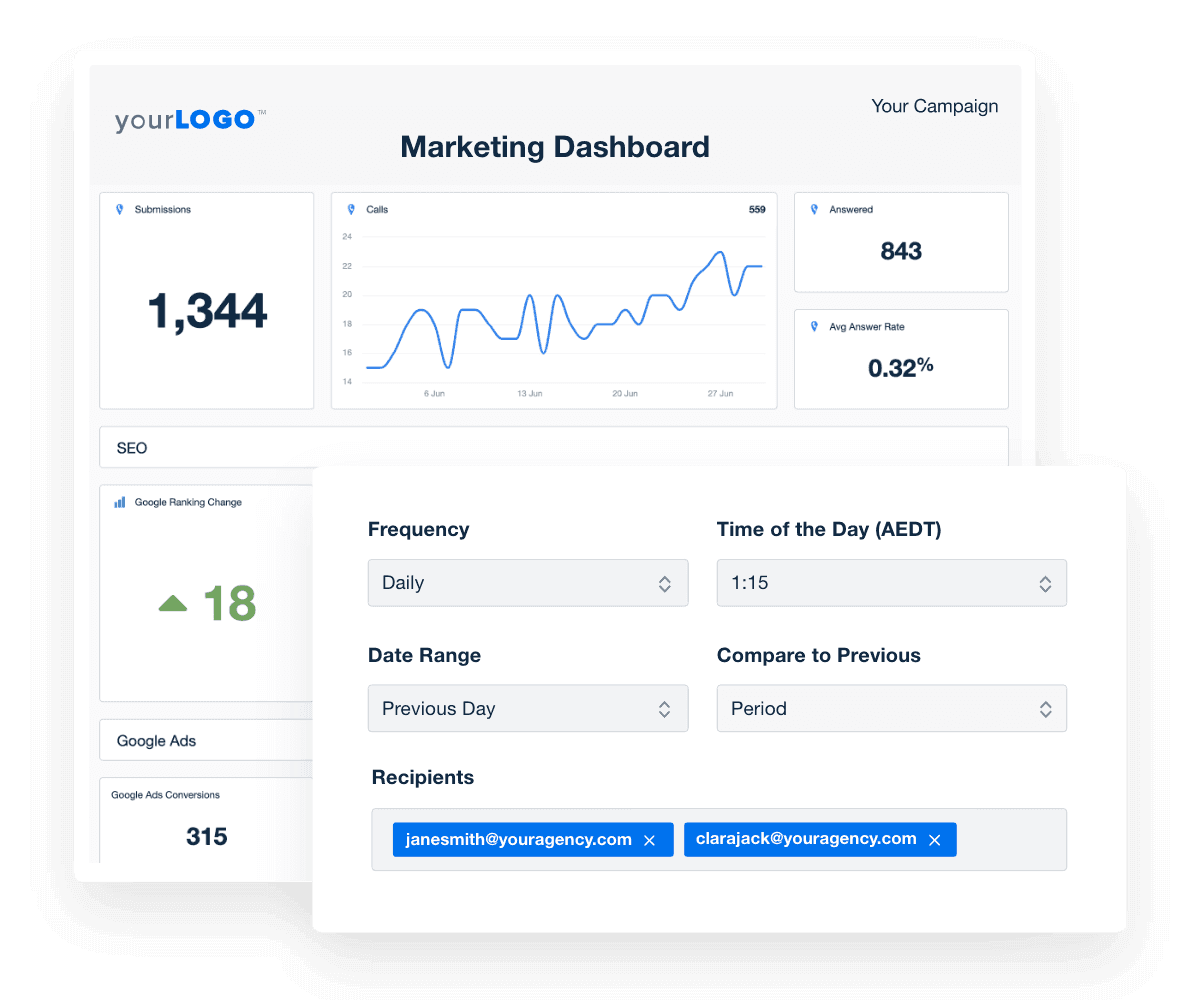
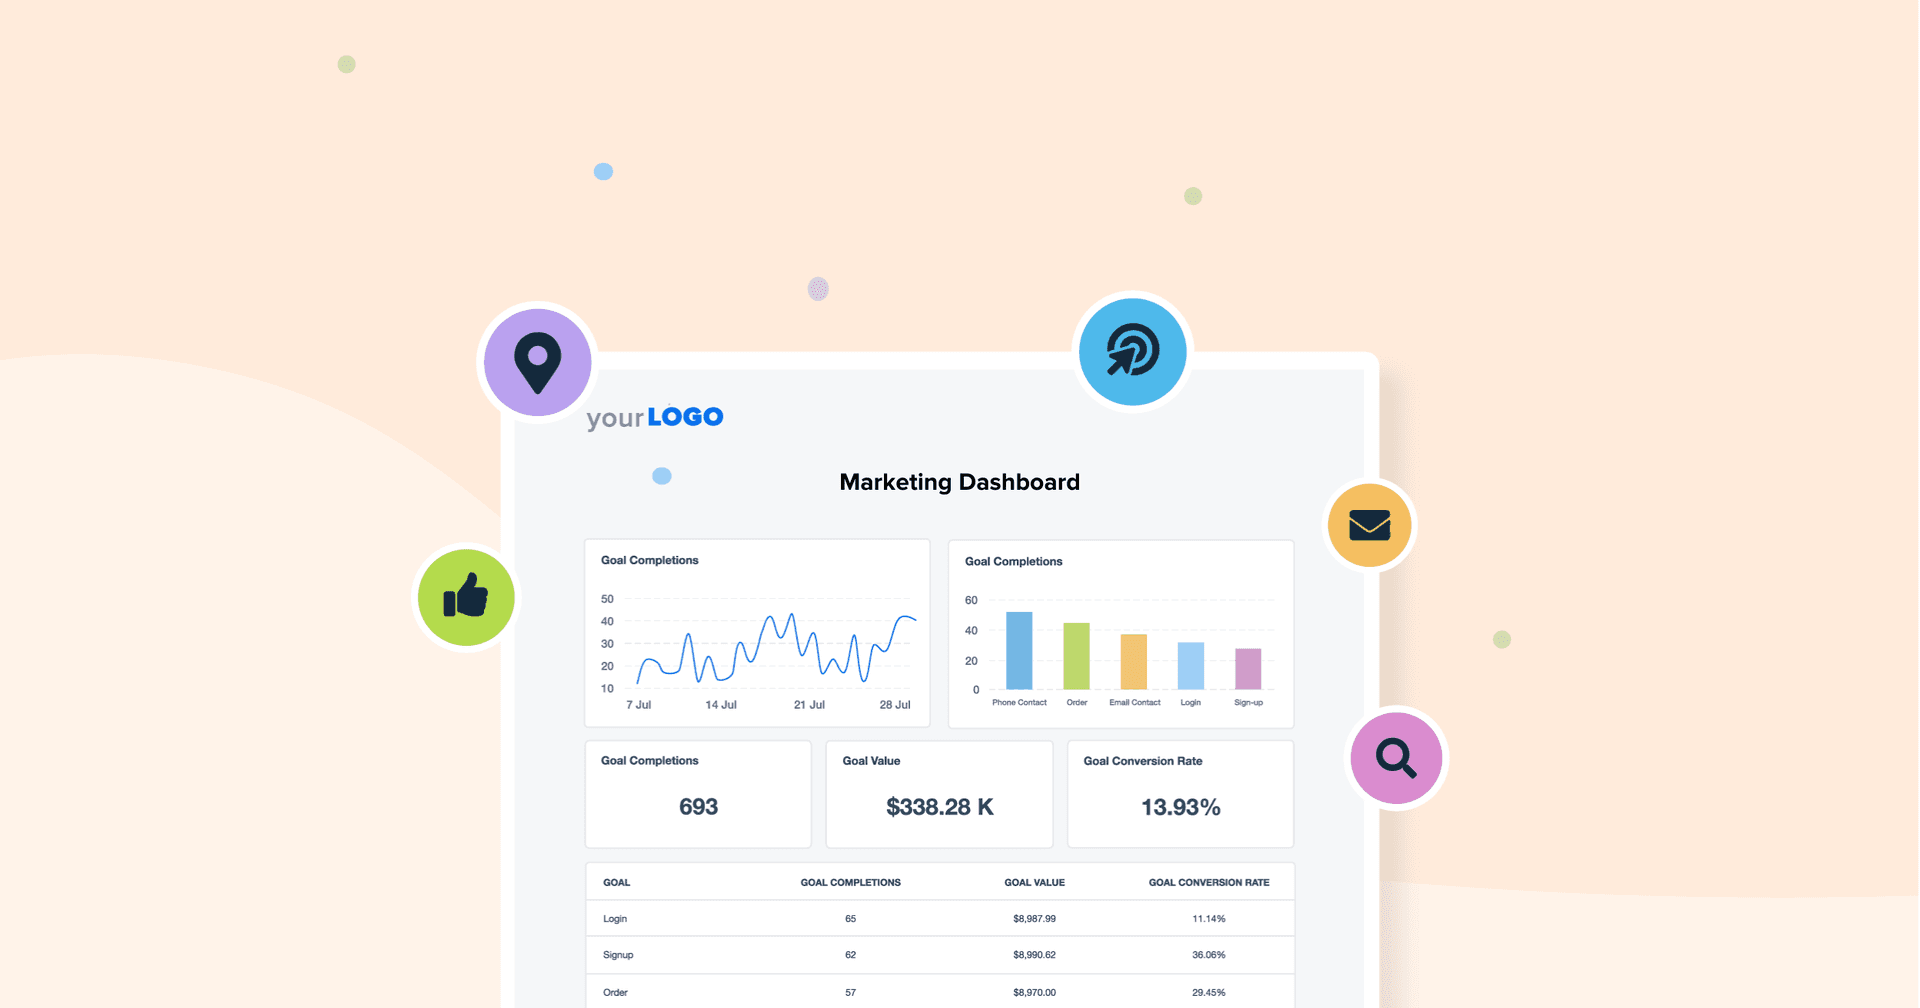
A Marketing Dashboard tracks the effectiveness of all of your marketing efforts, either for clients or for your agency. It pulls data from various sources to provide insights into campaign performance, audience engagement, and conversion metrics. It’s a handy dashboard for demonstrating the ROI of marketing strategies at a glance.
Use it to:
Assess the success of marketing campaigns across different channels.
Identify high-performing strategies and areas needing improvement.
Provide clients with transparent, real-time updates on marketing performance.
A marketing dashboard is perfect for marketing teams that want to stay informed and make timely, data-backed decisions.
Digital Marketing Dashboard
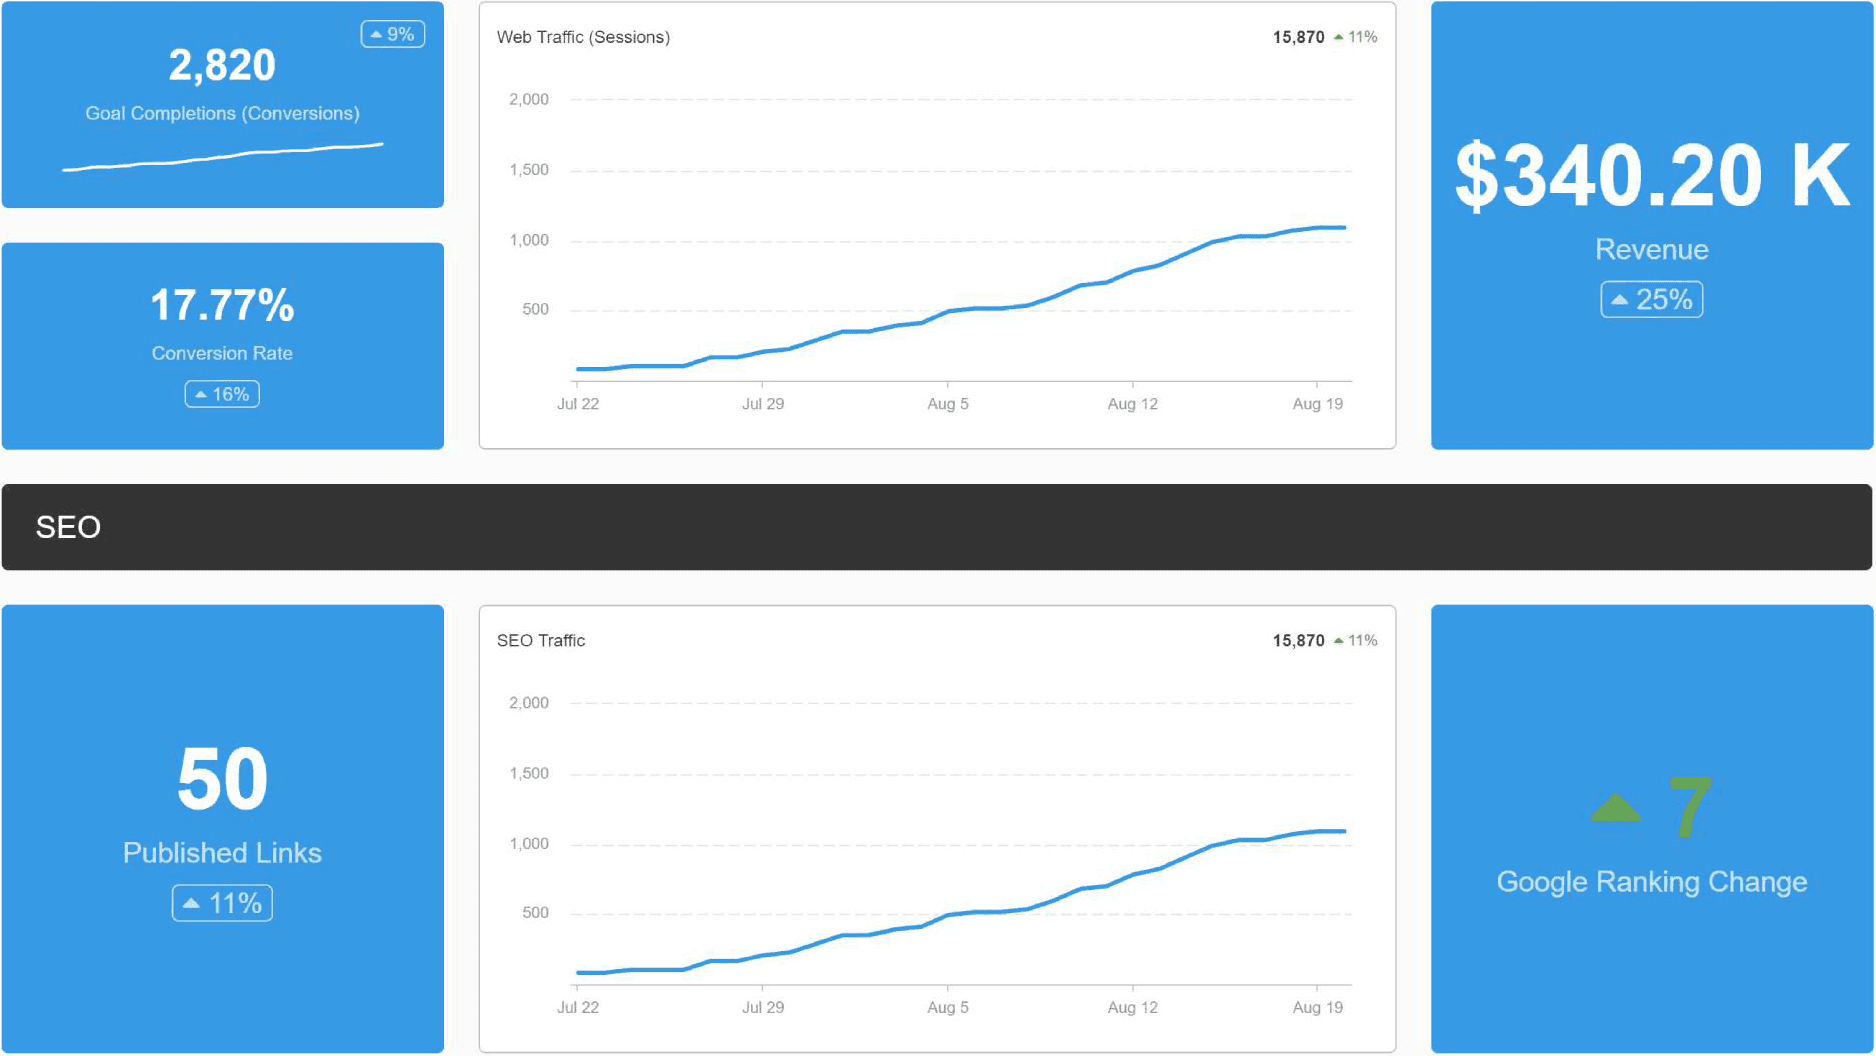
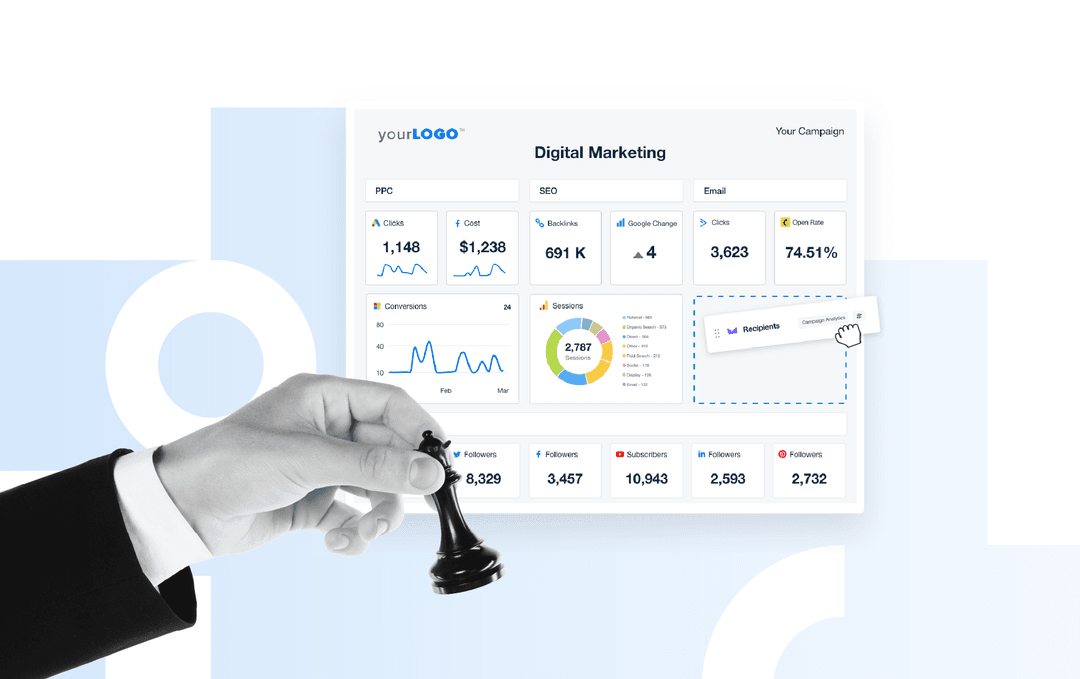
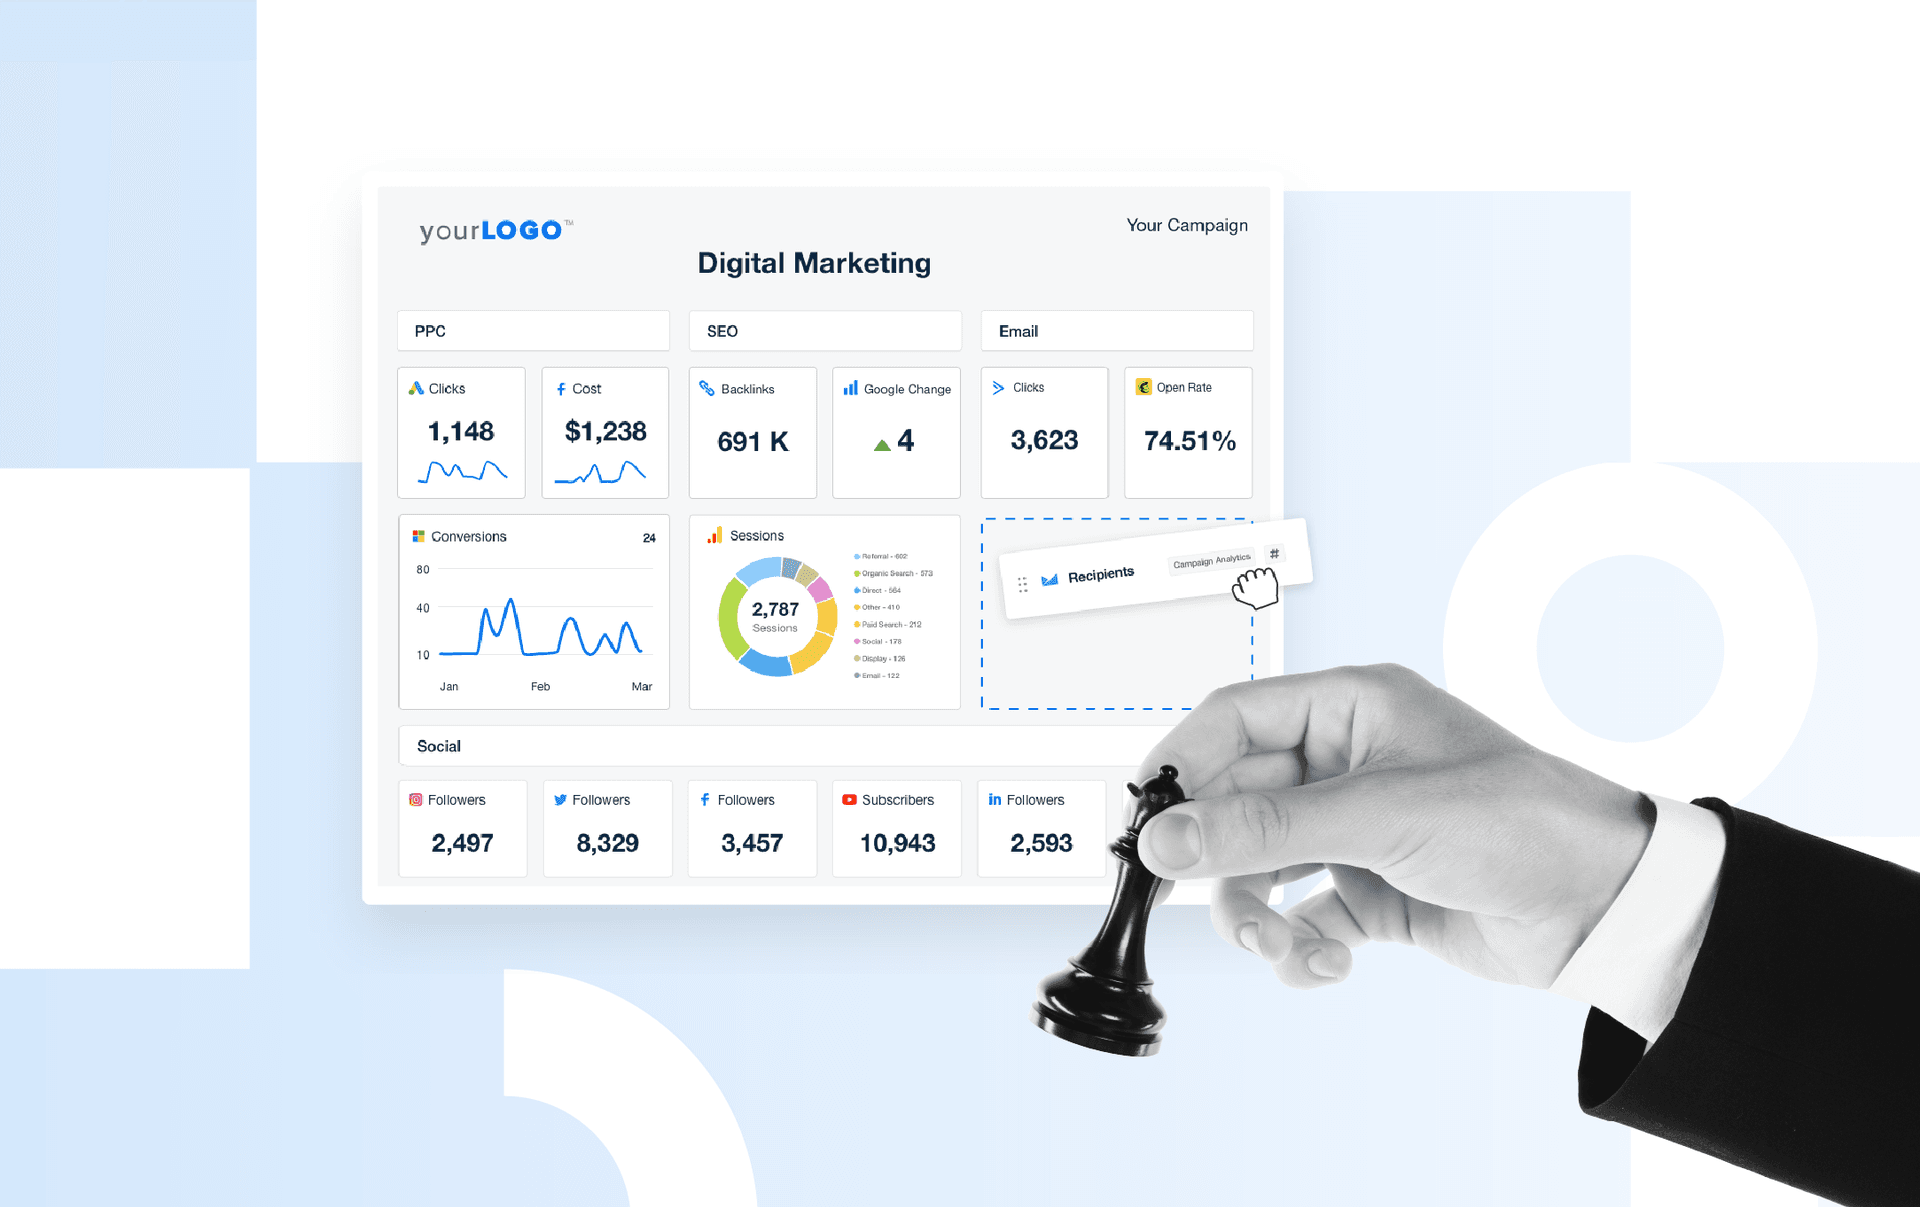
A Digital Marketing Dashboard offers a comprehensive view of your digital marketing efforts. It integrates data from SEO, PPC, email marketing, and social media platforms to help you make a holistic analysis of marketing initiatives.
Use it to:
Track digital marketing KPIs in real-time.
See the impact of various digital channels on overall marketing goals using simple visualizations.
Facilitate data-driven discussions with clients about digital strategy.
When Strategic Dashboards Are Most Useful
Now that we’ve seen some strategic dashboard examples, how do you get the most out of them? These are the real-world agency moments when a strategic dashboard helps you lead with clarity.
For Client Strategy
Strategic dashboards help turn performance metrics into a clear narrative for clients and external stakeholders, translating data into decisions. They’re how you move beyond showing the what to explaining the why, and shaping what happens next.
Use them to:
Anchor Quarterly Reviews and Renewals: Instead of hunting through reports to prove progress, use your dashboard to show clients how SEO, PPC, and email performance are trending and what needs attention next.
Set and Track Growth Targets: Visualize client KPIs like ROAS, conversion rate, or organic traffic against forecasted goals.
Get Quiet Clients Re-Engaged: A well-built dashboard surfaces wins and red flags, giving your team something strategic to bring to the table before the client even asks.
This perspective from an agency owner shows what it looks like in practice::
For existing clients, our tailored dashboards ensure they have full visibility into ROI, making it easy for them to justify continued investment in our services. By aligning our reports with their specific business objectives, we turn data into actionable insights, helping them make smarter marketing decisions.
Shay, CEO/ Owner, SFB Digital Marketing
For Scaling Your Agency
It only makes sense to practice what you preach! As your sales team scales and your service lines evolve, strategic dashboards become essential to monitoring performance and allocating resources effectively.
Use them to:
Monitor Team Capacity: Track hours per client, margin by service, or project timelines to know when to hire or where to cut scope.
Guide New Business Development: See how leads move through the pipeline and which channels drive the most efficient conversions.
Track Agency-Level KPIs: Keep tabs on overall revenue, churn rate, average contract value, and other key metrics that signal business health.
When everyone from interns to executives are on the same page, it’s easier to make informed decisions, spot trends, and make continuous improvements to move your agency forward.
How To Build a Strategic Dashboard
Now that you know when to depend on strategic dashboards, how do you build ones that deliver?
A good strategic dashboard is built with intention, from the goals you want to track to the data sources you use and the way you visualize performance.
Here are some best practices for creating a business dashboard to support client or agency growth effectively:
1. Define Your Strategic Goals
Start with the big picture. Are you trying to increase average client lifetime value, improve lead quality, or boost monthly recurring revenue? Your dashboard should reflect the outcomes that matter most to the agency or your client, not just what’s easy to measure.
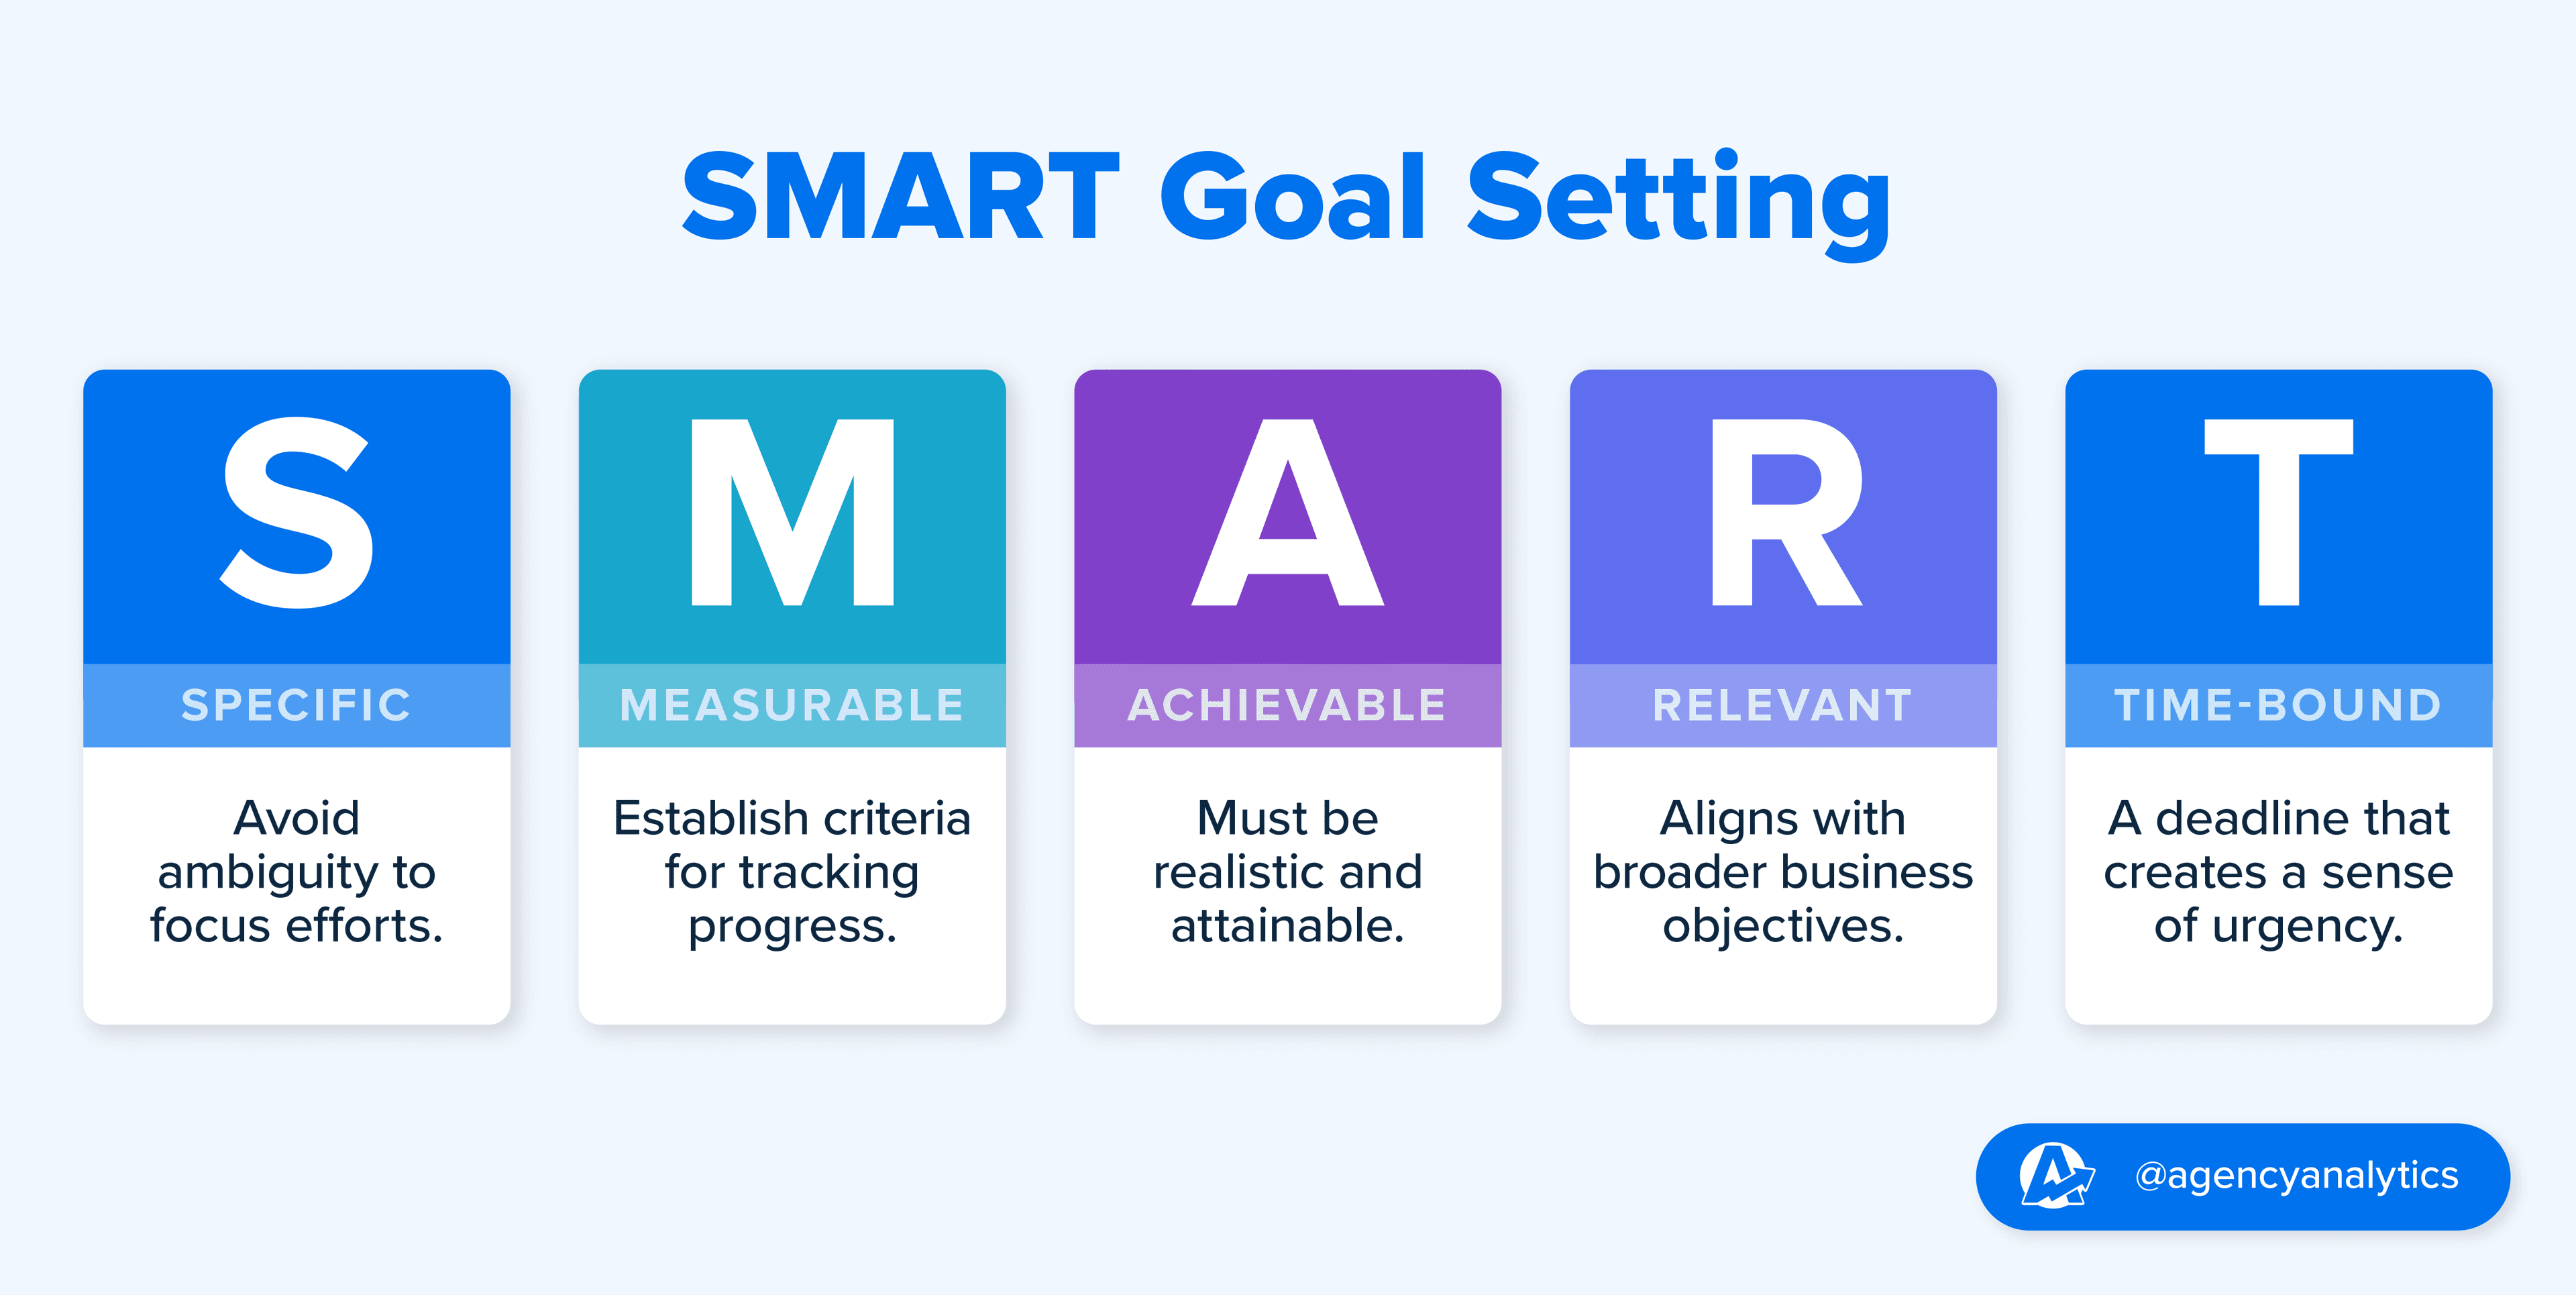
If you’re unclear on those goals, step back before you build. Explore proven goal-setting frameworks like SMART, OKRs, or KPI trees to build trackable and dashboard-ready goals.
For more tips on defining meaningful goals and aligning them with your clients, read up on goal tracking best practices and how to align client-agency goals.
2. Choose the Right KPIs
For each goal, choose a small set of performance metrics that signal real progress. These might include Cost Per Acquisition (CPA), Customer Retention Rate (CRR), conversion value, or average deal size. Prioritize metrics that are actionable and directly tied to business performance.
It’s a tactic that’s already working well for agencies focused on clarity and client results:
We create tailored dashboards that highlight KPIs specific to client goals, ensuring they only see the data that matters most.
Shay, CEO/ Owner, SFB Digital Marketing
If a platform integration doesn’t offer exactly what you need, you can always set up custom metrics to calculate and display the KPIs that matter most to your client’s strategy.
3. Map Metrics to Data Sources
Once you’ve defined your goals and metrics, work backwards. Where do these metrics live?
Start by listing out your KPIs, then map each one to its data source. That might mean connecting platforms like GA4, Google Ads, HubSpot, Facebook Ads, or your client’s CRM. If a goal involves revenue attribution, you’ll likely need to blend multiple sources to get the full picture. Don’t overlook internal metrics either. Pull insights from sales dashboards and ops tools to understand how your agency’s internal performance contributes to broader strategic goals.
Agency Tip: Agencies running into bottlenecks here often benefit from centralizing their reporting stack. Using a tool like AgencyAnalytics that syncs data across sources (and alerts you when something breaks) will save hours down the line and protect the credibility of your dashboards.
4. Use Data Visualizations
A dashboard lives or dies by its visual clarity. The best dashboards reduce the noise and support fast, informed action with data visualizations.
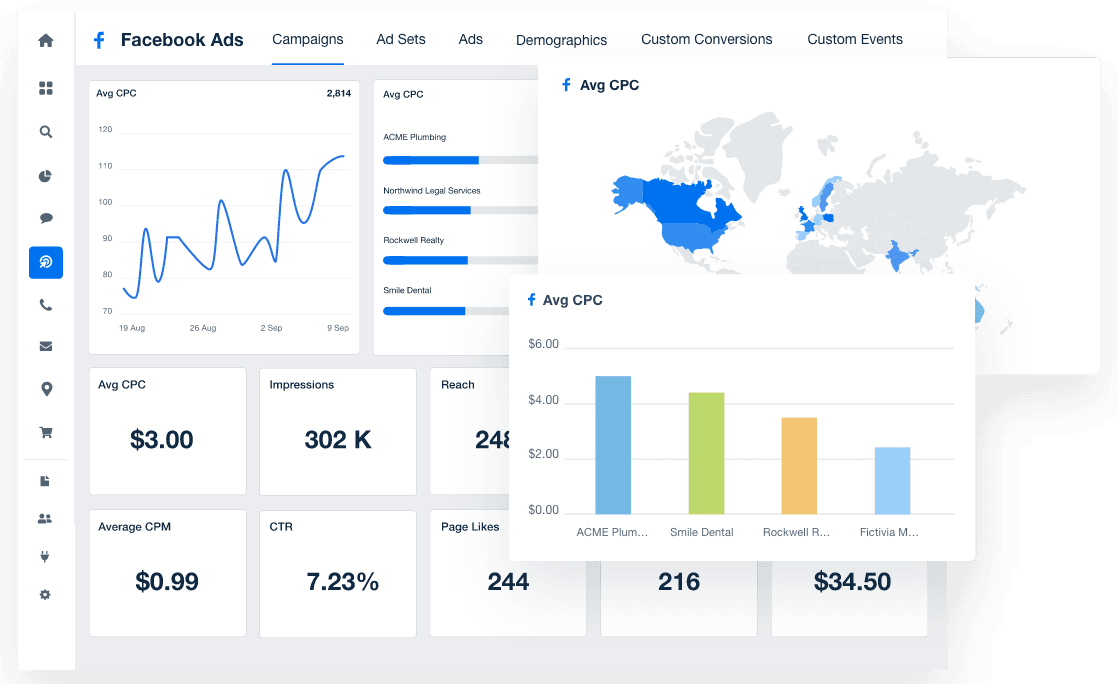
Here’s a quick guide to choosing the right visual based on the story you need to tell:
Line Charts: Best for showing changes over time, like traffic trends, conversion rates, or ROAS. Use them to highlight growth, seasonality, or dips that need investigation.
Bar Charts: Great for comparing performance across categories such as campaigns, landing pages, or traffic sources. Stick with horizontal bars for longer labels and better readability.
Scorecards/KPI Blocks: Ideal for spotlighting key metrics that need monitoring at a glance, like Cost Per Lead (CPL), total revenue, or churn rate.
Pie Charts: Use sparingly. They’re best reserved for simple share-of-total metrics (like device usage or channel breakdowns) and only when the number of segments is small and easy to compare.
Even when you’re working with complex data, the right visualization turns it into something clear, compelling, and instantly actionable for your team and your clients.
5. Add Context
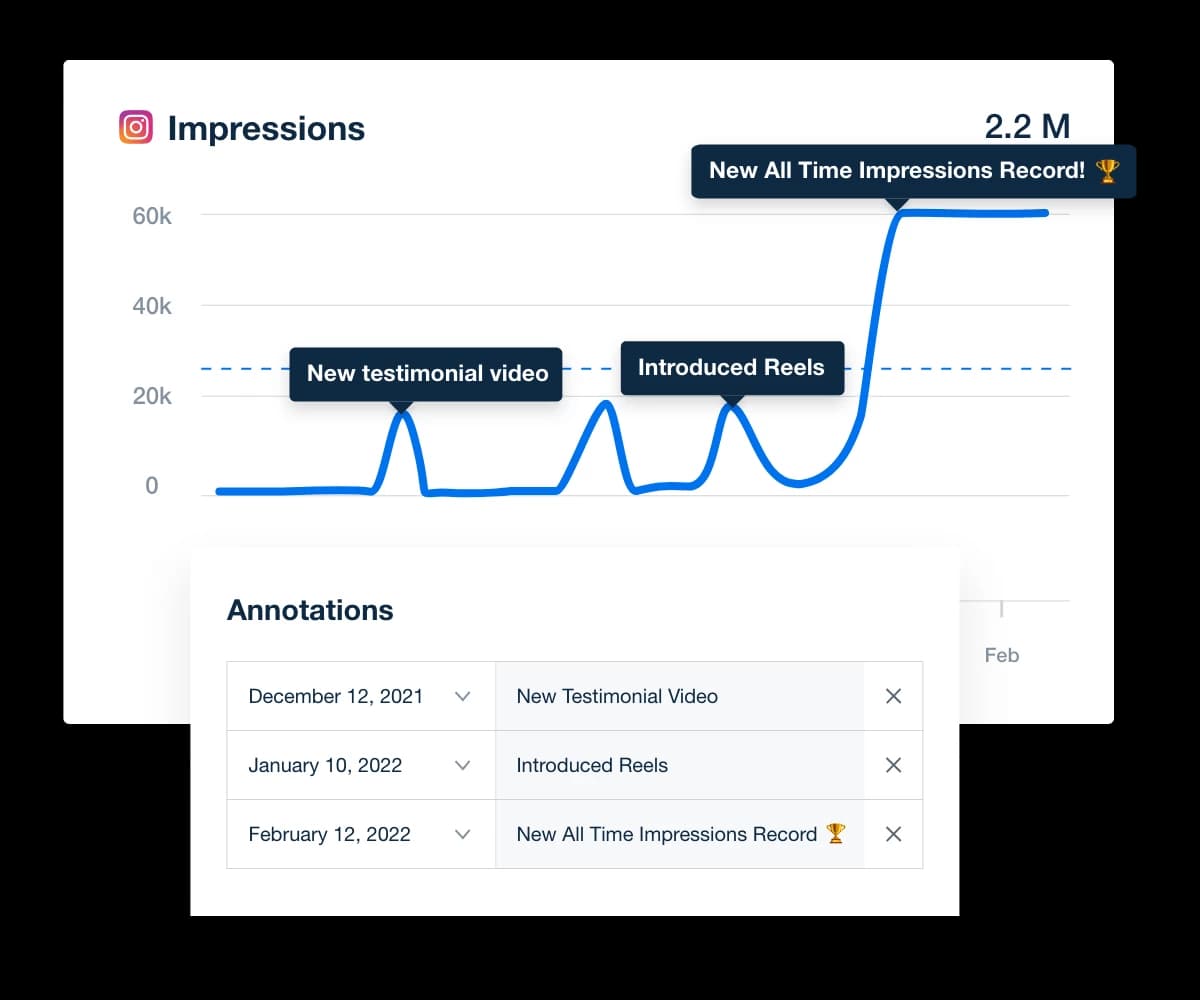
Context is what makes a dashboard actionable. Use annotations to highlight spikes, dips, anomalies, or changes in strategy. If conversion rates dropped, note that the landing page A/B test launched last week. If ROAS is up, call out the new audience segment added mid-month.
Benchmarks are another way to give clients something to measure against. Use past performance or historical data ("in the prior year"), industry standards, or campaign goals as context. It turns raw data into insight and gives clients a sense of progress beyond this week’s numbers.
Context differentiates between a dashboard design that sits untouched and one that drives smarter decisions.
6. Automate Updates and Alerts
Dashboards lose their edge the minute they go stale. Strategic reporting should always reflect what's happening now, not last week.
Automate your data feeds across platforms like Google Ads, GA4, and your CRM to ensure your dashboards always reflect the latest metrics. This reduces manual errors and frees up your team to focus on interpretation, not data collection.
Set performance alerts for the metrics that matter most, like a drop in conversions, a spike in CPL, or budget overspend. You should know when a metric crosses a threshold before your client does.
Automation helps you maintain accuracy and access while minimizing the need to check past months' data or chase broken connections manually. When updates are automatic and insights surface in real time, your dashboard shifts from “reporting tool” to “decision radar.”
7. Ask for Client Feedback
Don’t assume your dashboard is hitting the mark for clients.
A simple “What do you want to see more of?” or “Is this helping you make better decisions?” goes a long way. Clients won’t always volunteer this feedback, but it’s the difference between a dashboard they use and one they ignore.
If they skip sections or ask the same follow-up questions each month, the dashboard is missing something. Fixing that builds trust and keeps your agency aligned with its strategic priorities.
Add a dashboard feedback question to your next monthly check-in. You’ll learn exactly where to double down and what to trim.
One agency leader captures the importance of client feedback perfectly:
Don’t sleep on client feedback. Ask, “Is this hitting the mark? What do you need to see?” Nothing’s worse than pouring effort into a dashboard that just gets trashed every week.
Ryon Gross, CEO, Local Leap Marketing
Build Strategic Dashboards With AgencyAnalytics
Strategic dashboards fall short when they’re pieced together with spreadsheets, disconnected tools, or clunky platforms not built for how agencies actually work. That kind of setup slows down decision making, creates extra work, and leaves critical insights buried in complexity.
AgencyAnalytics solves that with a platform designed specifically for marketing agencies. With over 80 integrations, this strategic dashboard software automatically pulls performance data across your clients, channels, and campaigns.
When you build a strategic planning dashboard with AgencyAnalytics, you:
Connect strategic goals to performance metrics using real-time data from tools like Google Ads, GA4, Facebook, and CRMs.
Forecast trends and monitor anomalies with built-in goal tracking, benchmarks, and metric alerts.
Visualize data clearly with customizable dashboards, filters, and annotations that bring context to every chart.
Collaborate across teams and clients by adding notes, automating updates, and tailoring views by stakeholder.
Create white labeled dashboards that reflect your client’s brand and reinforce your agency’s value.
Whether you're scaling your agency or deepening client relationships, AgencyAnalytics helps you build dashboards that show where things stand, where they’re going, and what needs to happen next.
Ryon Gross from Local Leap Marketing shares how branded dashboards elevate client perception and reinforce agency value:
Branded dashboards have a big payoff. With AgencyAnalytics, you can slap your logo on, match the colors to your vibe, and even use a custom domain in a few clicks. It’s not just a report anymore, it’s a polished piece of your work that screams professionalism. Our clients notice it every week, and it reinforces that we’re always working for our clients, not just some faceless service.
Ryon Gross, CEO, Local Leap Marketing
Final Thoughts
A strategic dashboard doesn’t just display information. It sharpens focus, eliminates guesswork, and keeps everyone on the same page.
Whether you’re reviewing past performance or planning what’s next, a well-built dashboard helps your agency stay proactive rather than reactive. With AgencyAnalytics, setting one up is simple. Connect your data, define your KPIs, and let the dashboard highlight what matters most.

Written by
Sylva is an expert content writer with over 10 years of experience in tech and SaaS, offering first-hand insight into agency needs from her background in advertising.
Read more posts by Sylva SivzattianSee how 7,000+ marketing agencies help clients win
Free 14-day trial. No credit card required.


