Table of Contents
QUICK SUMMARY:
Data visualization tools turn complex marketing metrics into intuitive, actionable visuals, helping marketers and clients quickly identify trends and measure campaign performance. This guide outlines seven top dashboard tools for creating customized, interactive reports that integrate seamlessly with platforms like Google Analytics and Facebook Ads.
Marketing data can easily overwhelm clients—and even seasoned marketers aren’t immune to the challenge. In a sea of acronyms with endless data points, it’s easy to get lost without some visuals to light the way.
Consider this scenario:
You’ve spent countless hours creating a detailed marketing report filled with stats like impressions, CTR, and ROAS, only to see your client’s eyes glaze over. Womp womp.
When data isn’t easy to understand, it’s hard to make informed decisions, and all of your agency’s hard work risks being undervalued.
Data visualization tools solve this problem.
They turn raw metrics into clear, engaging visuals that highlight what’s working and what isn’t. For clients, it means seeing campaign results in a way they easily understand, helping them make smarter business choices. For marketers, these tools uncover trends and insights faster, making it easier to act on the data and drive better results.
The challenge? There are countless dashboard tools out there, and finding the right one takes time most marketers don’t have.
That’s why we’ve put together this list of the seven best data visualization tools. Whether you need customizable dashboards, integrations, or an intuitive design, these options will help you make your data more meaningful—for you and your clients.
Let’s dive in!
What Are Data Visualization Tools?
Data visualization tools for agencies are advanced platforms designed to transform complex datasets into clear, actionable visuals. These tools help marketers make sense of intricate metrics by presenting them in formats that are easy to interpret. In addition to simplifying data, they allow users to engage in data exploration, identify patterns, and communicate insights more effectively—whether for internal strategy or client presentations.
One of the standout features of today’s marketing agency tools is their ability to create interactive visualizations, letting users explore data in detail with filters and drill down specific options. These tools often connect with multiple data sources like CRMs like HubSpot, ad platforms like Facebook Ads, and web performance tools like Google Analytics, bringing all your metrics into one clear view.
Popular visualizations include bar charts to compare categories, pie charts to show proportions and interactive charts for quick customization. These features make it easier to make informed decisions and craft stronger stories about performance, client ROI, or campaign success.
Here’s a quick breakdown of common visualization types:
Visualization Type | Description |
|---|---|
Bar Charts | Compare different categories or data sets, such as campaign performance metrics. |
Pie Charts | Show proportional data, like budget allocation across channels. |
Interactive Charts | Allow real-time filtering and adjustments to explore trends in greater detail. |
Line Charts of Line Graphs | Display trends over time, such as monthly traffic or revenue growth. |
Heat Maps | Visualize data intensity or frequency, often used for website user behavior or engagement. |
Geographic Maps | Highlight location-based data, such as regional sales or audience distribution. |
Dashboards | Combine various metrics into a single view for comprehensive insights. |
Learn how top agencies scale faster with dashboard reporting software built for marketing teams.
What To Look for in Tools for Data Visualization
Choosing the right data visualization tool can make or break how effectively your agency communicates complex information. A great tool should do more than create charts. It should streamline internal processes, ensure accuracy, and help your team deliver actionable insights.
Marketers need a solution that balances advanced features with accessibility, making it easy to showcase data in visual formats that tell a story.
Below are the key features to consider when selecting a data visualization platform for your agency:
Ease of Use
The best tools simplify data analysis for marketers who need quick results without learning a complicated system. An easy-to-use platform reduces the time spent on training and setup, letting you focus on delivering insights instead of struggling with the tool itself.
Look for features like a drag-and-drop interface, clear navigation, and minimal technical requirements. These ensure that your team will gather data and create visualizations efficiently regardless of their technical background. When tools are simple to use, agencies spend more time strategizing and less time troubleshooting.
Intuitive Interface
A user-friendly interface is important for saving time and minimizing frustration. Tools with intuitive designs guide users through processes like importing data, selecting visualization types, and customizing dashboards.
Whether you’re analyzing detailed data or generating a quick report, an intuitive platform helps you work faster. A well-designed interface ensures all features are accessible and reduces errors, so you can focus on improvements rather than navigation.
Integrations
Your data visualization platform should seamlessly connect with the tools you’re already using. Whether pulling from cloud services, CRMs, or ad platforms, robust integrations save you time by centralizing your data sources. With the ability to import data from multiple platforms, you’ll get a comprehensive view of your performance in one place. This feature is essential for marketers juggling campaigns across various tools like Ahrefs, Salesforce, or WooCommerce.
Customization Options
Every marketer’s needs are different, which makes customization a must. Tools that let you tweak colors, layouts, and data fields allow you to create visualizations that align with your brand and specific goals.
Whether you need unique visual representations for a niche client or want to filter by specific metrics, customizable tools ensure your reports are always relevant. Customization also helps highlight the most important data, making your insights more impactful.
Scalability
As your agency or business grows, your tool needs to keep up. Scalability ensures your platform will handle increasing data volume, new clients, and more complex reporting requirements. Tools with advanced analytics capabilities and flexible licensing plans let you scale without switching platforms. For agencies managing multiple clients, scalability is key to staying efficient while expanding services.
Collaboration Features
Modern teams thrive on collaboration, and your tool should, too. Look for platforms with real-time collaboration options, like shared dashboards or comment features, to streamline workflows. Collaborative tools make it easy to share insights across teams or with clients, keeping everyone aligned. They also reduce back-and-forth communication, ensuring that decisions are made quickly and with clarity.
Having the ability to share access to the live dashboards with clients allows them to dive deeper into the analytics without needing us to dig up specific metrics on their behalf. This has reduced the number of requests/calls we receive from clients throughout the month.
Bryan Lozano, Vice President of Operations, Ad-Apt
Export and Sharing Options
The ability to share your work is as important as creating it. Whether exporting a PDF, sharing a live dashboard, or generating client-ready reports, flexible sharing options are vital. Tools with easy export capabilities allow you to present your data effectively in any format your clients prefer. Sharing insights efficiently ensures transparency and builds trust, especially for agencies delivering regular updates.
Data Accuracy
Accurate data is non-negotiable in marketing. Your platform should have robust validation features to ensure your complex data is correct and up-to-date. Reliable tools also highlight discrepancies, helping you avoid errors in client reporting. Accuracy builds confidence in your analysis and ensures decisions are based on solid information.
AgencyAnalytics has allowed us greater transparency and accurate performance results. Clients can easily understand the positive impact we are having at the click of a button.
Bri Bernard, Director, Studio Blackardt
Price
Finally, consider the tool’s pricing structure in relation to its features. Look for platforms that balance affordability with the capabilities you need, especially if you’re working with multiple clients. Subscription-based pricing is common, so evaluate whether the plan suits your current needs and could scale with your business. Paying for the right features—like integrations, artificial intelligence, and customization—is a worthwhile investment for long-term efficiency and insight.
Best Dashboard Tools for Visualizing Data
When it comes to making sense of marketing data, the best data visualization tools help marketers turn numbers into insights. With options ranging from simple interfaces to advanced business intelligence features, these tools empower agencies to communicate results clearly and effectively.
Below is a list of top tools that provide interactive dashboards, customizable features, and integrations to simplify your workflow.
1. AgencyAnalytics
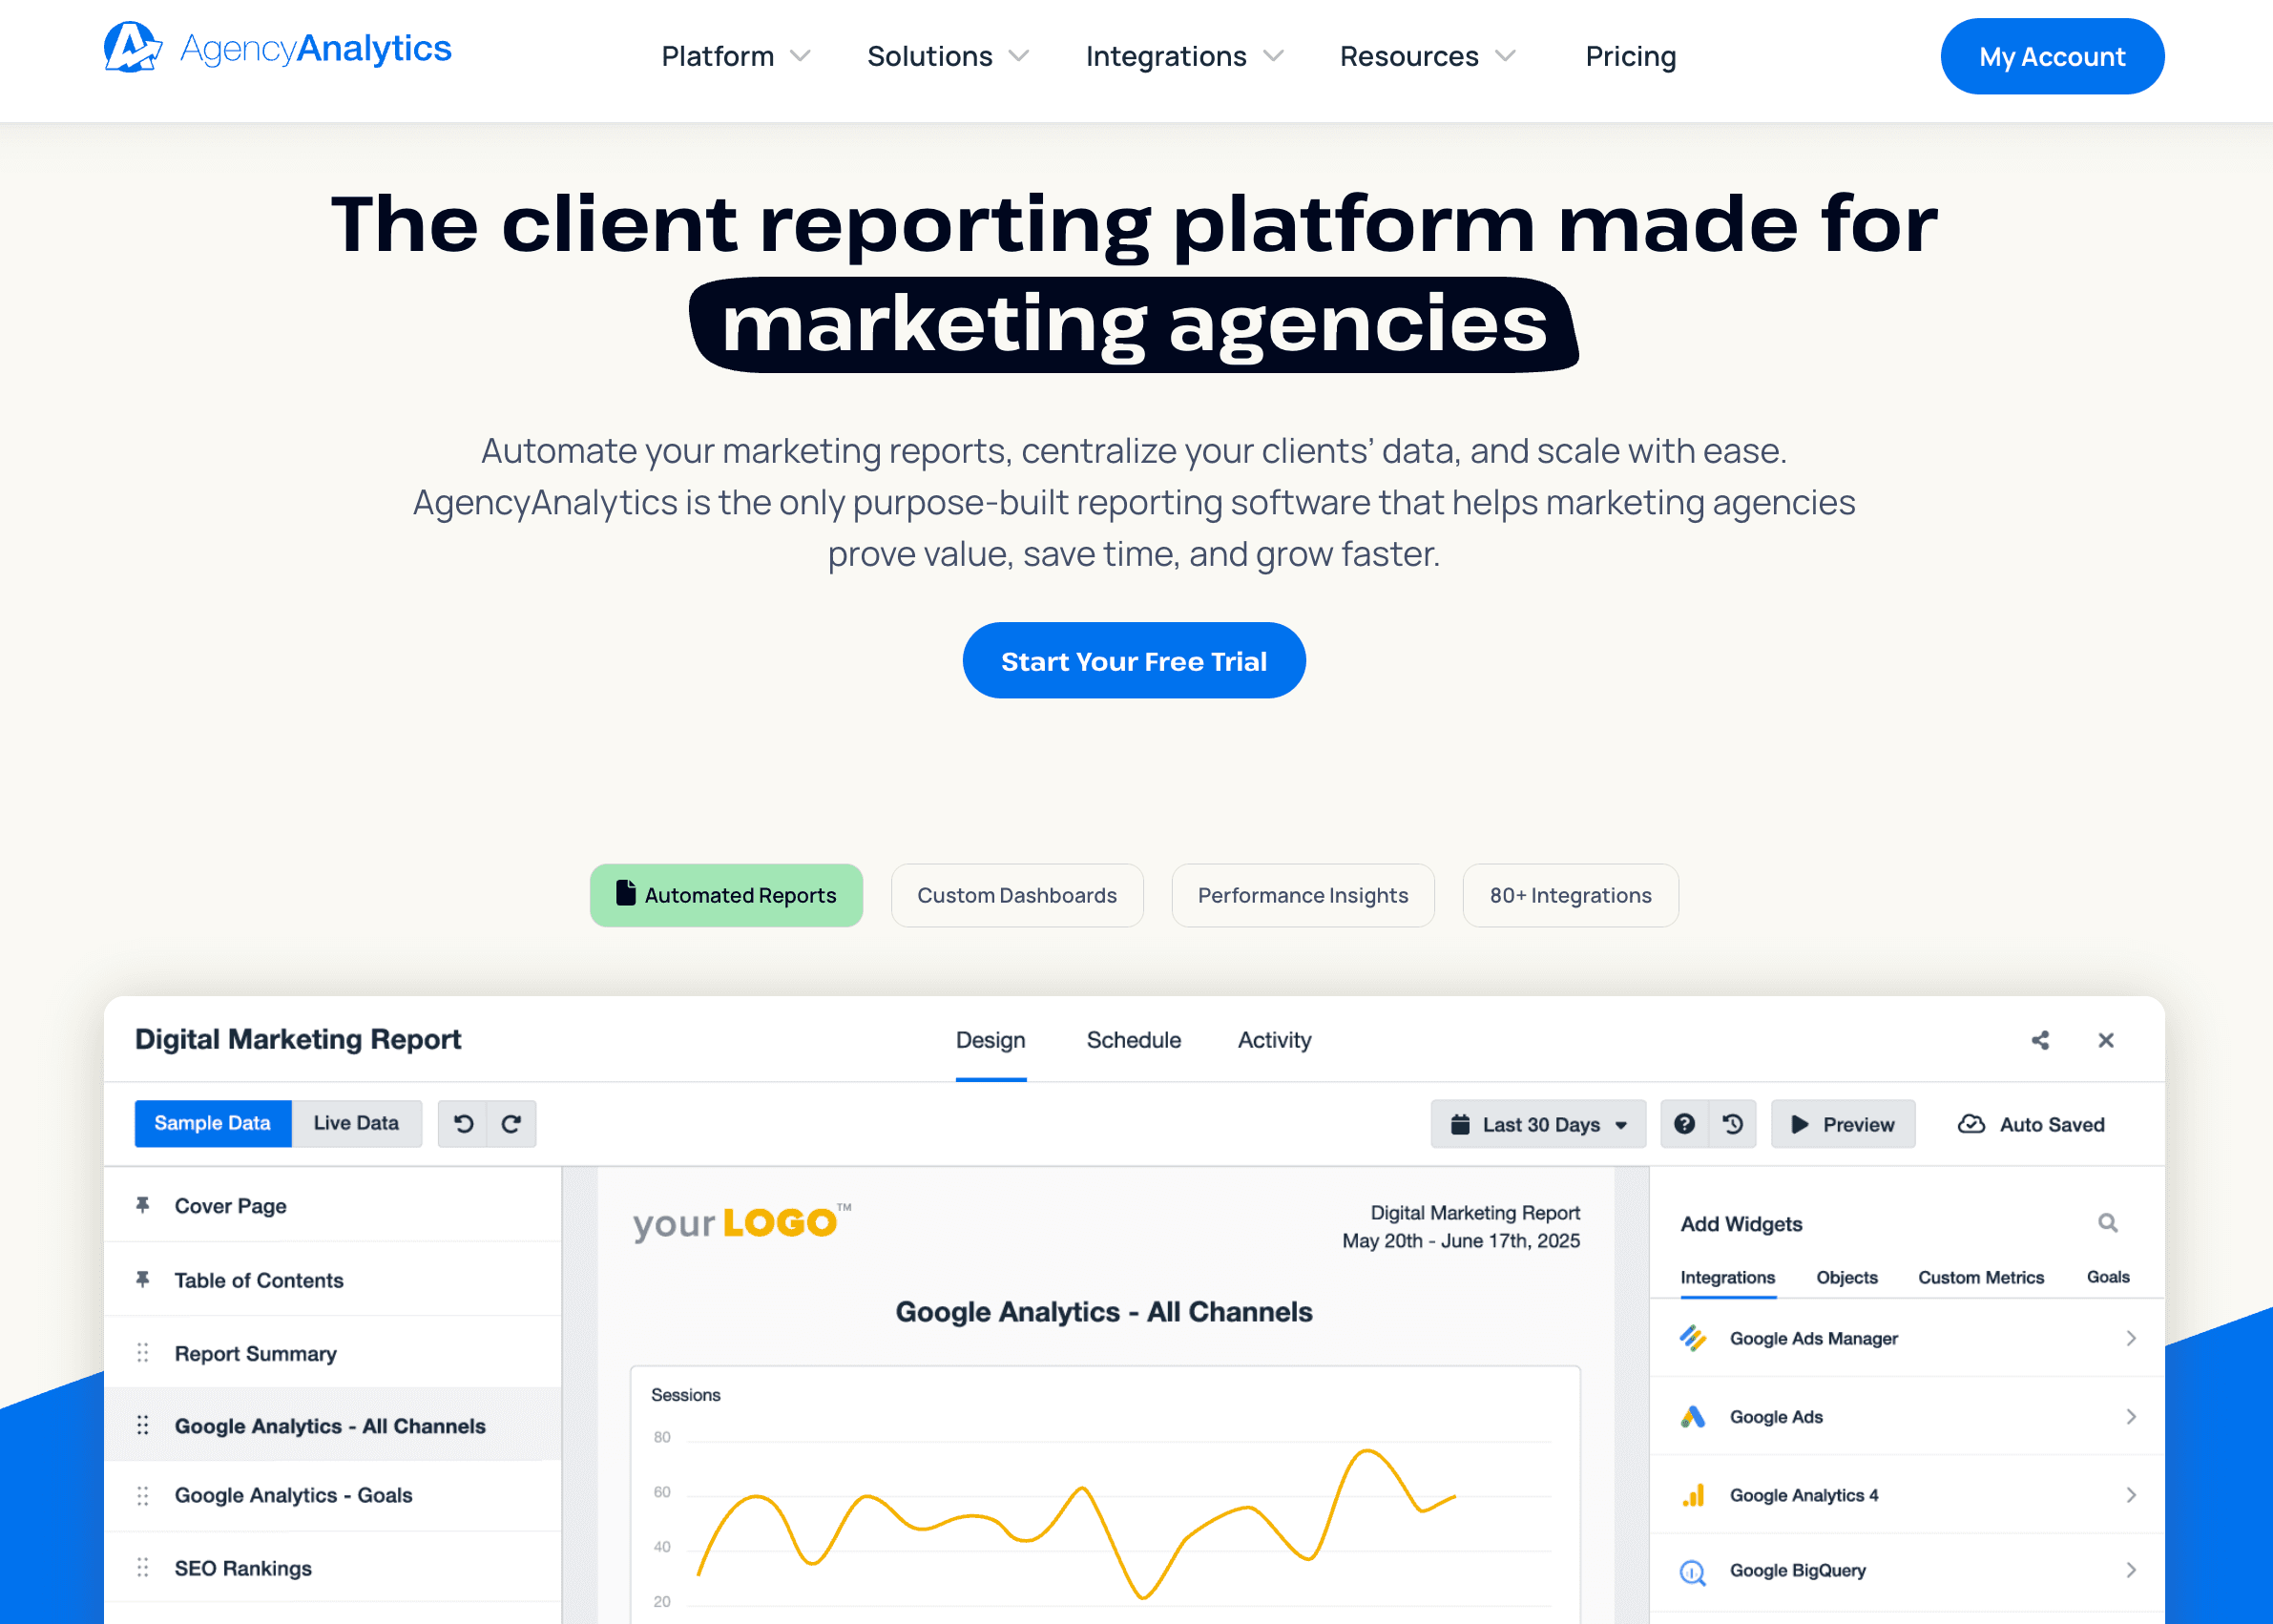
AgencyAnalytics is designed specifically for marketing agencies, making it one of the best data visualization tools for tracking and reporting clients’ marketing performance. This platform centralizes marketing data from various sources, such as ad platforms, SEO tools, and social media, into visually appealing interactive reports. Plus, these reports can be sent out on an automated schedule that marketers quickly approve before clients receive them.
With its user-friendly interface, agencies easily transform data into live dashboards that clients easily understand at a glance, allowing them to remain updated 24/7. Marketers should consider AgencyAnalytics for its focus on simplifying agency workflows with new AI reporting tools, industry benchmarking, forecasting, and automating time-consuming reporting tasks.
Key Features:
White Labeled Dashboards: Customize dashboards with your agency’s branding to maintain a professional image. Clients see their data presented clearly with your name attached.
Automated Reporting: Build reports from a list of marketing report templates and then schedule them to send automatically, saving hours of manual work each week. This feature ensures consistent and timely communication with clients.
Extensive Integrations: Connect with 80+ tools, from Google Ads to a rank tracker, backlink monitor, and Shopify, for a comprehensive view of marketing efforts in one place.
Price: 14-day free trial, then plans starting at $59.
2. Zoho Analytics
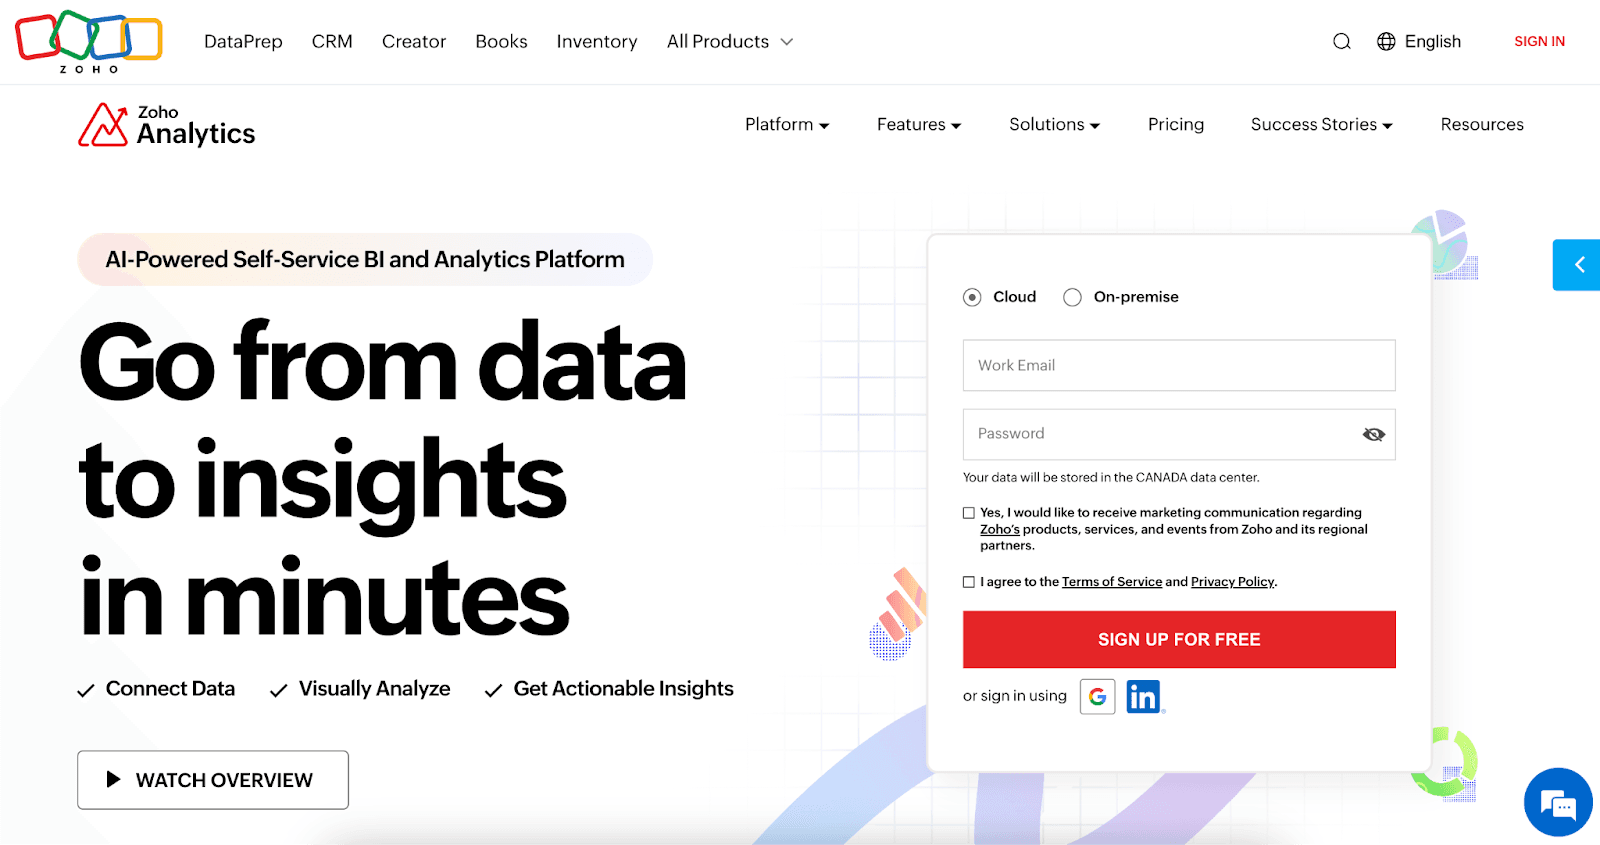
Zoho Analytics is an all-in-one tool that combines robust data analytics with strong data visualization capabilities. It supports a range of chart types and interactive dashboards that let you drill into specifics, such as campaign ROI or audience engagement trends.
With AI-driven insights, Zoho helps marketers identify hidden patterns and make data-driven decisions. Its flexibility makes it a great fit for marketers who need both analysis and visualization in one platform.
Key Features:
Collaboration Tools: Easily share dashboards and reports with team members or clients, ensuring everyone stays aligned on data insights.
Customizable Dashboards: Build dashboards tailored to your client’s metrics, helping agencies present information in the most impactful way. Drag-and-drop tools make customization simple.
Data Integration: Import data from multiple platforms and services, ensuring that all of your client’s marketing metrics are available in one centralized view.
Price: The Basic Plan starts at $30/month billed annually
3. Google Looker Studio
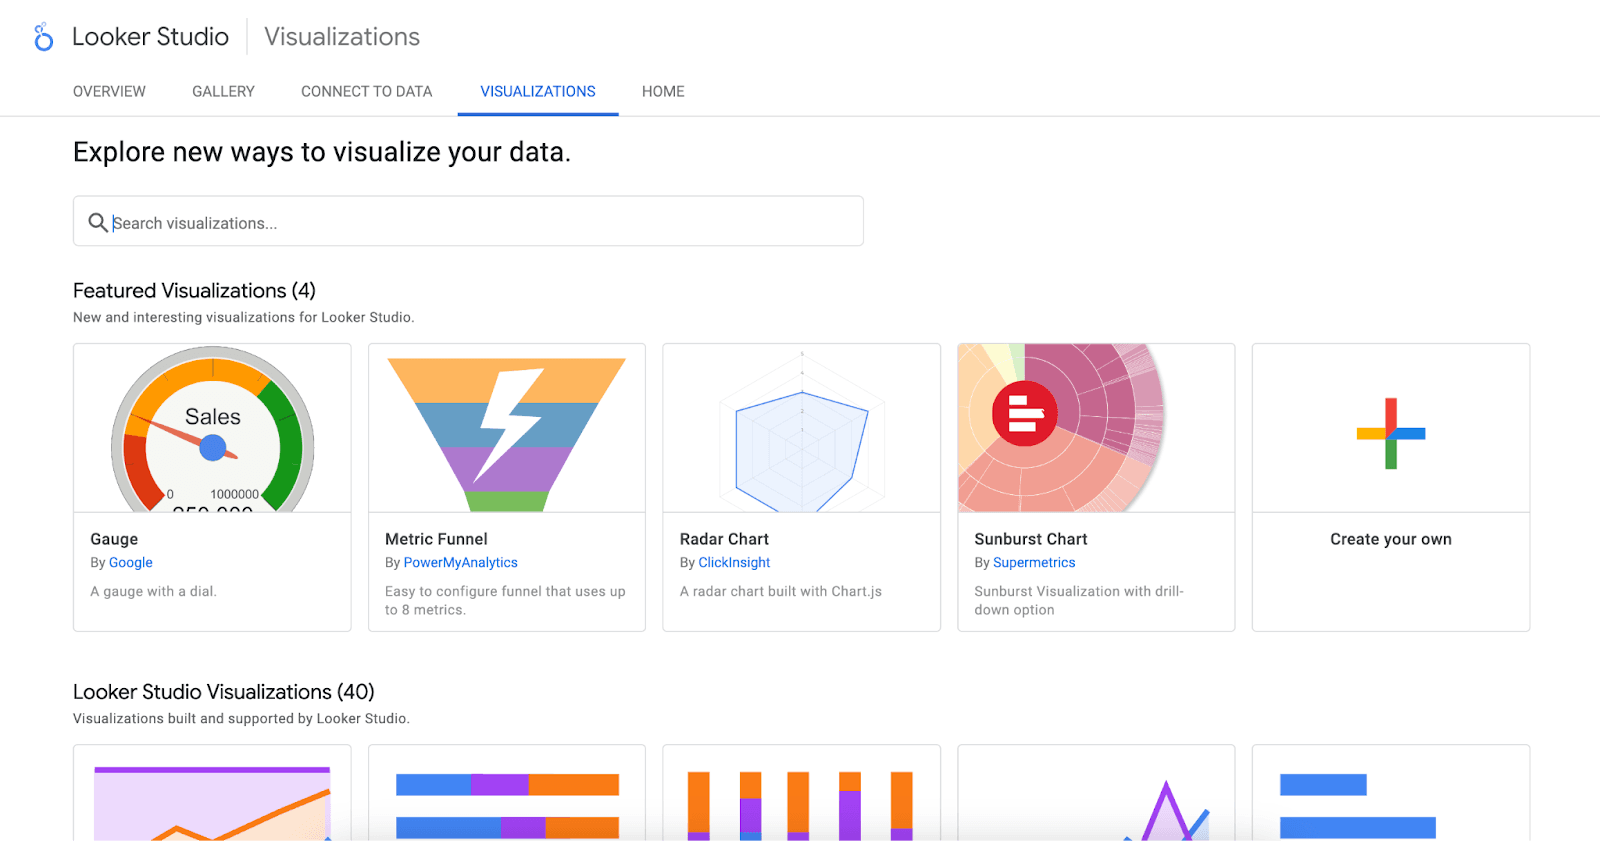
Google Looker Studio is a free tool that provides impressive data visualization capabilities, especially for businesses already using Google’s ecosystem. This platform helps marketers transform data from tools like Google Analytics and Google Ads into sleek, customizable reports.
Its interactive dashboards let users adjust filters and views to explore metrics in real-time, making it a versatile option for marketers of all levels. As a free version, it’s an excellent entry point for those new to reporting tools.
Key Features:
Customizable Templates: Start with pre-made templates and adapt them to your agency’s specific needs. This saves time while still allowing for personalization.
Real-Time Data Updates: Dashboards automatically update as new data comes in, ensuring reports always reflect the latest insights.
Seamless Google Integration: Easily connect to other Google services, such as Analytics and Ads, for a unified view of your agency’s marketing efforts.
Price: Free
4. Microsoft Power BI
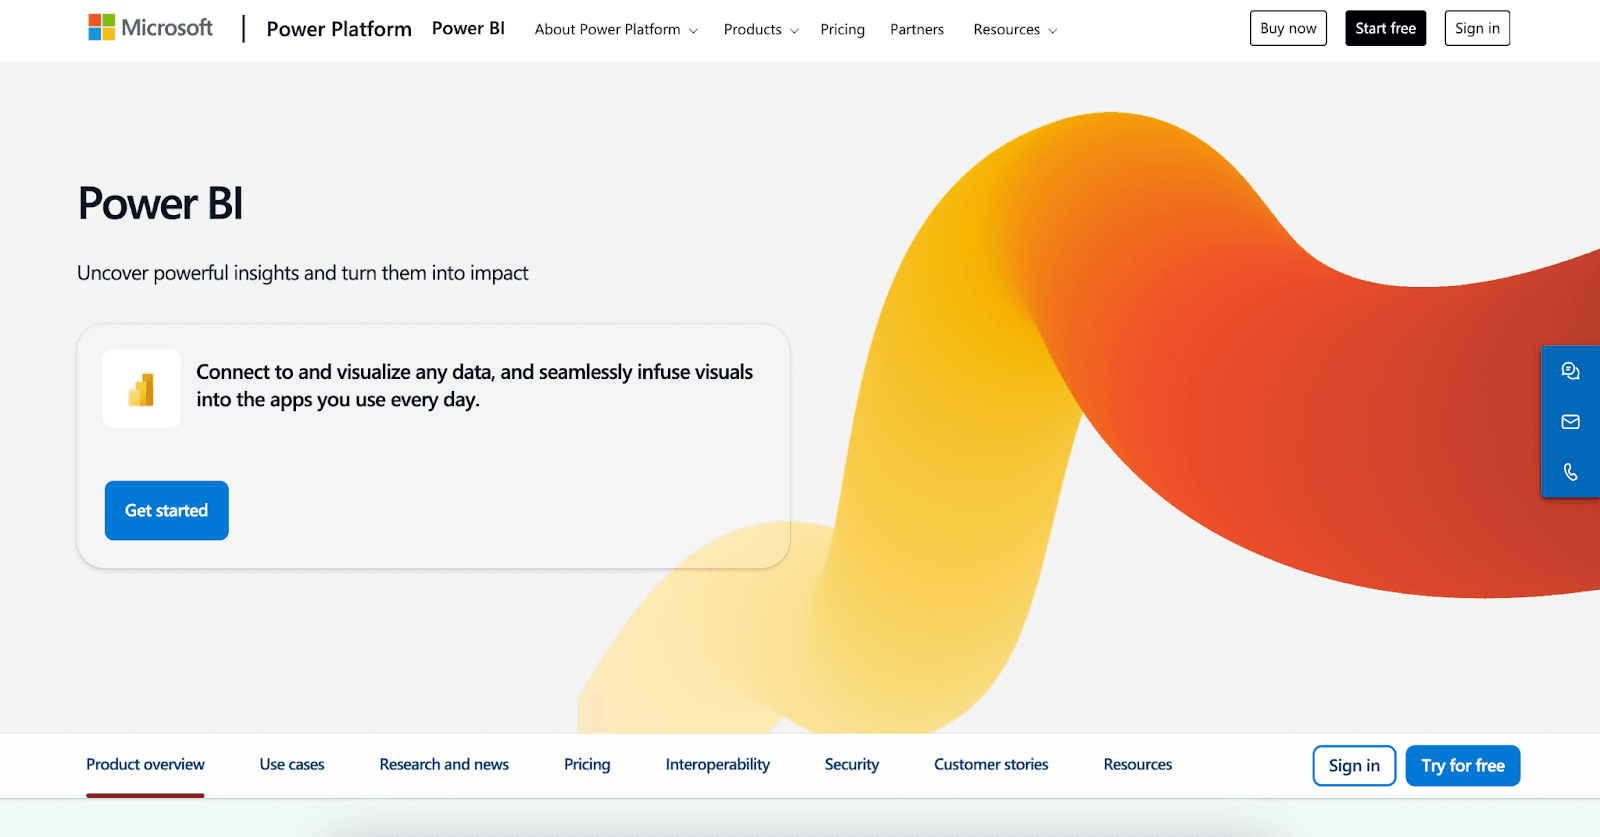
Microsoft Power BI is a leader in business intelligence, offering advanced tools for creating highly detailed interactive reports. Ideal for handling complex data, it supports a wide range of visualizations and robust data modeling capabilities.
Its interactive dashboards provide marketers with real-time insights into campaign performance and customer behavior. Power BI is a good solution for teams needing deep analytical capabilities combined with professional visualizations.
Key Features:
Advanced Data Modeling: This feature allows marketers to handle large datasets and perform in-depth analysis with features like DAX formulas. It also dives into the most intricate details of your client’s campaigns.
Interactive Visualizations: Create charts, graphs, and dashboards that allow users to adjust views dynamically, uncovering deeper insights.
Cloud Services Integration: Store and share data securely through Microsoft’s cloud, making collaboration and access seamless for your team.
Price: Free plan is available, and then the Power BI Pro plan starts at $10/month per user
5. Tableau
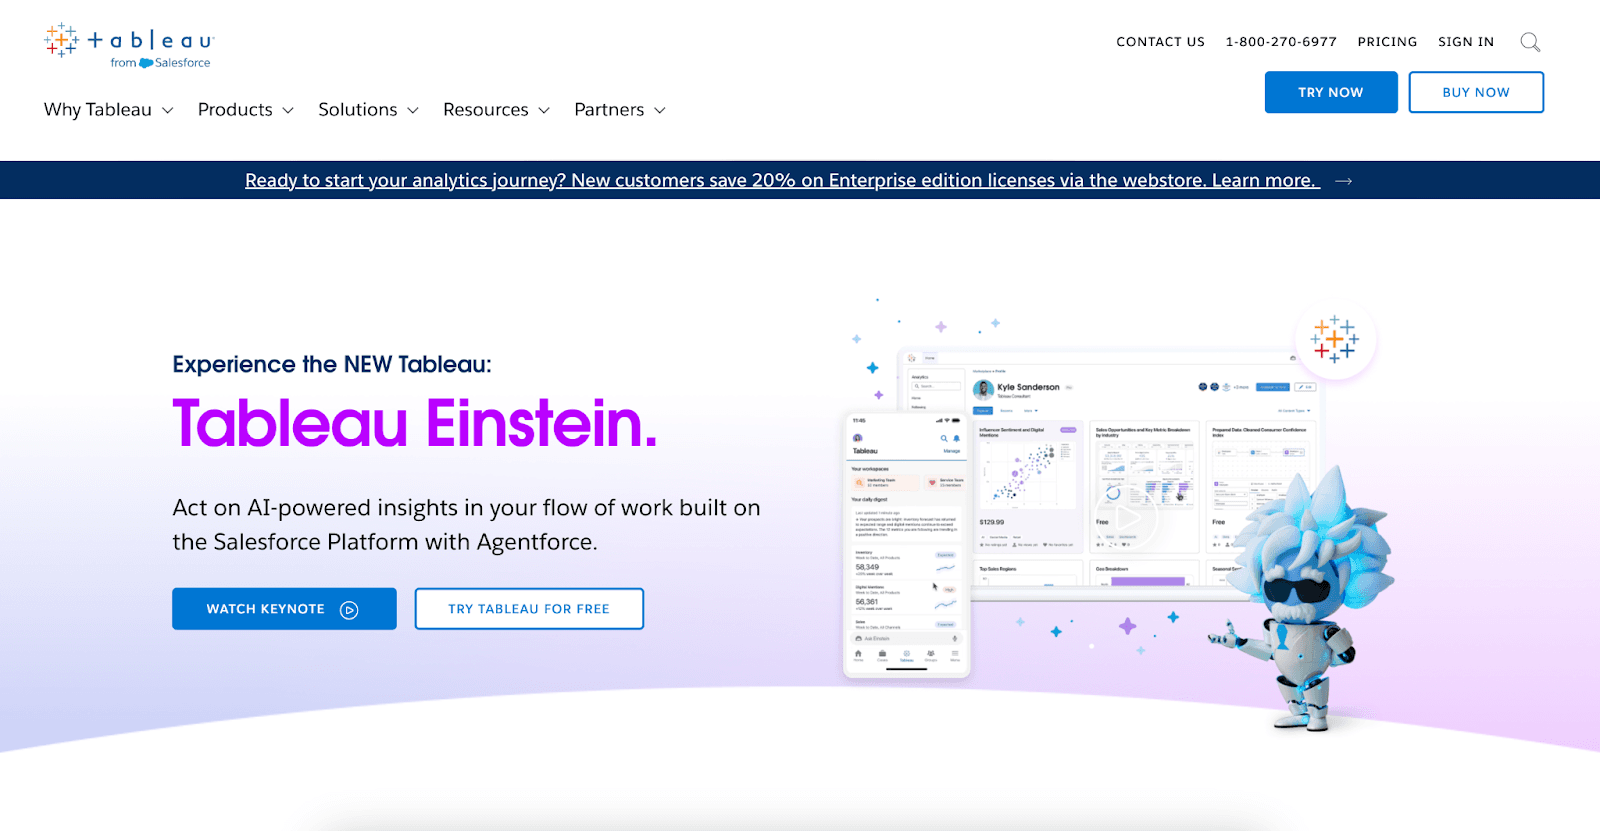
Tableau is a highly flexible tool for creating complex visual representations of data, making it ideal for marketers managing large-scale datasets. Known for its drag-and-drop interface, Tableau helps marketers turn data into live dashboards with deep analytical insights.
It’s particularly useful for exploring marketing data and uncovering trends that might not be immediately visible. While it’s more advanced than some other tools, it’s a great choice for agencies that need detailed analysis and reporting capabilities.
Key Features:
Powerful Analytics Engine: Delivers advanced data exploration and modeling for in-depth analysis of marketing performance.
Interactive Dashboards: Create dynamic views that marketers and customize for greater clarity and insight.
Extensive Integrations: Connect to multiple data sources, ensuring all your client’s marketing data is centralized.
Price: Free plan is available, and then the Viewer Plan starts at $15/month per user
6. Canva
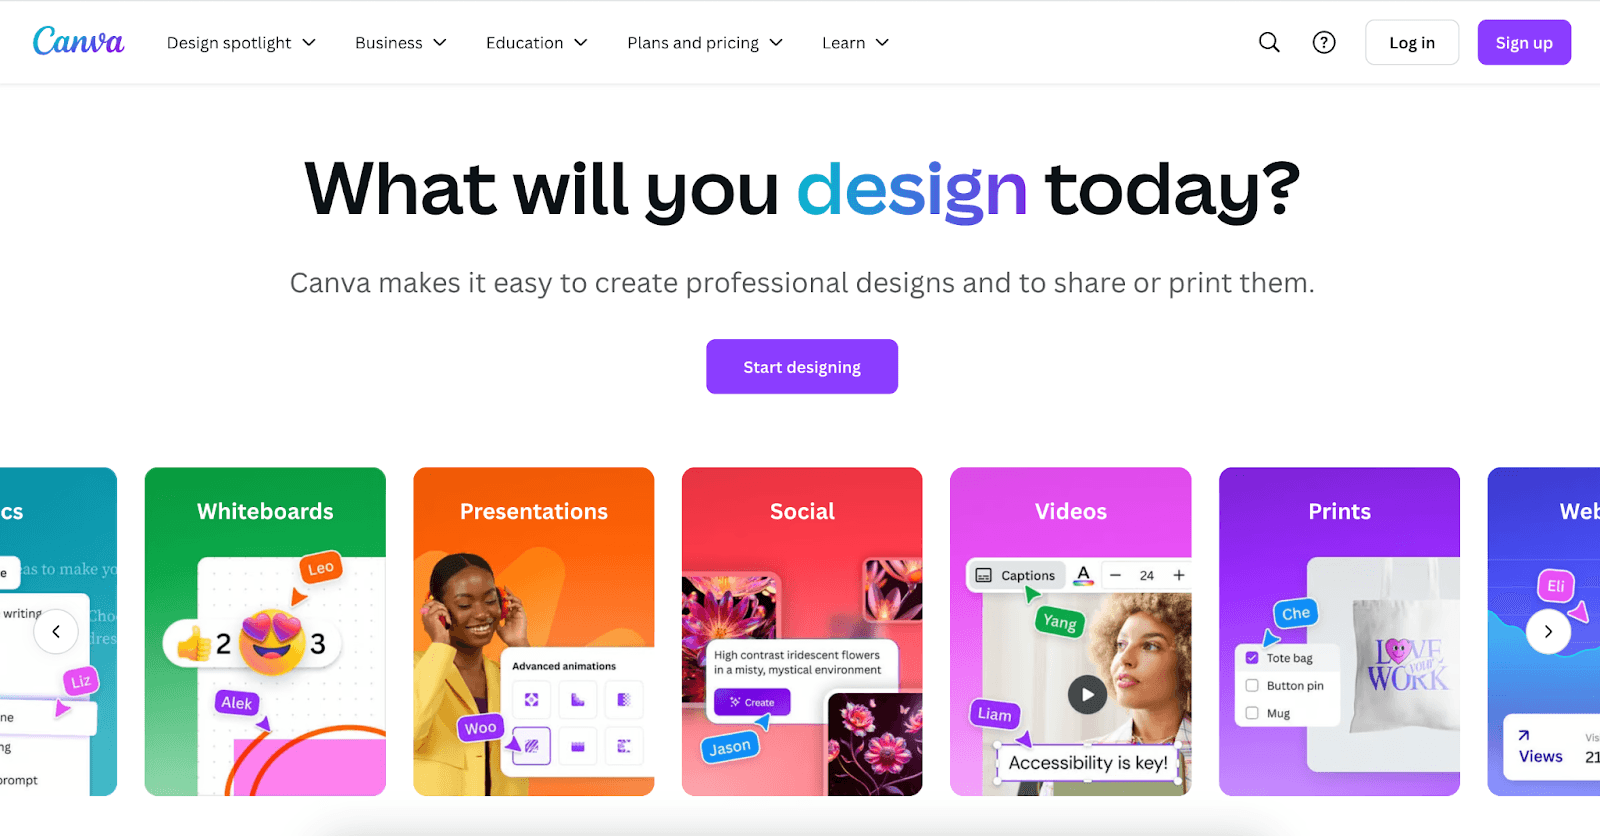
Canva, while known for graphic design, has a growing suite of data visualization tools perfect for creating polished and visually appealing presentations. Its ease of use and focus on aesthetic appeal make it a good option for agencies needing to present marketing data in client-ready formats. Canva allows marketers to create charts, infographics, and other visual aids without the steep learning curve of more complex platforms.
Key Features:
Drag-and-Drop Design: Simplifies the process of creating professional-looking visuals, even for non-designers.
Customizable Templates: Provides templates for charts, infographics, and dashboards to get started quickly.
Collaboration Tools: Teams can work on visuals together in real time for seamless project updates.
Price: Free plan is available, and then the Pro Plan starts at $150/year
7. ChartMogul
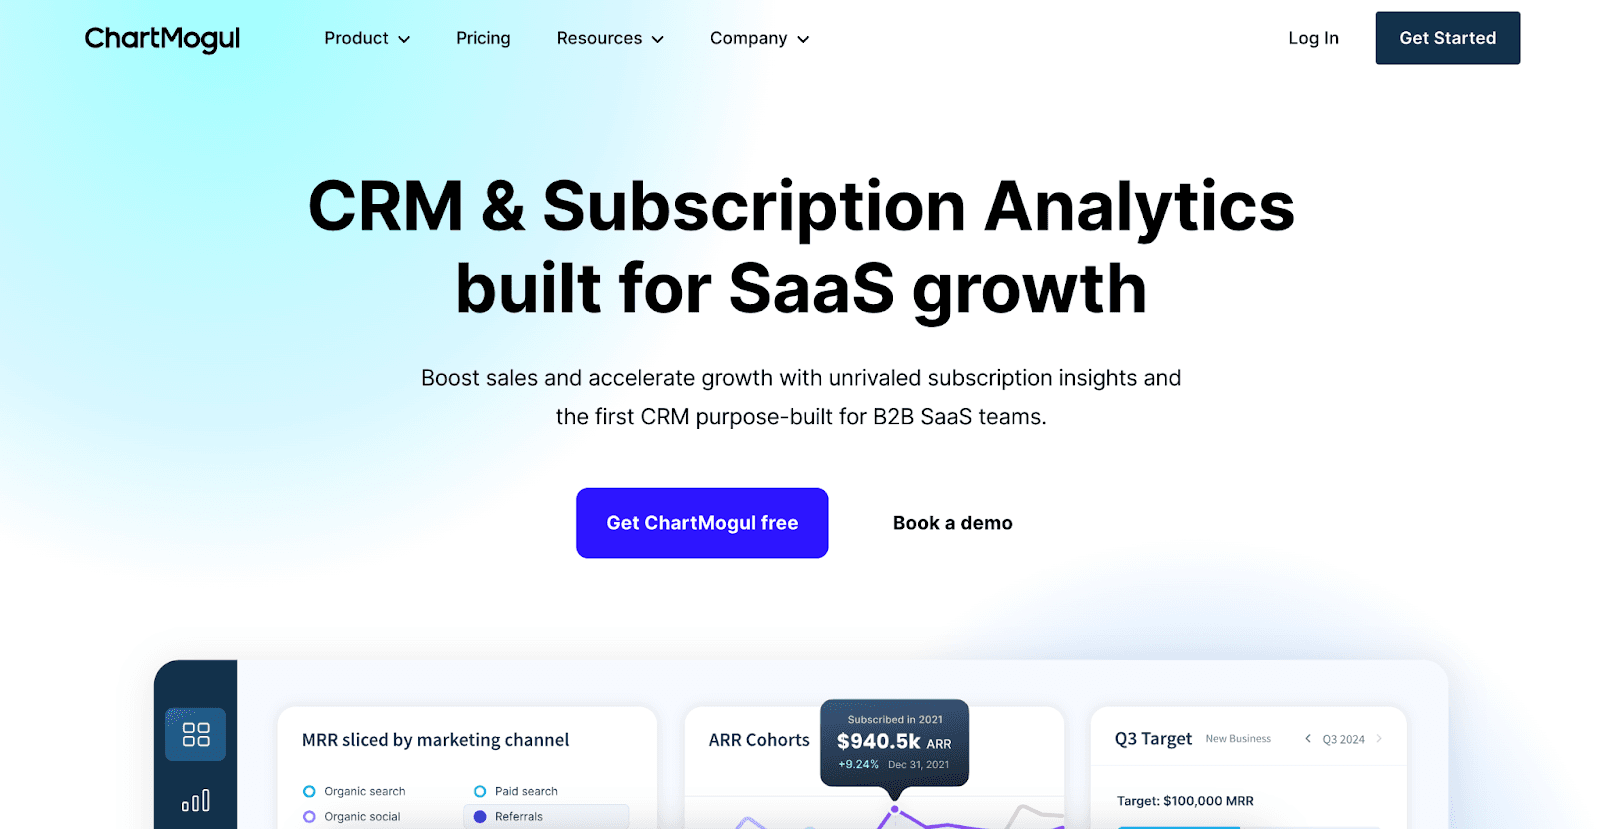
ChartMogul specializes in subscription analytics, making it a unique tool for SaaS companies or marketers tracking recurring revenue metrics. It turns raw marketing data from subscription platforms into clear reports and visualizations. This tool is ideal for marketers focused on customer lifetime value, churn rates, and monthly recurring revenue.
Key Features:
Subscription Metrics Tracking: Offers specialized tools for understanding recurring revenue, churn, and customer retention rates.
Real-Time Reporting: Automatically updates visuals with the latest subscription data for accurate decision-making.
API and Data Import Options: Seamlessly integrate with your client’s subscription billing platform to keep metrics up-to-date.
Price: Free plan is available, and then the Pro Plan starts at $99/month
How To Integrate Data Visualization Tools Into Your Workflow
Integrating data visualization software into your workflow saves your agency’s time while completely transforming how you approach marketing strategies and client reporting.
A tool like AgencyAnalytics, for example, streamlines the process by centralizing data from multiple sources into one intuitive platform. Instead of logging into several dashboards to pull performance metrics, marketers view and analyze everything in one place.
From there, marketers identify the key metrics that need to be tracked regularly, such as ad spend, conversion rates, or organic website traffic. With a tool like AgencyAnalytics, agencies connect a client’s existing platforms—like Google Analytics, Facebook Ads, and SEO tools—and visualize these metrics in real-time dashboards. This simplifies your workflow while ensuring you have a clear overview of campaign performance without switching between systems.
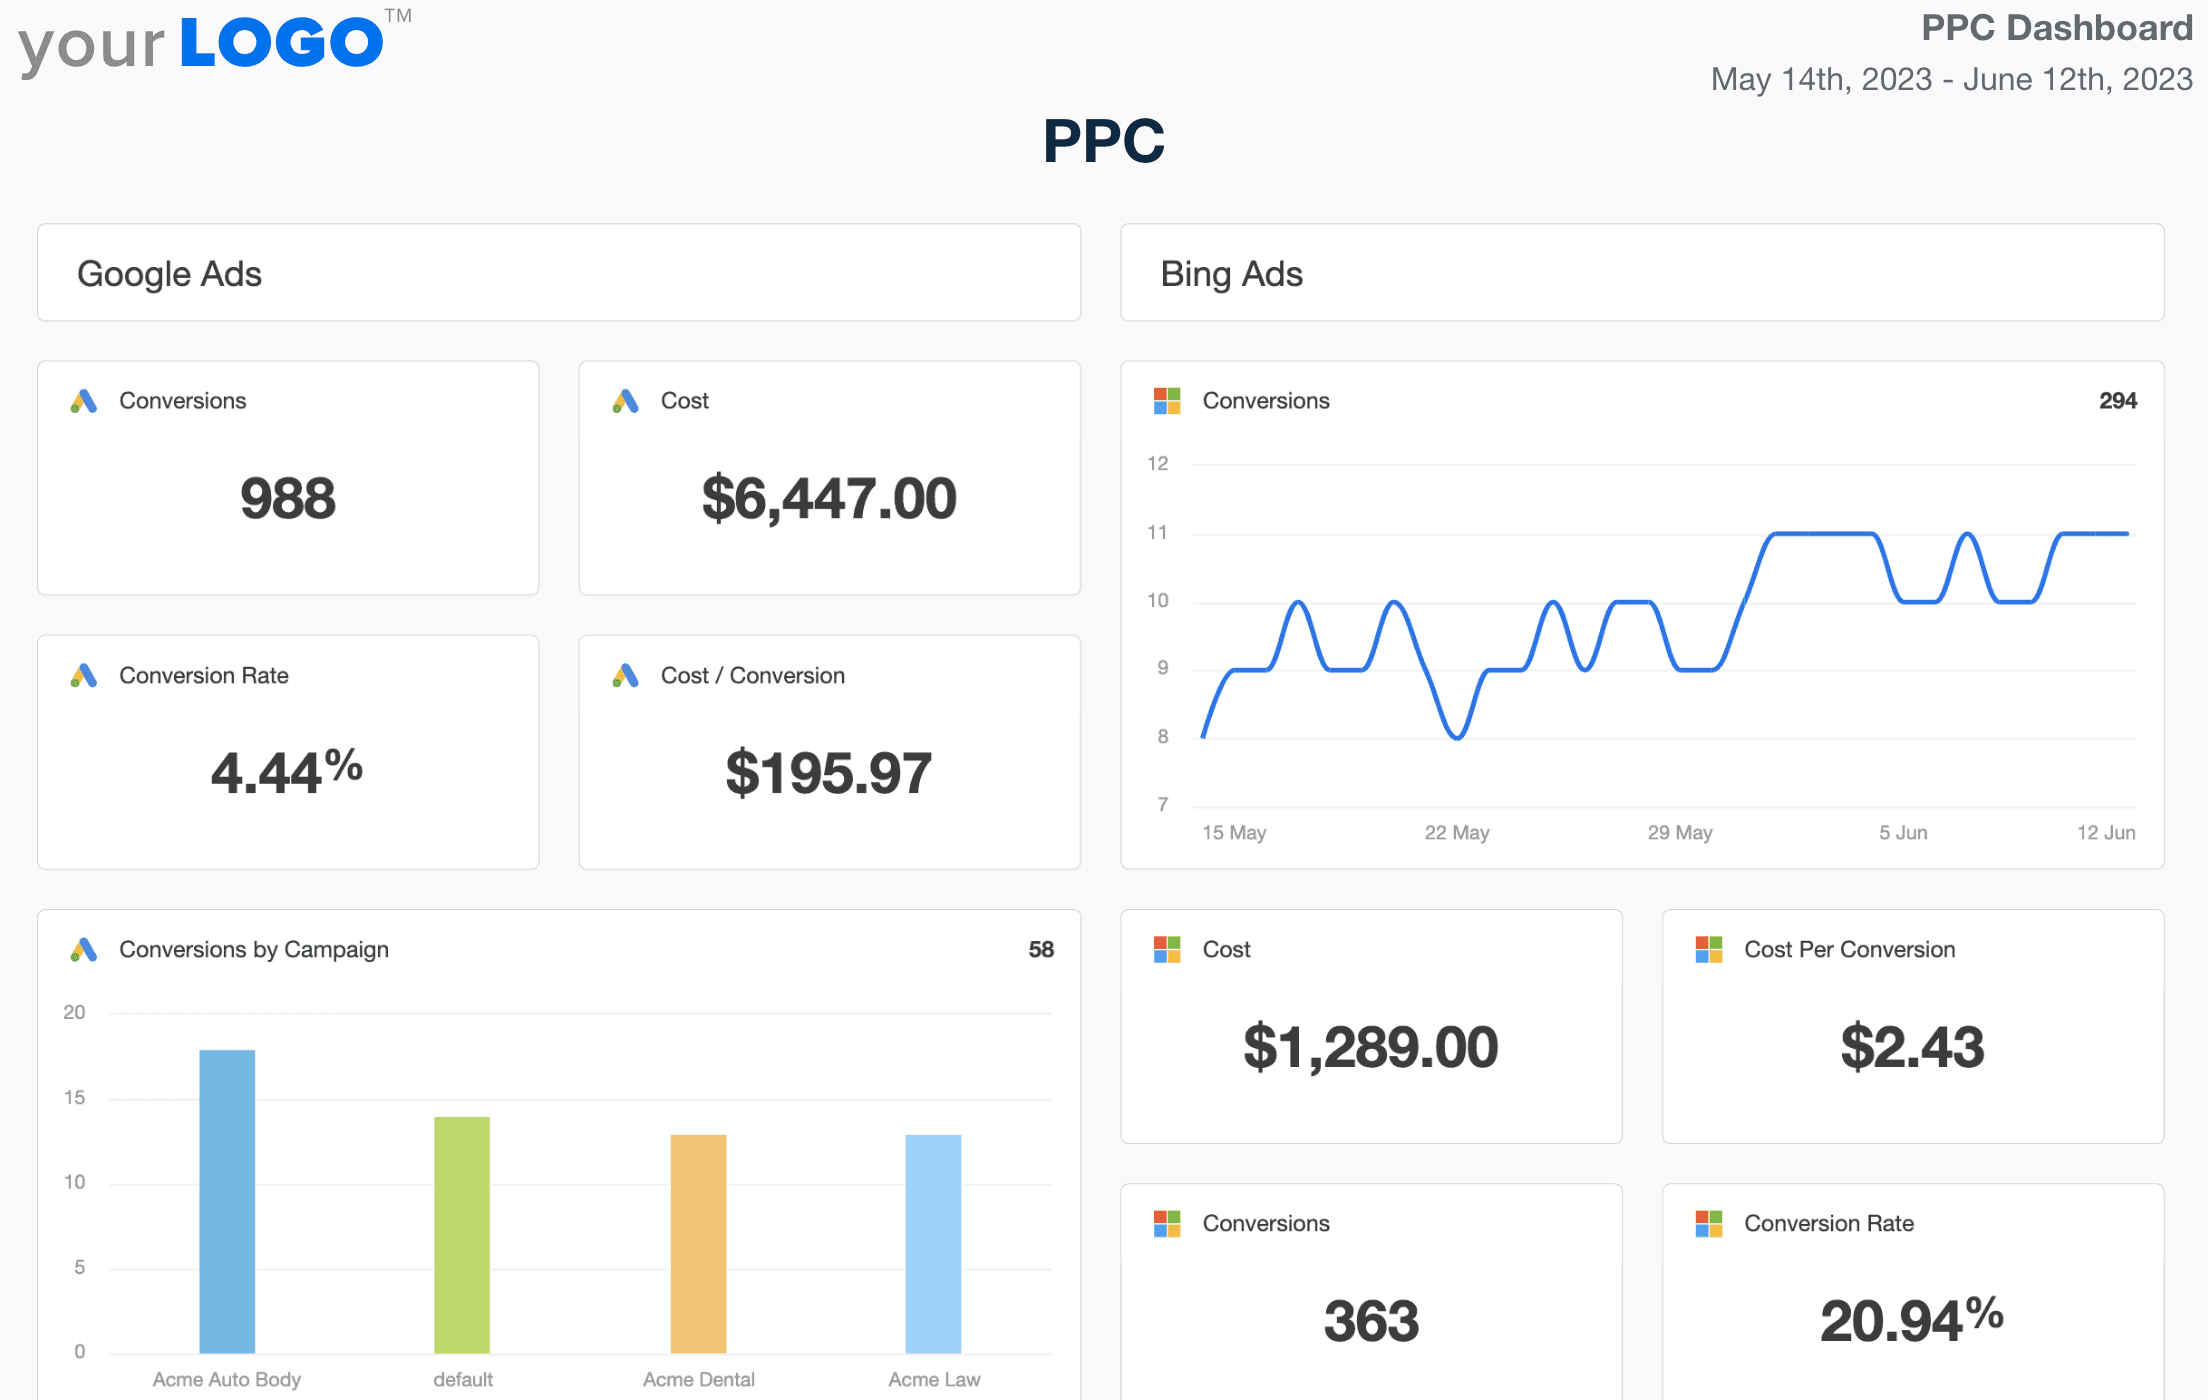
Showcase paid campaign results in a pre-made PPC dashboard. Keeping clients in the loop was never so easy! Try out this template free for 14 days!
Lastly, be sure to leverage automation features wherever possible. AgencyAnalytics also allows you to schedule automated reports, giving you more time to focus on strategy instead of manual data entry.
Agency Tip: Customize your data visualizations. Tailor dashboards and reports to highlight the data that matters most for your team or clients. For example, use interactive charts to drill down into performance trends or bar graphs to compare campaign ROI. Customization ensures your reports are always relevant and actionable.
How To Create Data Visualizations in AgencyAnalytics
Creating impactful data visualizations in AgencyAnalytics is straightforward, thanks to the user-friendly design and detailed customization options. Follow this step-by-step guide to set up data visualization dashboards that impress clients while streamlining your workflow at the same time.
Step 1: Connect Your Data Sources
Start by integrating the tools you already use, such as HubSpot, Instagram Ads, or Google Search Console. AgencyAnalytics supports over 80 integrations, allowing you to centralize your client’s data with the click of a button. Once connected, the metrics will automatically sync, ensuring the dashboards are accurate and always stay up to date.
Step 2: Choose Your Dashboard Template
AgencyAnalytics offers pre-built templates tailored to various marketing goals, such as PPC performance or SEO tracking. For example, if you're analyzing a TikTok Ads campaign, select a PPC dashboard to see clicks, conversions, and ROI visualized instantly. Templates save time and provide a clear starting point for customizing your client’s data.
Read More: TikTok Ads Reporting Made Easy
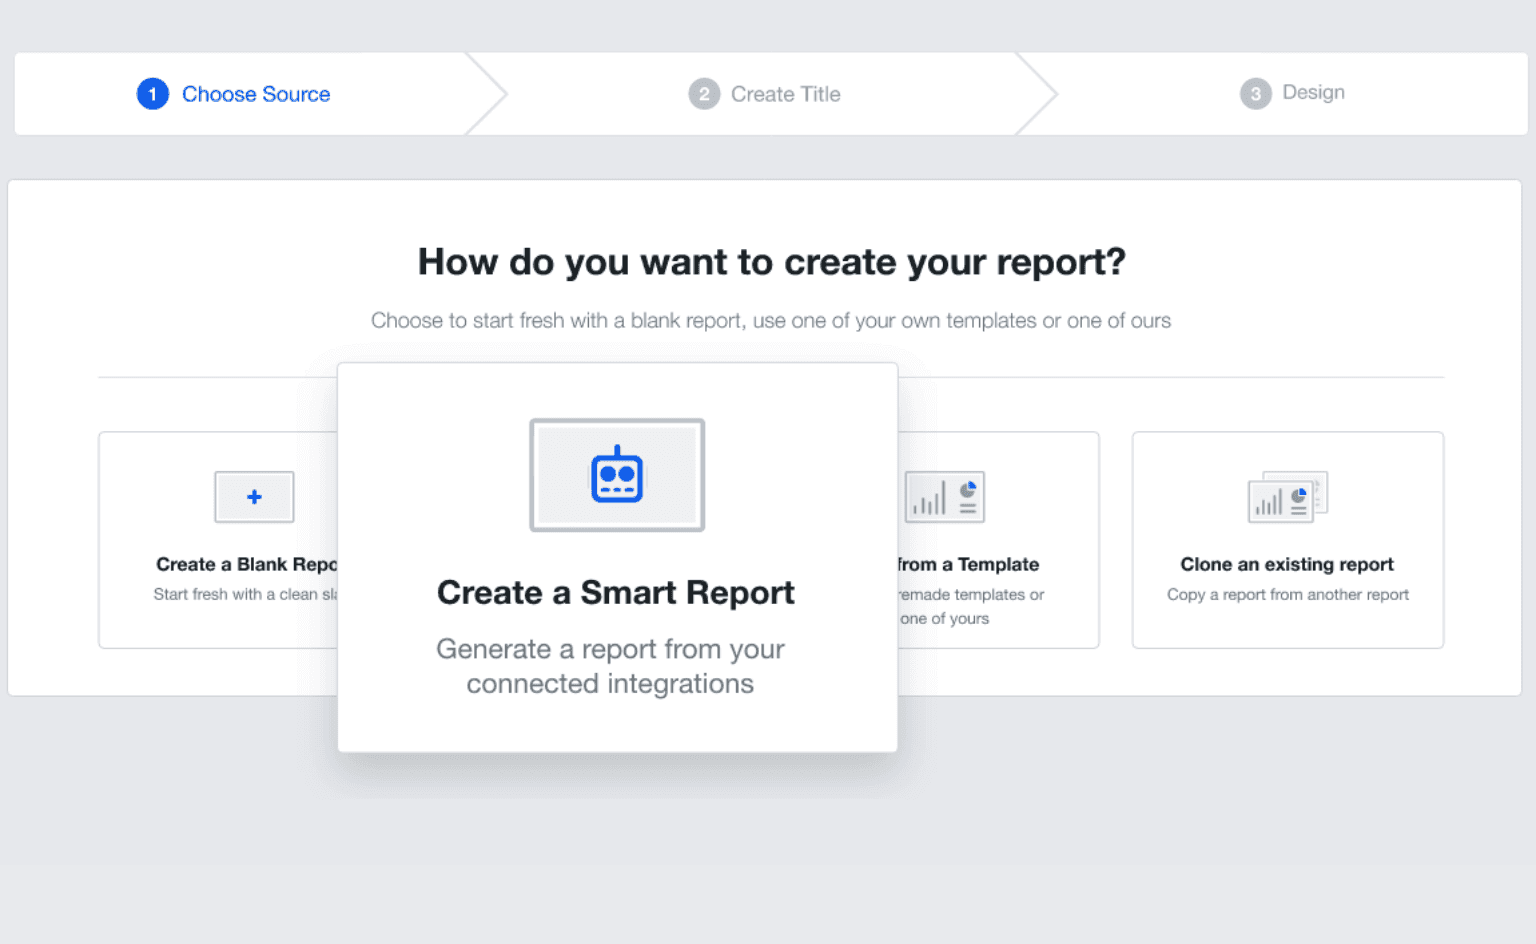
Under a time crunch? The Smart Reports and Smart Dashboards feature from AgencyAnalytics builds exactly what you need in 11 seconds or less. Try it out for yourself with a 14-day free trial.
Step 3: Add and Customize Widgets
Widgets are the building blocks of your dashboard. Use widgets like line graphs to track trends, pie charts to allocate budget, or bar graphs to compare campaign performance. You can customize each widget to display specific data points, such as CTR or bounce rates, ensuring your dashboard focuses on what matters most.
Need help inserting a widget into a client dashboard? Check out this article from our help center to get started.
Step 4: Use Interactive Filters
Interactive dashboards allow you to filter data by time period, campaign, or other variables. For example, if you want to compare monthly performance, adjust the date range filter to see how results evolved over time.
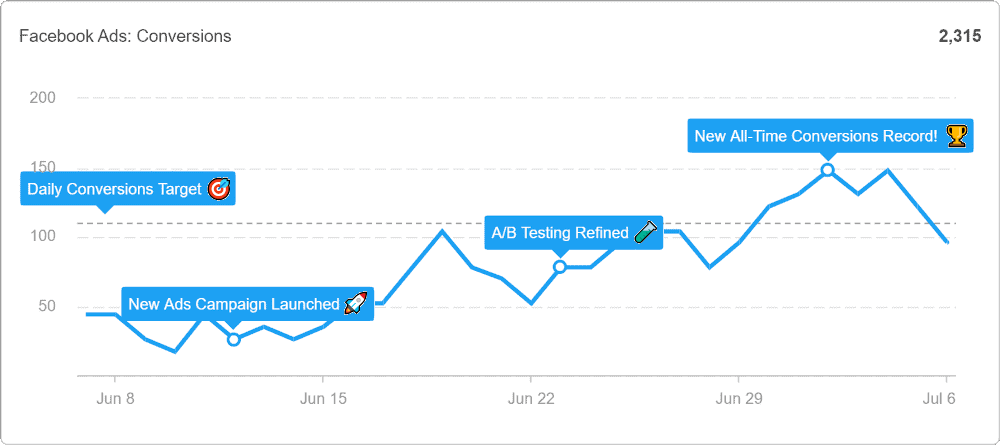
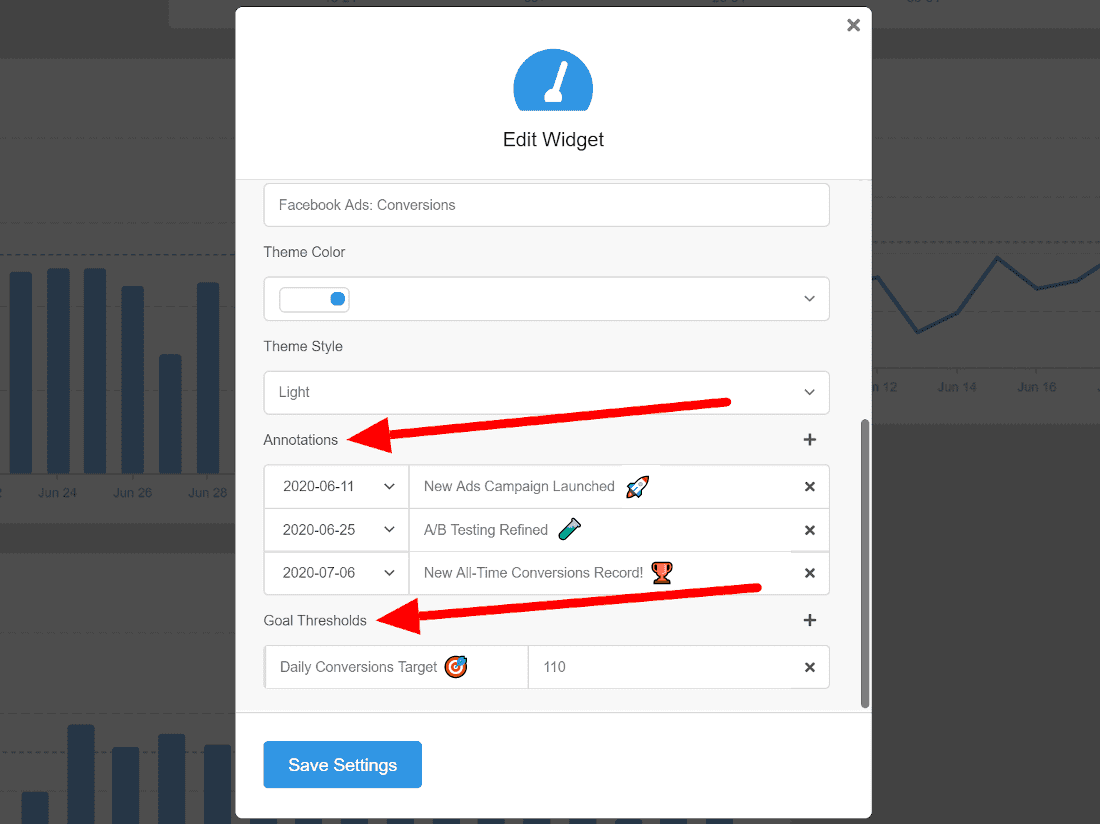
One of the best ways to tell a story with AgencyAnalytics is to add annotations and goals to your charts. For example, highlight important changes in a Google Ads campaign, such as budget changes or new campaign launches. This provides a more complete picture than just the chart itself.
To do so, simply open up the widget’s settings, and you’ll see an option to add annotations and goals in all date-based line and column charts.
Step 5: Share and Automate Reporting
Once your visualizations are complete, share them with clients through live links or scheduled reports. Automation ensures clients receive updates regularly, while live dashboards let them explore data in real time.
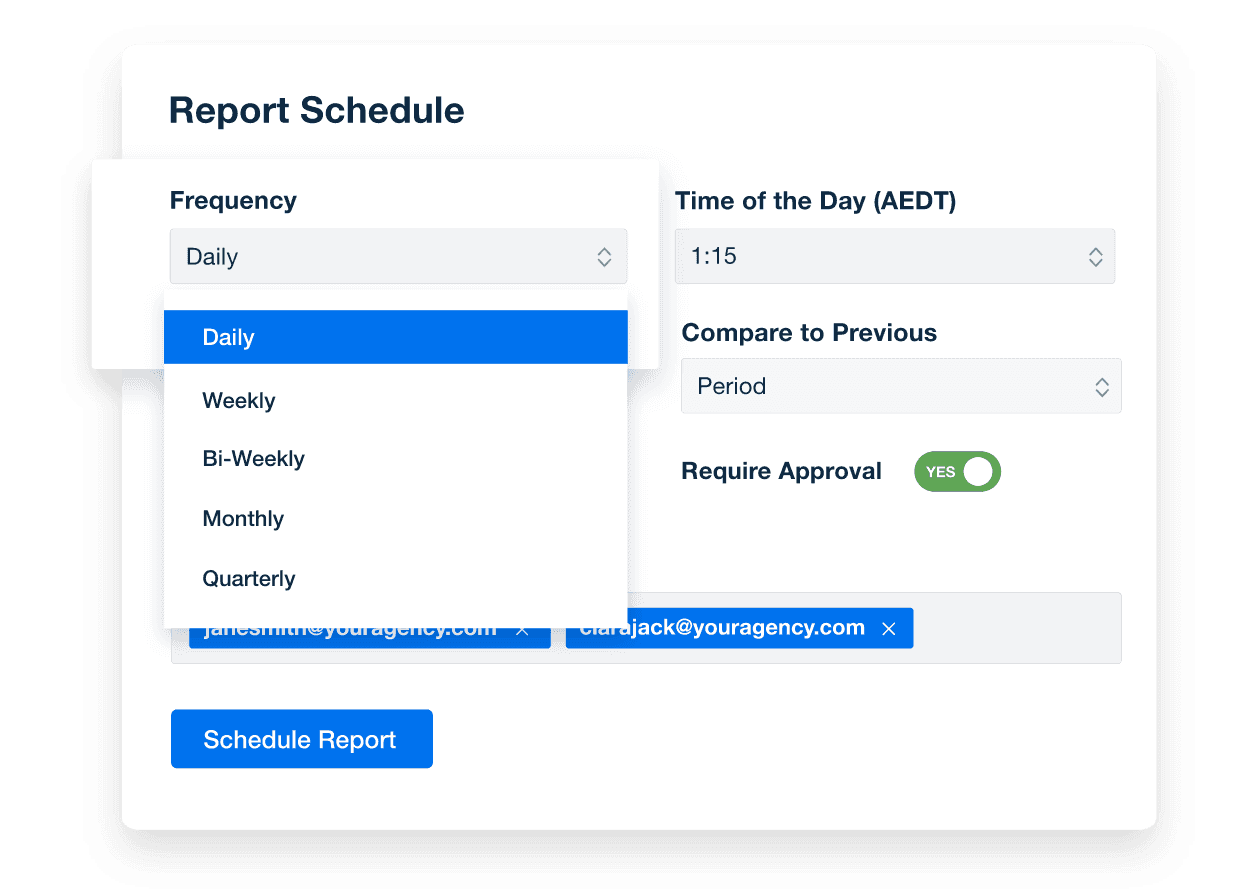
By following these steps, agencies create polished, insightful dashboards visualizations that help busy clients understand their campaign performance at a glance.
Summary and Key Takeaways
Data visualization is a powerful way for marketers to simplify complex metrics and turn them into clear insights. Using the right tools and data visualization techniques, agencies improve reporting, enhance teamwork, and make smarter, data-driven decisions. Whether you’re just starting or refining your approach, the tips in this article will help you work more effectively.
Key takeaways for agencies:
Pick the Right Tools: Look for features like user-friendliness, integrations, and the ability to scale with your needs.
Customize Your Dashboards: Focus on showing the data that matters most to your clients and campaigns.
Automate Reporting: Save time and keep clients in the loop with regular automated updates and live dashboards.
Deliver better insights and show even greater value to your clients with these strategies and tools.

Written by
Richelle Peace is a writer with a degree in Journalism who focuses on web content, blog posts, and social media. She enjoys learning about different topics and sharing that knowledge with others. When she isn’t writing, Richelle spends time teaching yoga, where she combines mindfulness, movement, and her passion for wellness.
Read more posts by Richelle PeaceSee how 7,000+ marketing agencies help clients win
Free 14-day trial. No credit card required.


