Table of Contents
QUICK SUMMARY:
Easily aggregate analytics to combine metrics from multiple platforms into a single view to streamline reporting and surface campaign insights. This guide explains how to use Custom Metrics in AgencyAnalytics to merge cross-channel data into client-ready dashboards.
Manually crafting a clear picture of marketing performance is harder than it should be—especially when your client’s data lives in a dozen different tools. If you’ve ever wanted to combine all your social media followers into one number or track total conversions across ad platforms, you’re not alone.
Many agency teams struggle to aggregate analytics in a way that’s easy to understand and even easier to communicate with clients. But the capability does exist—and it’s built right into AgencyAnalytics.
Using Custom Metrics, it’s easy to aggregate data across multiple platforms and visualize the exact metrics your clients care about most in an automated KPI dashboard. This guide walks you through the process step by step, using real agency use cases.
Why aggregated analytics is a game-changer for agencies
When your data is scattered across multiple platforms, reporting becomes more time-consuming, more prone to errors, and less valuable to your clients.
That’s where aggregated analytics comes in. To put it simply, aggregation in data analytics means combining data points from different sources into a single, meaningful number or data visualization. Whether it’s total ad spend, cross-platform conversions, or something unique to a client, aggregation helps agencies get a clearer, more strategic view of performance.
An analytics aggregator like AgencyAnalytics does the heavy lifting—pulling in client data from 80+ integrations, letting you combine it however you need, and surfacing the most critical insights in one place.
One of the biggest benefits of AgencyAnalytics is that it has allowed us to streamline our data collection process. We no longer need to manually pull data from different sources or create custom scripts to extract data from APIs. Instead, AgencyAnalytics integrates with a wide range of data sources, including Google Analytics, Google Ads, Facebook Ads, and more, making it easy to collect and aggregate data in one place.
Daniel Dye, President, Native Rank, Inc.
Aggregated analytics isn’t about saving time—it’s about helping clients (and your agency) see the complete picture of your marketing efforts, and the impact on their business. That means better decisions, fewer questions, and more trust in your agency’s value.
We differentiate ourselves by showing clients their true marketing ROI. Our AgencyAnalytics dashboard is basically the reason we are able to guarantee this knowledge to our clients. It aggregates their total marketing investment, total quote and sales value and ultimately, their ROI.
Gabriela Paiva, Marketing Manager, Digilatics
What are custom metrics (and why you should use them)
Aggregated data provides agencies with a clearer view of performance, but without the right tools, achieving this isn’t always straightforward. When raw data is scattered across social media platforms, ad tools, and analytics dashboards, the reporting process slows down. It also increases the chance of errors.
Custom metrics simplify the data aggregation process using data aggregation tools
Instead of reporting on each number individually, use data aggregators to easily combine values into a single metric that reflects what your clients actually care about. For example, instead of showing five different follower counts, create one “Total Social Followers” metric—automated and updated in real time.
Custom metrics help you:
Create client-specific KPIs that reflect their goals
Eliminate manual data collection and reduce complexity
Automate effective data aggregation
Visualize cross-platform performance at a glance
Build dashboards that are easier for clients to understand
With AgencyAnalytics, you define the formula—like “Instagram followers + Facebook followers + LinkedIn followers”—and the platform does the rest. No spreadsheets, no code, and no jumping between tools.
Client dashboards and custom metrics are extremely valuable. We save a lot of time each month by sharing a dashboard where our clients can regularly check in and see status updates from our team. The ability to add custom metrics also makes things easier for us to aggregate KPIs across different channels.
Bryan Lozano, Vice President of Operations, Ad-Apt
Custom metrics are one of the most effective tools for data aggregation available to agency teams. They help improve data quality, speed up the data analysis process, and unlock insights that might be hidden across disconnected data sources.
You always want to make sure the aggregate of your marketing efforts are leading to net positive ROI.
Bryan Lozano, Vice President of Operations, Ad-Apt
Impress clients and save hours with custom, automated reporting.
Join 7,000+ agencies that create reports in under 30 minutes per client using AgencyAnalytics. Get started for free. No credit card required.
Practical ways to aggregate data using custom metrics
Now that we’ve covered what custom metrics are, let’s look at how they help marketing agencies turn raw data into valuable insights.
The following use cases demonstrate how to aggregate data across multiple sources, eliminate manual reporting, and deliver a more comprehensive view of client performance—all using a few simple formulas within AgencyAnalytics.
Combine social media followers into one metric
One of the most common requests from agency clients is a simple one: “How many followers do we have now?”
But when those followers are split across Instagram, LinkedIn, Facebook, TikTok, and other platforms, answering that question isn’t always quick—or easy. Many agencies find themselves manually adding up those numbers each month or sharing separate totals that don’t tell the whole story.
With custom metrics, bring all your client’s social media followers into one clear number.
How to build it:
Open your client’s dashboard, select Custom Metrics, and click Add Custom Metric
Determine the platforms you want to include (e.g., Instagram, Facebook, LinkedIn, TikTok)
Add each platform’s “Followers” metric to your formula
Label the metric something clear, like “Total Social Followers”
Add it to your dashboard or monthly report
The result: a single, real-time number that updates automatically and helps clients track growth at a glance.
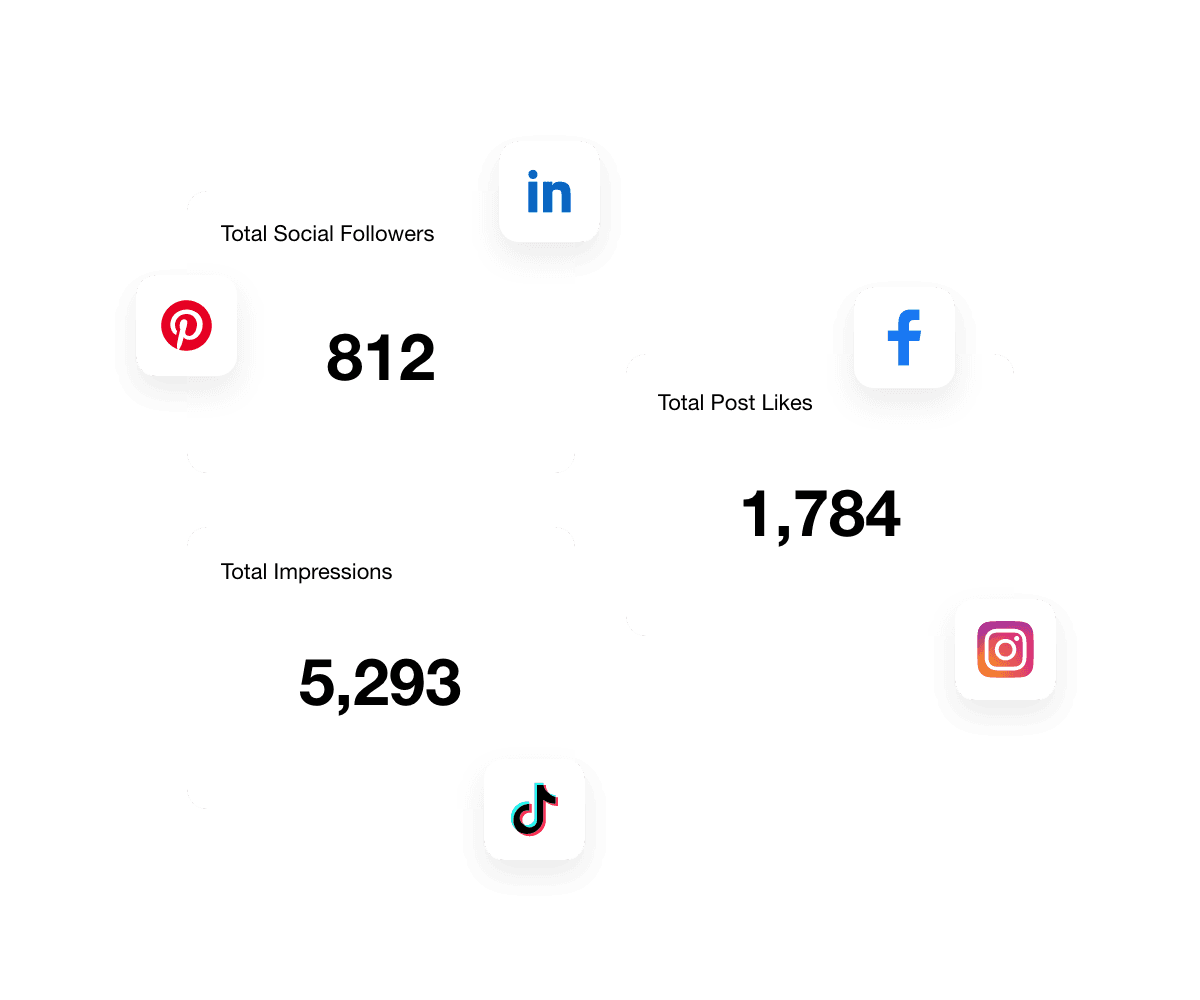
This is one of the simplest examples of data aggregation—but also one of the most impactful. Instead of jumping between platforms or scrolling through raw data, give clients a fast, high-level view of their social presence. It’s an easy win that makes your dashboards more useful and your reports more aligned with client expectations.
Other social metrics that can easily be aggregated:
Total post impressions across all social channels
Engagement rate across platforms (e.g., total engagements ÷ total followers)
Total clicks on social posts
Video views from Instagram, TikTok, Facebook, and YouTube
These metrics provide clients with a clearer picture of their social media performance—without having to dig through multiple platforms to piece together the information. And because they update automatically, there's no manual cleanup or rework each month.
Total ad spend across platforms
Ad budgets are often split across multiple channels, including Google Ads, Facebook, Instagram, LinkedIn, TikTok, and others. But clients don’t want six different numbers. They want to know:
How much did we spend this month?
Custom metrics make it easy to show total ad spend in one number, so your team doesn’t have to calculate totals by hand each month.
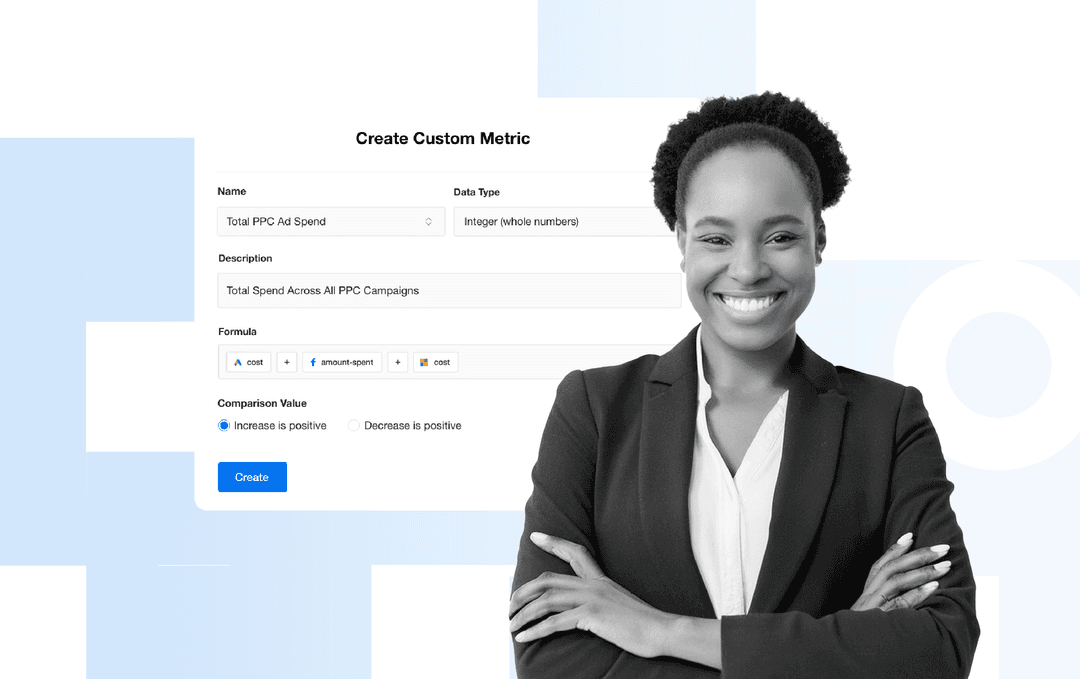
How to build it:
From your client’s dashboard, select Custom Metrics, and click Add Custom Metric
Add the “Cost” or “Spend” metric from each relevant platform (e.g., Google Ads, Meta Ads, LinkedIn Ads)
Use the formula builder to add those values together
Label the metric clearly—like “Total PPC Ad Spend”
Display it in a dashboard widget or reporting section
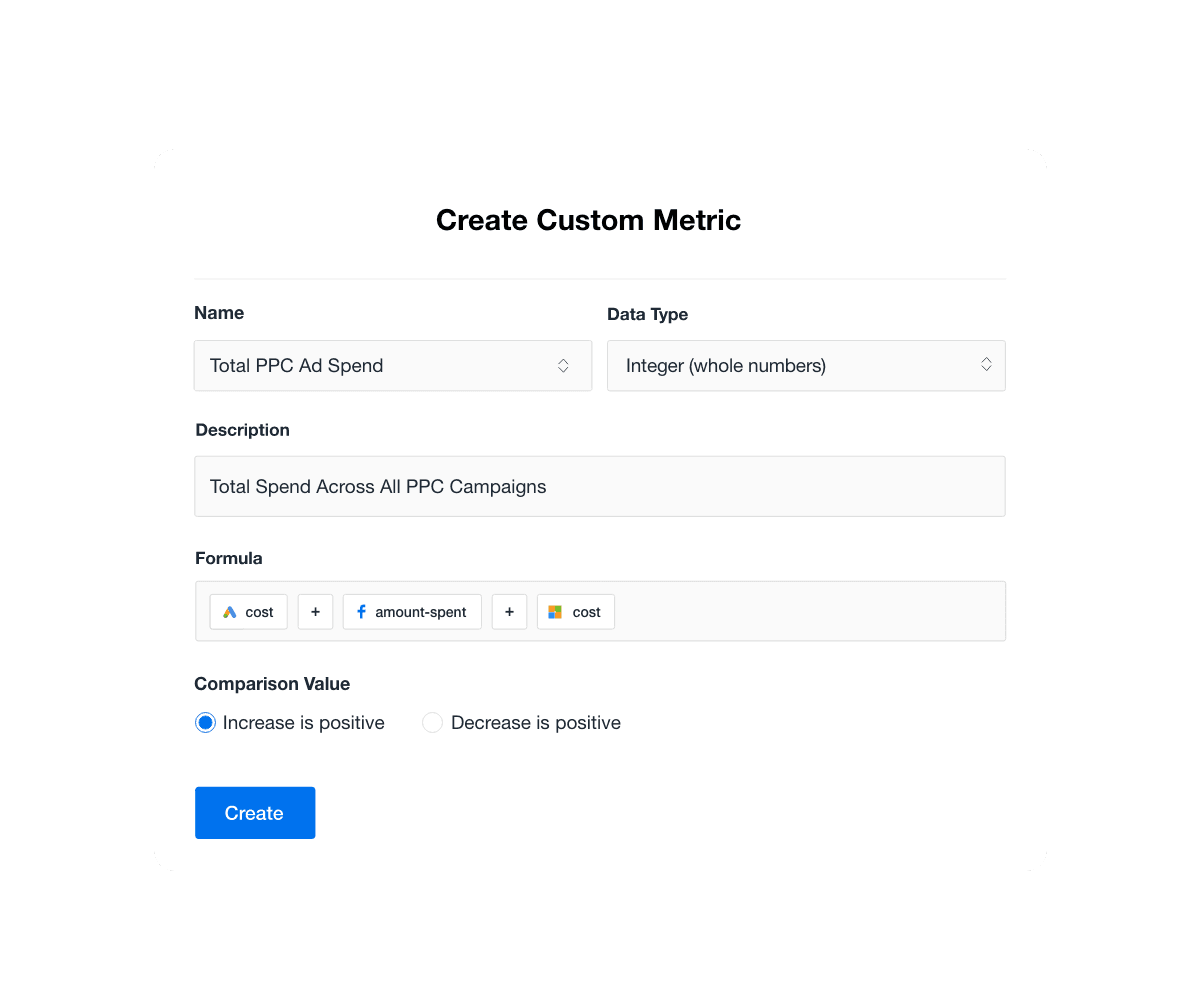
Agency tip: Remember that each platform names its metrics differently (e.g., Google Ads uses 'Cost', while Facebook Ads calls it 'Amount Spent'). When in doubt, check the default dashboard to find the naming convention for that metric.
By centralizing ad spend in one place, you help clients quickly see how their budget is being utilized—and it sets the stage for deeper analysis, such as ROAS or cost per conversion.
Other PPC metrics that can easily be aggregated:
Total impressions across paid channels
Combined clicks from Google Ads, Meta Ads, LinkedIn Ads, etc.
Average cost per click (CPC) across all platforms
Total conversion rate from all PPC campaigns
Average click-through rate (CTR) across campaigns
These metrics help clients understand paid performance from a broader perspective, without needing to dig into individual ad platforms.
Calculate revenue across all channels
Many clients generate revenue from multiple sources, including ecommerce platforms, lead generation campaigns, in-store through POS systems, and offline sales tracked through CRM integrations. But when that data is siloed, it’s hard to answer one of the most important questions in marketing:
How much revenue did your marketing efforts generate?
With custom metrics, combine revenue from all connected sources into one aggregated total.
How to build it:
In your client’s dashboard, select Custom Metrics, and click Add Custom Metric
Add each platform’s revenue metric (e.g., Shopify Sales, Stripe, and HubSpot Deal Revenue)
Use the formula builder to total these values
Name it something clear, like “Total Revenue”
Place it prominently in your dashboard or report
This helps clients understand the full return on their marketing investment, even when sales data is spread across different systems. It also creates a foundation for comparing revenue against costs or identifying top-performing channels.
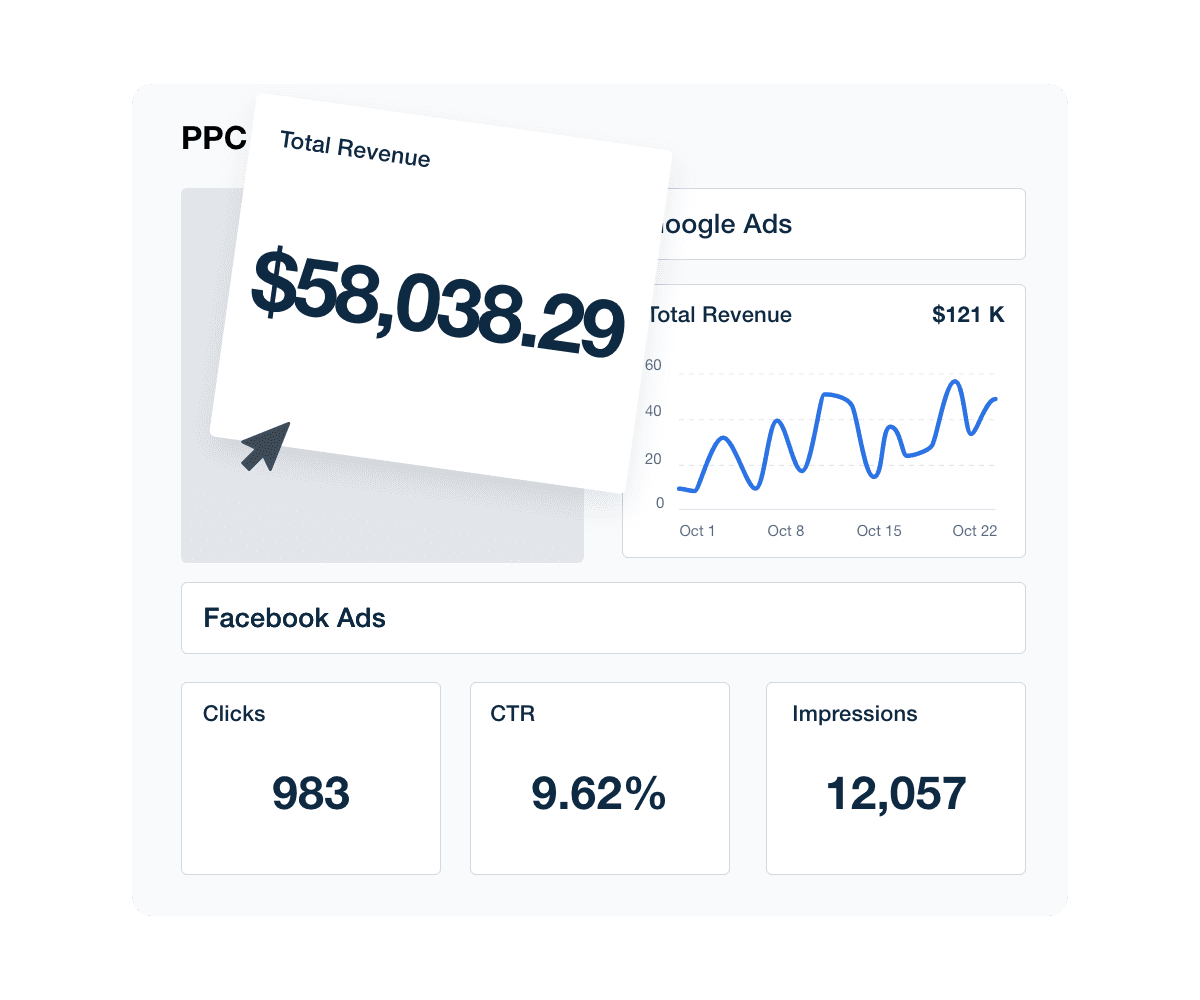
By consolidating data from multiple sources, your team gains insights faster and delivers more strategic reporting—without relying on spreadsheets or manual aggregation methods.
Other revenue metrics that can easily be aggregated:
Total ad spend as a percentage of revenue
Average order value across multiple ecommerce stores
Return on ad spend across all campaigns
These advanced metrics help agencies move beyond basic reporting and into true performance analysis, offering clients a comprehensive view of sales performance across every channel.
Turn complex data into actionable insights
Agencies are dealing with more data than ever before—from paid ads to social engagement to CRM sales pipelines. But more data doesn’t always mean more clarity. Especially when those data points are scattered across tools with different formats, naming conventions, and update cycles.
That’s where custom metrics—and the right data aggregation techniques—make all the difference.
Instead of working with disconnected, single data points, custom metrics make it easy to combine complex datasets into a summarized form that’s easier to understand and act on. No coding. No data scientists required. Just a clean, automated process built for marketing teams.
Accurate reporting is a great way to show customers that the work you are doing is making a difference. It also provides a huge benefit to the customer when all of the marketing data is centralized into one report.”
Ryon Gross, CEO, Local Leap Marketing
By combining data from multiple sources, you give clients a more accurate picture of performance—whether you’re analyzing ad spend, summarizing sales data, or identifying patterns across a large dataset of social media engagement metrics.
And because everything updates automatically, it’s easier to make informed decisions and extract meaningful insights without waiting for someone to clean and merge reports manually.
Whether you’re a data analyst, account manager, or agency owner, building custom metrics in AgencyAnalytics helps reduce complexity, improve data quality, and turn raw data into real business intelligence.
Frequently asked questions about data aggregation in client reporting
Raw data often comes in different formats, contains inconsistencies, or includes unnecessary values that clutter your dashboards. Before using it for reporting, it typically needs data cleaning, transformation, and in some cases, summarizing to highlight key insights. Tools like AgencyAnalytics help automate this process, turning raw data points based inputs into clean, client-ready dashboards.
Custom metrics allow you to follow several data aggregation best practices:
Use consistent, meaningful naming conventions
Centralize your metrics in a single dashboard
Apply the same formulas across clients for better benchmarking
Reduce risk of human error by avoiding manual entry
Ensure you're combining high-quality data across integrations
This not only supports more reliable reporting but also enhances customer satisfaction.
While AgencyAnalytics isn’t designed for complex statistical analysis or research-level statistical methods, it does offer advanced analytics features, such as custom formulas, averages, percentages, and comparisons against previous time periods. These help you analyze trends and performance without needing data engineers or dedicated analysts.
Almost anything that’s measurable: ad spend, clicks, conversions, revenue, social media followers, and more. AgencyAnalytics pulls in detailed data from 80+ integrations and supports combining data across multiple sources into a single view. This includes both individual-level data and summarized data, depending on the client’s specific needs.
Yes. Your client dashboards in AgencyAnalytics act as a centralized repository for all incoming metrics. Through seamless integration with tools like Google Ads, Facebook, HubSpot, Shopify, and many more data sources, your data is automatically pulled in, stored, and updated—no need for separate data warehousing solutions.
AgencyAnalytics offers data integration with over 80 of marketing tools, meaning you don’t have to manually connect APIs or manage data pipelines. All metrics are fed into the platform using secure connections, ensuring data security and consistency across all dashboards.
Yes. Every custom metric in AgencyAnalytics can be filtered by a specified time period—daily, weekly, monthly, quarterly, or custom ranges. This helps agencies identify patterns, understand campaign momentum, and support better decision-making over time.
No. Even with large datasets and complex data, the platform is optimized to process large volumes efficiently. Because calculations happen within the platform’s backend, there's no need for additional computational resources on your end.

Written by
Paul Stainton is a digital marketing leader with extensive experience creating brand value through digital transformation, eCommerce strategies, brand strategy, and go-to-market execution.
Read more posts by Paul StaintonSee how 7,000+ marketing agencies help clients win
Free 14-day trial. No credit card required.


