Table of Contents
QUICK SUMMARY:
An agency differentiator is a unique element that sets an agency apart in a competitive market. When used effectively, it becomes a visible proof of performance. This article explores how agencies position client reporting to foster trust, secure deals, and differentiate themselves in a crowded marketplace.
Most agencies see reporting as a necessary task. However, the most successful agencies view it for what it truly is: proof of their value to clients.
Client reports do more than share performance metrics. They demonstrate attention to detail, responsible management of the client’s investment, and a proactive, data-driven approach.
It’s easy to talk about being a results-focused agency. But when your reports back that up—beautifully, clearly, and consistently—it creates trust. And trust is what keeps clients.
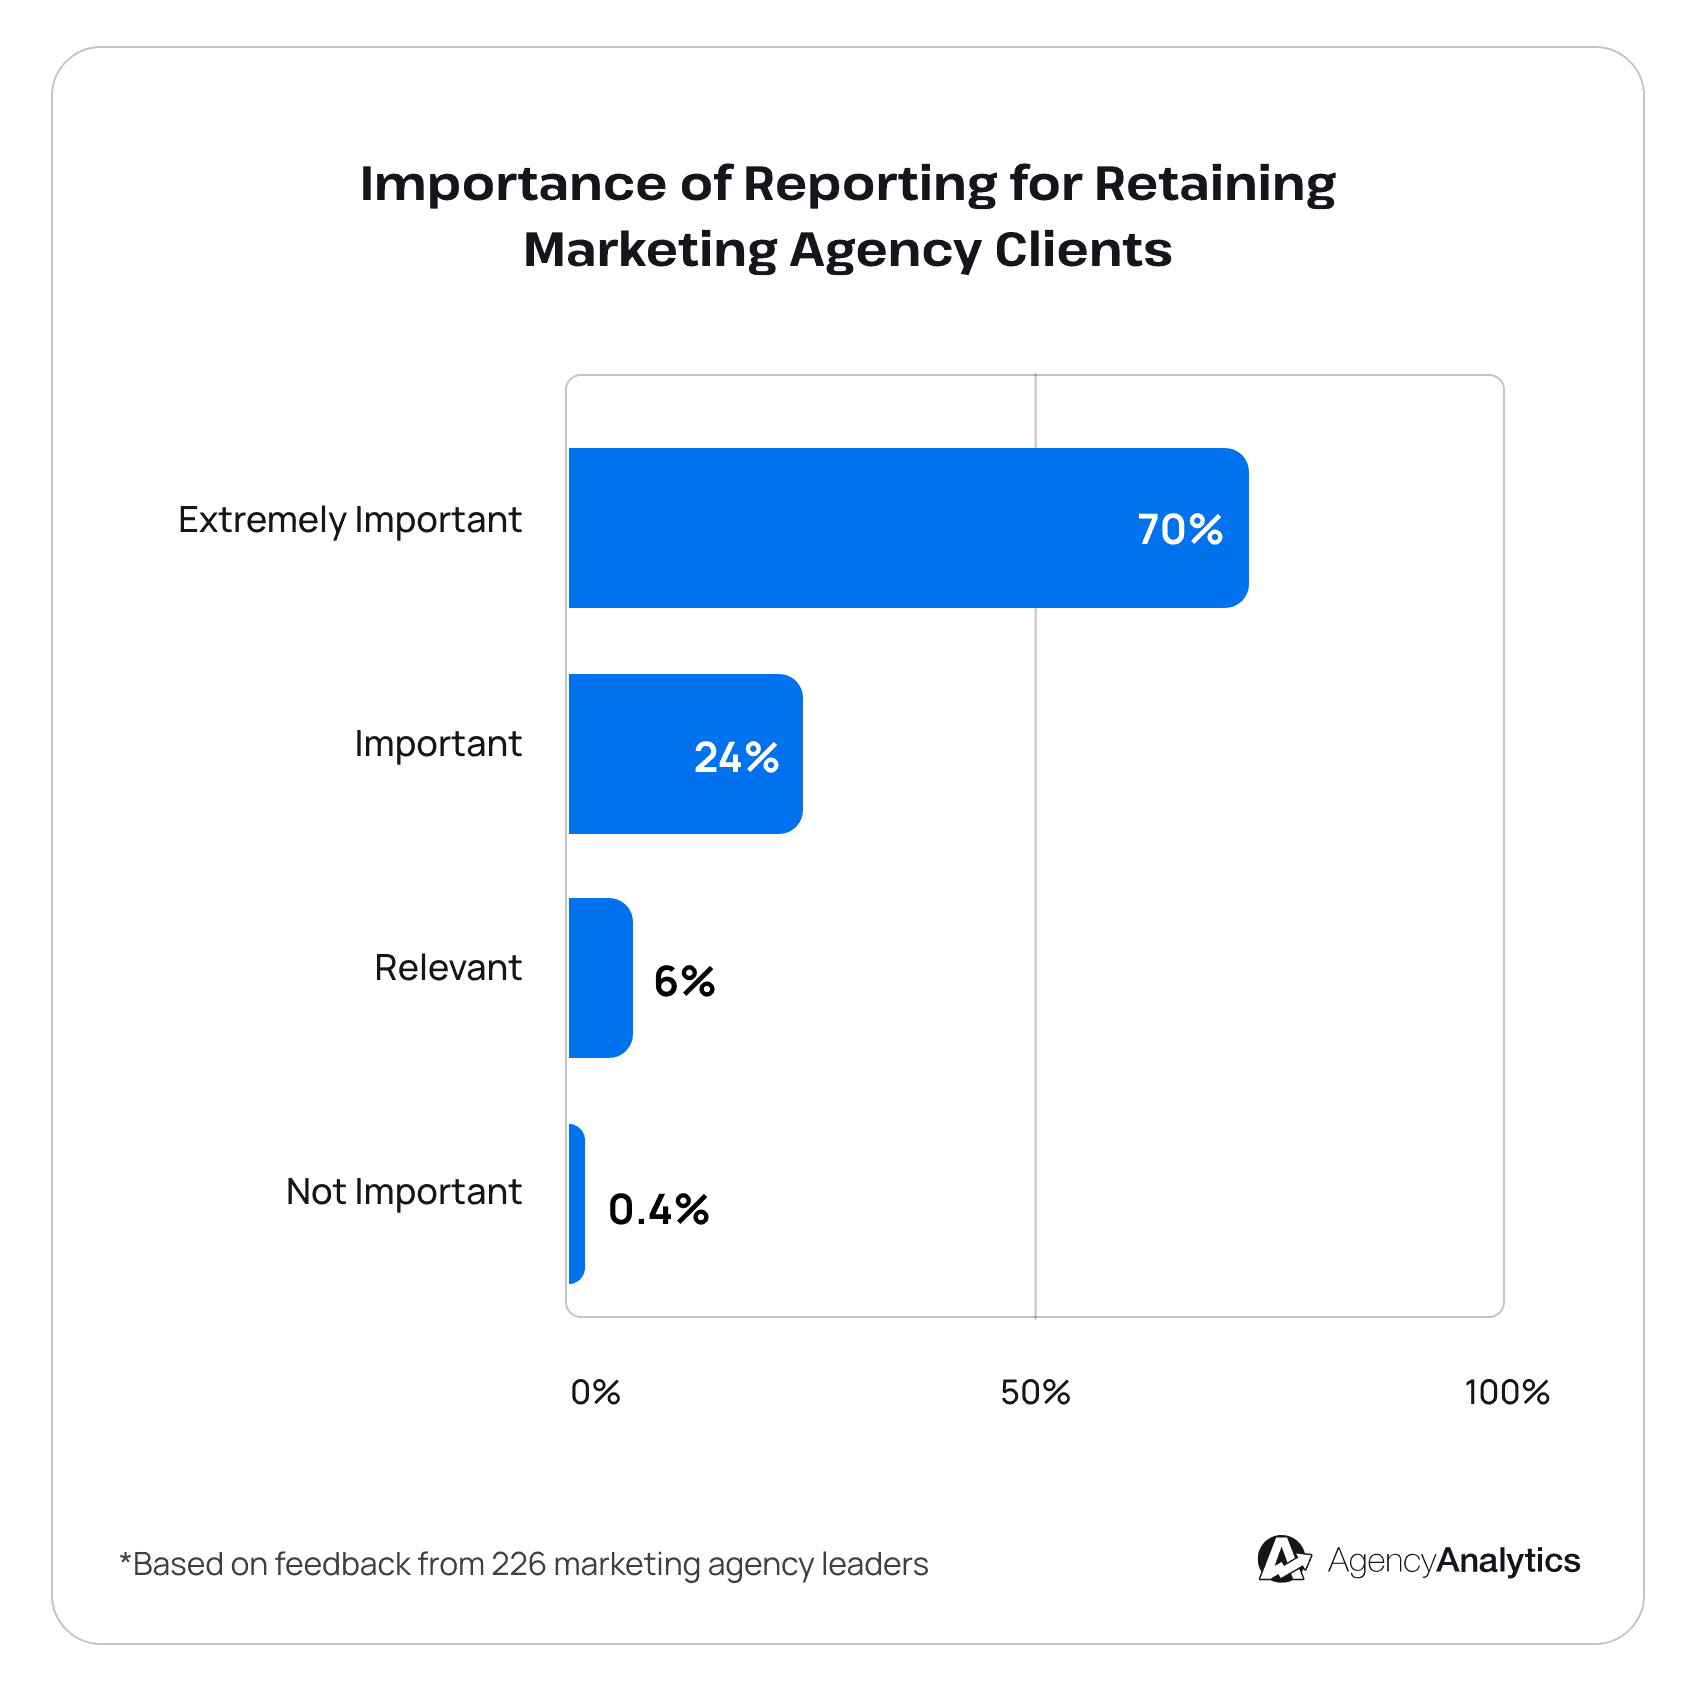
In fact, according to the 2025 Marketing Agency Benchmarks Report, 70% of marketing agency leaders agree that client reporting is “extremely important” to retaining clients.
Today, we’re going to share how top agencies are using client reporting to differentiate themselves from competitors, land new business, and keep the clients they have long-term.
Agencies are already using reporting to stand out (Here’s how)
For many agencies, reporting has evolved beyond a monthly review of what happened. It now plays a central role in sales conversations, onboarding, and ongoing client communication—serving as a clear differentiator for the over 7,000 agencies using AgencyAnalytics.
Here’s how agencies are putting it to work:
Feature callouts that reinforce transparency
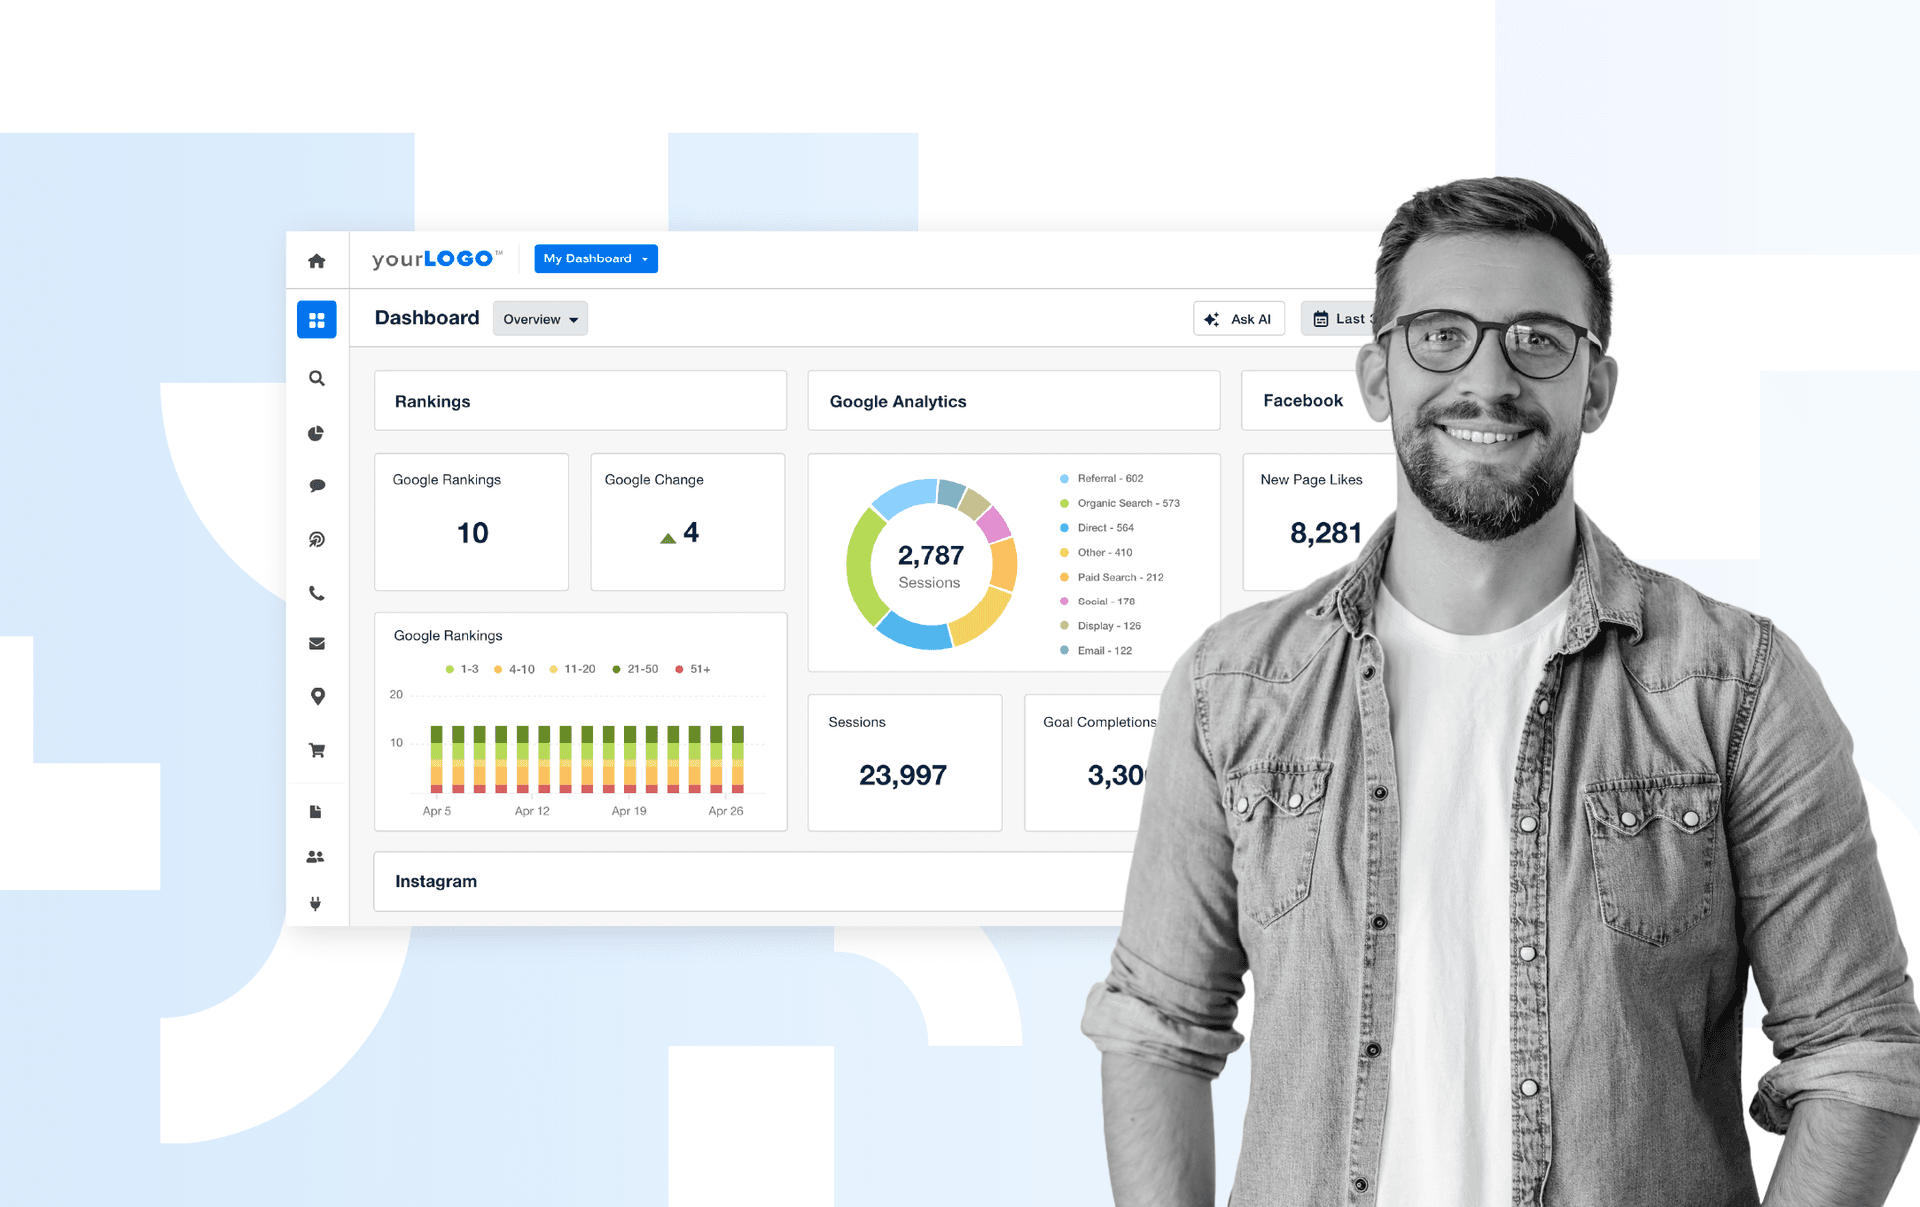
Some agencies include dedicated feature sections on their homepage or service pages to highlight transparent reporting. Often paired with a dashboard image, these sections spell out how the agency keeps clients informed with easy-to-understand metrics that are always accessible.
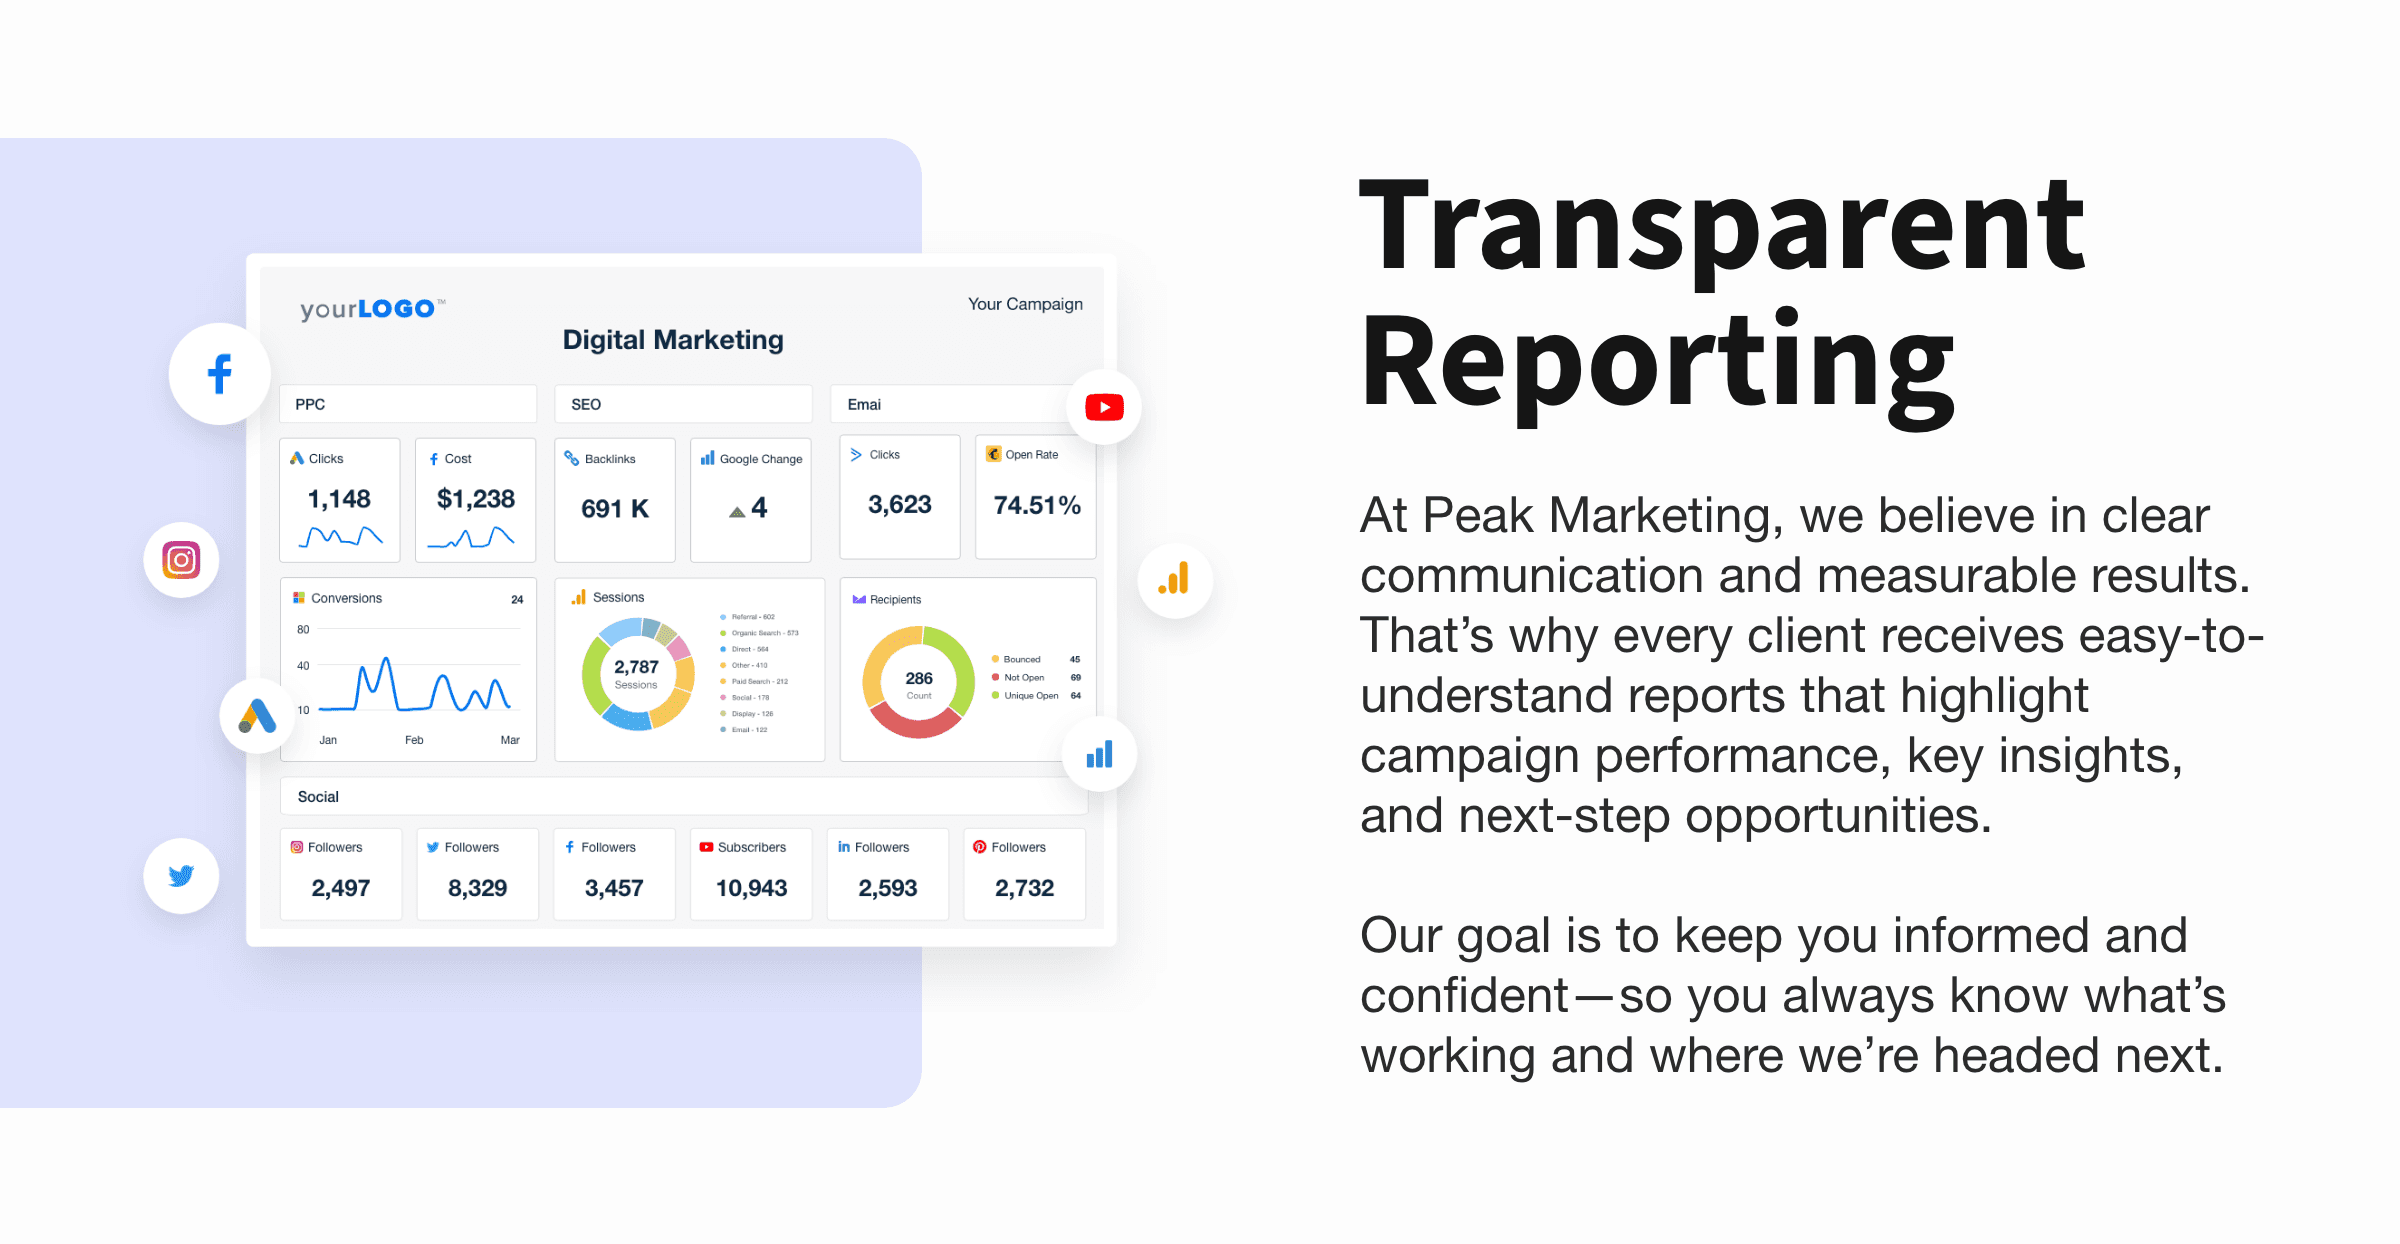
These callouts show how the work delivers results—and how the agency proves it. For example, a screenshot of a live SEO dashboard, accompanied by a callout about transparent reporting practically shouts, “You’ll know exactly what’s happening with your campaigns.”
Service pages that include dashboard visuals
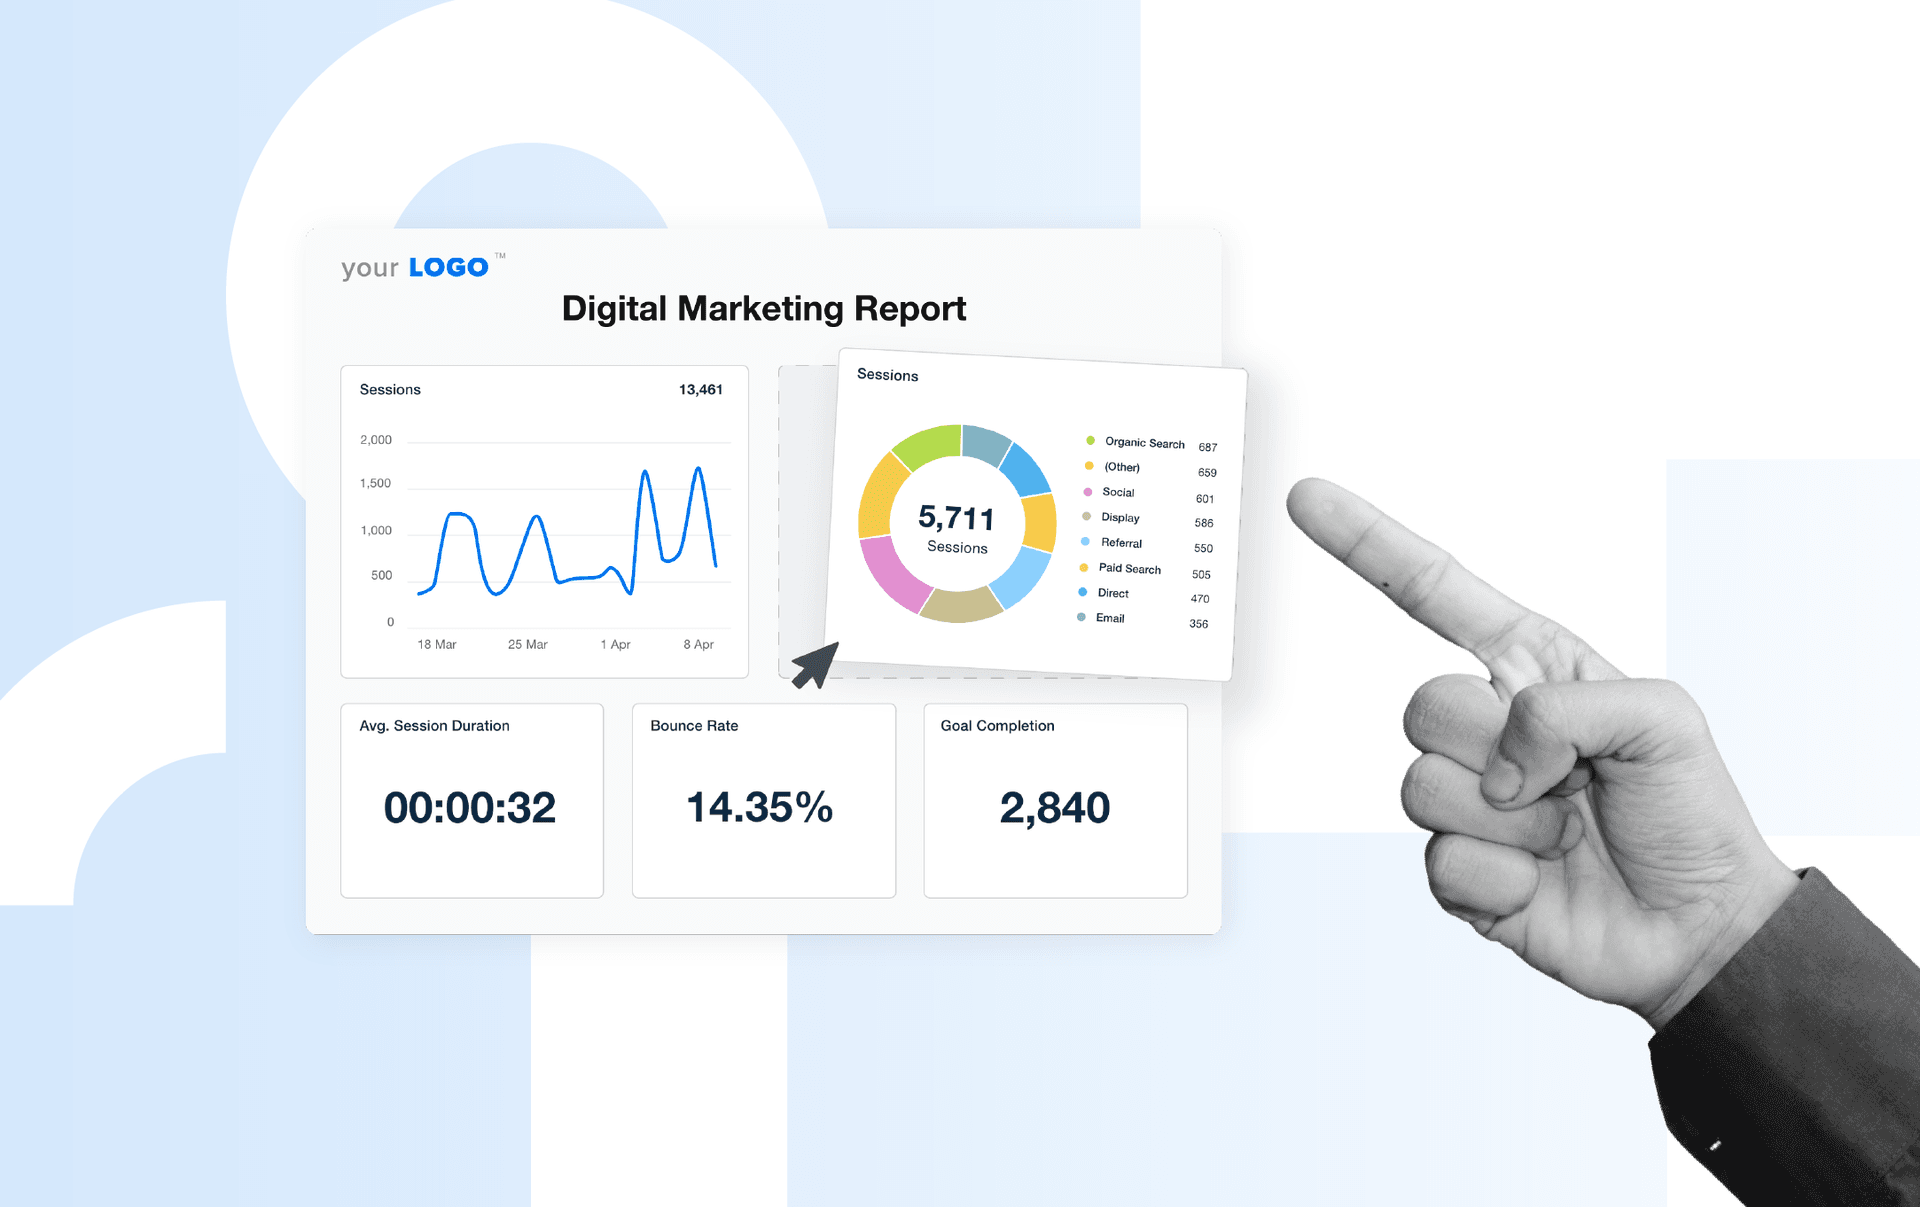
Instead of relying solely on copy, agencies are visually backing up their service offerings. On pages for SEO, PPC, social, and analytics services, they’re adding screenshots of dashboards to show what kind of reporting clients can expect.
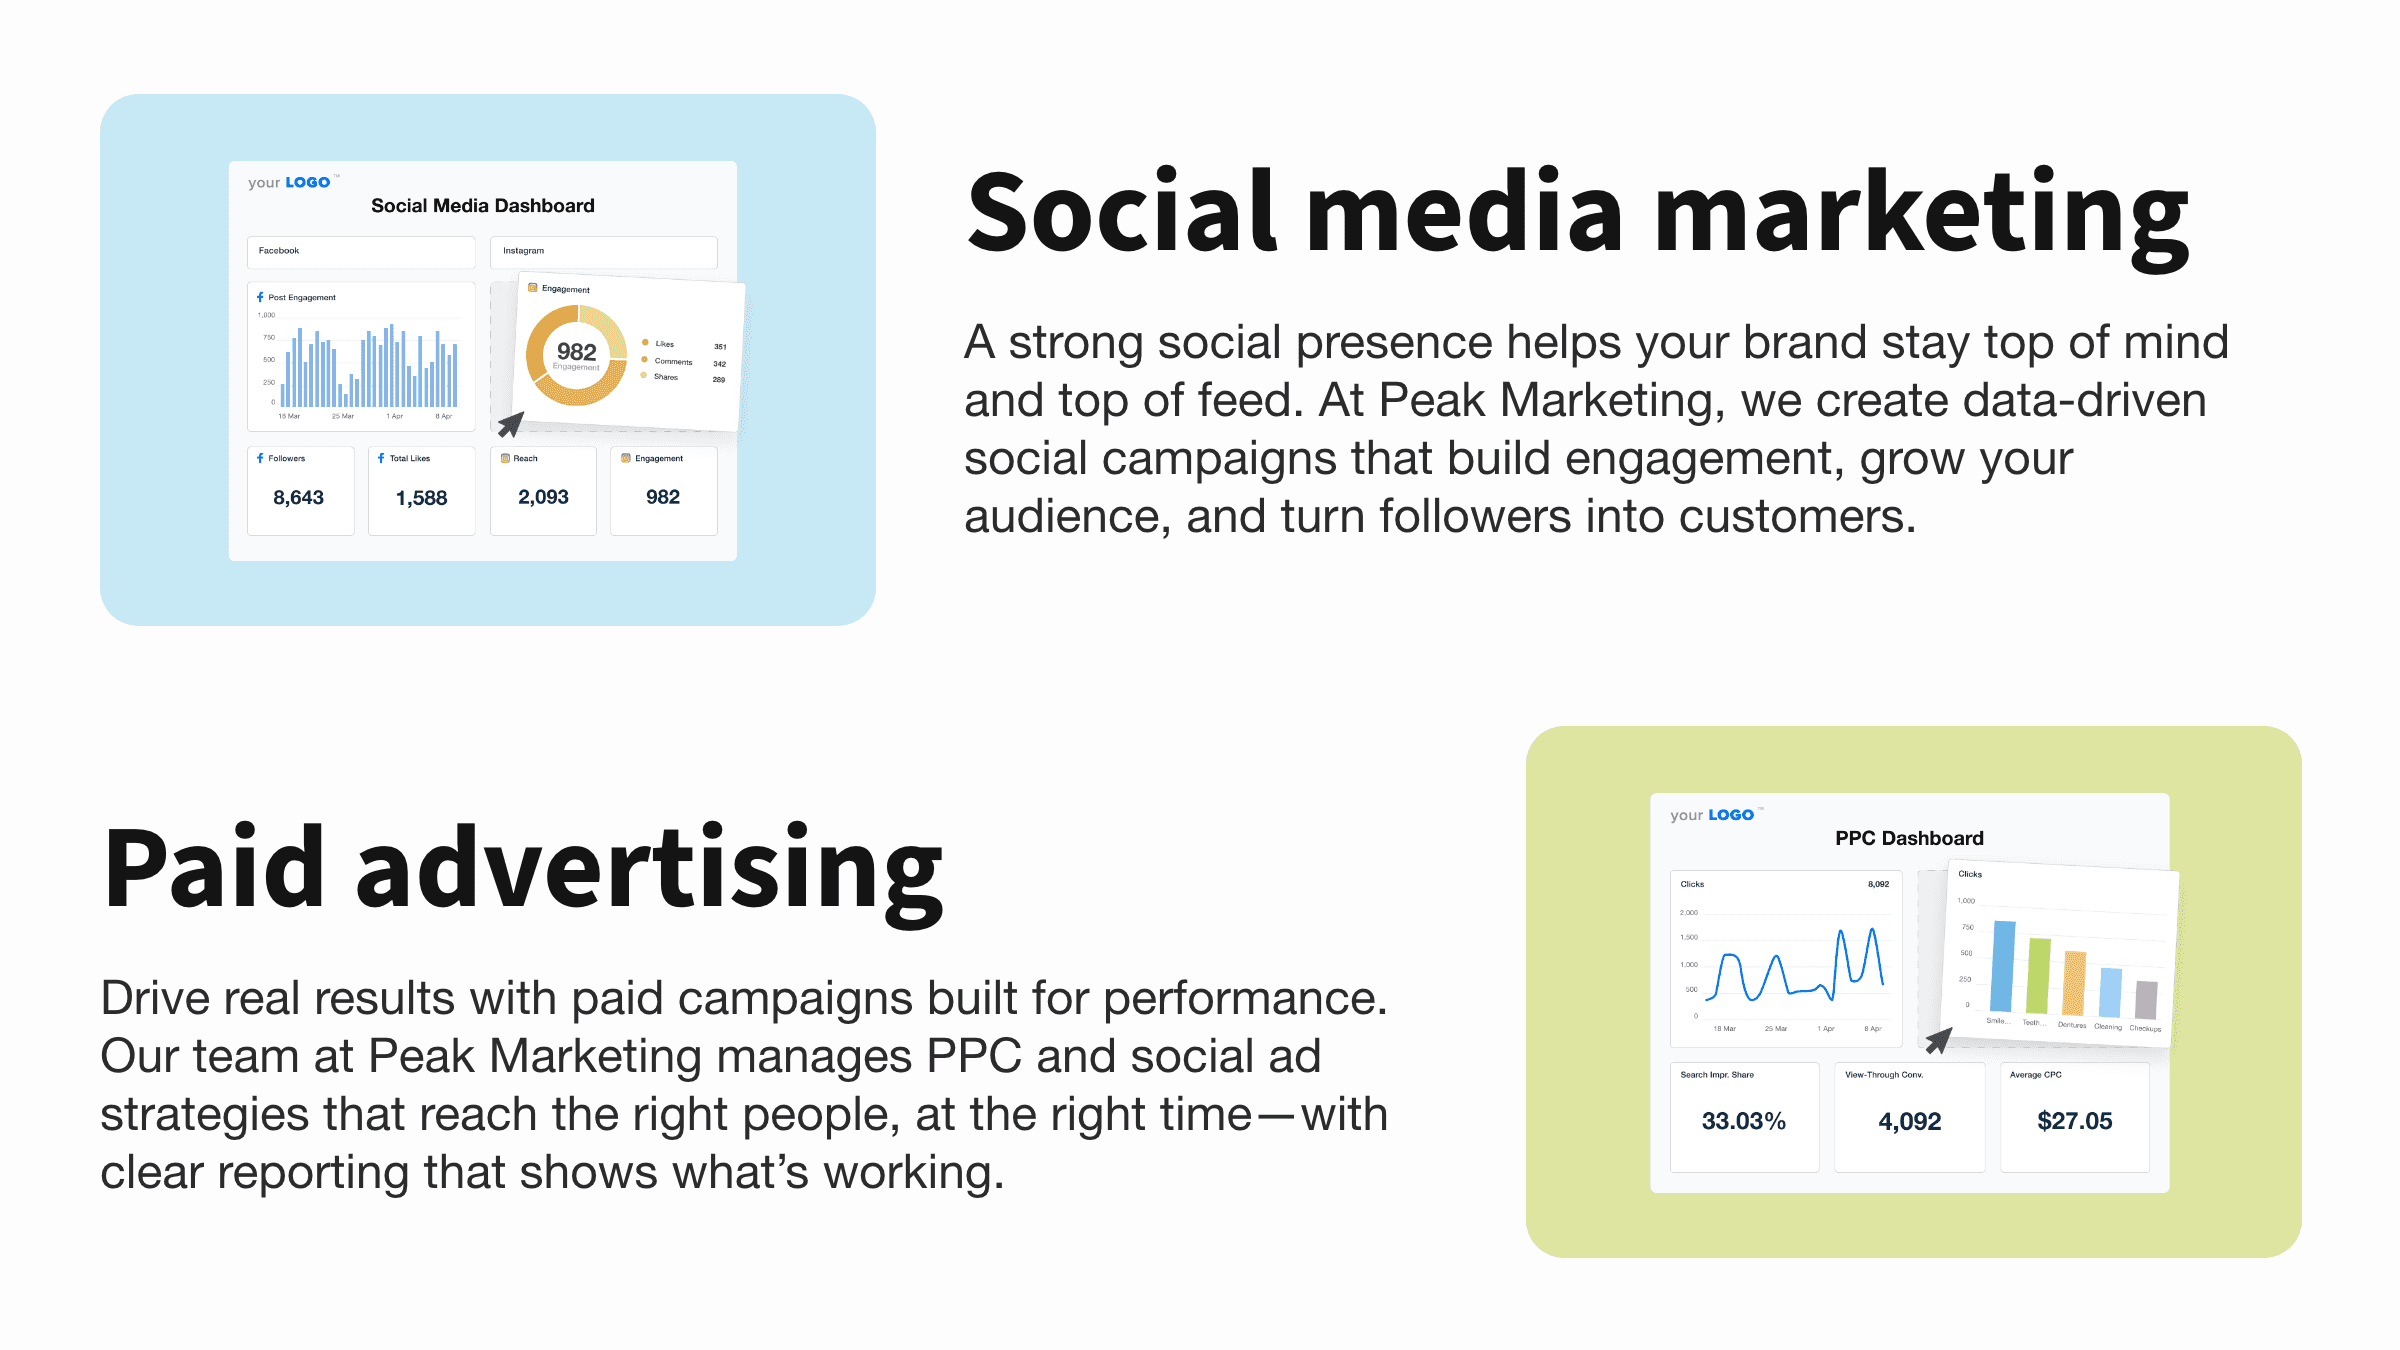
This immediately helps prospects connect the dots between the service and how success will be measured. It also reassures them that reporting isn’t an afterthought—it’s built into the process.
Pages that emphasize a data-driven approach
Some agencies dedicate entire sections of their website to the value of being data-driven. Here, reporting dashboards reinforce those claims by showing clear, consistent, and professional reporting in action.
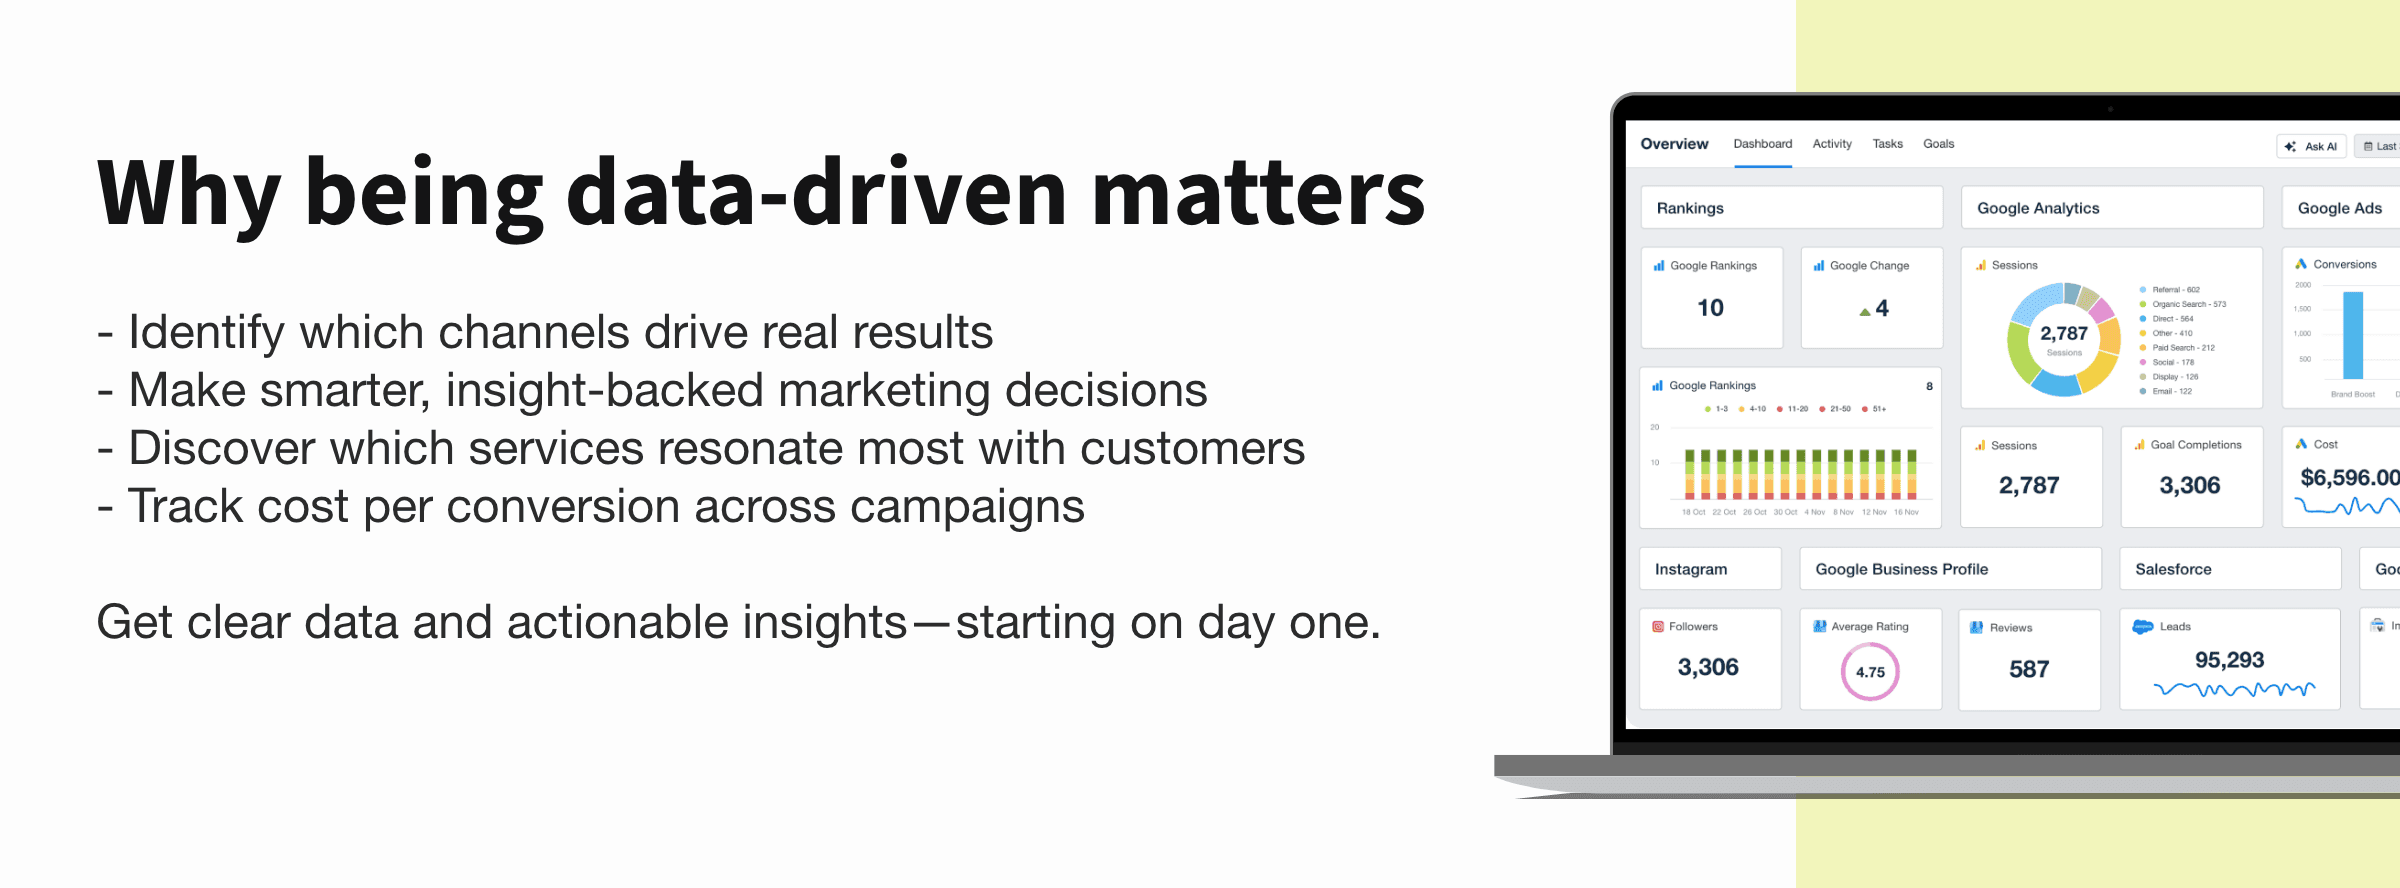
Rather than vague statements like “We’re results-oriented,” these sections illustrate what that means with visuals that show the client’s journey—from strategy to execution to measurement.
Exit or entry pop-ups that feature a dashboard preview
A few agencies are using dashboards in entry or exit-intent pop-ups to capture interest and book consultations. Instead of a generic “Let’s talk” offer, they preview what a client will see once they sign on—real data, visual clarity, and complete transparency.
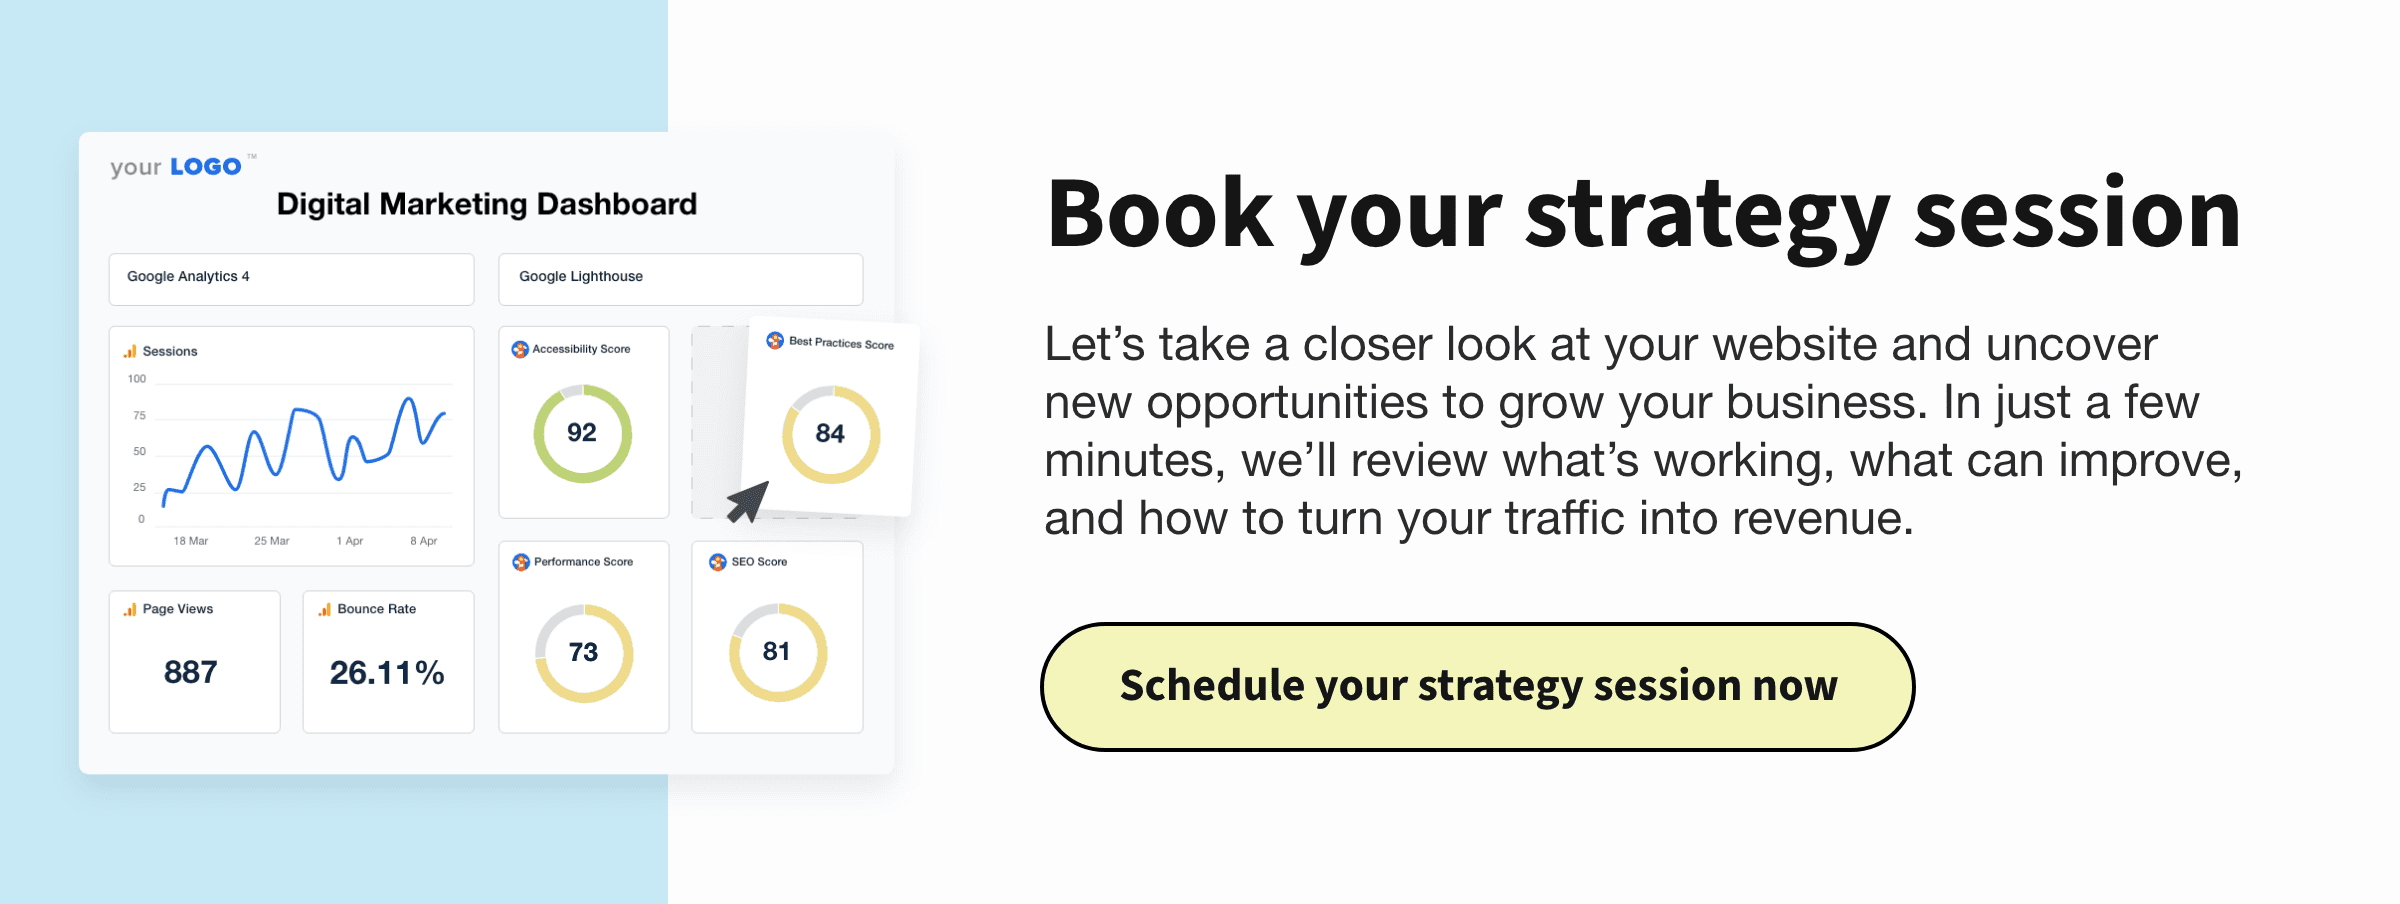
By showing a sample dashboard, they answer a key question upfront: “Will I be able to see how we’re doing?”
Blog posts that include dashboard visuals
Educational content often explores how to measure performance or what metrics to watch. Agencies enhance that content by embedding real dashboard visuals to make the advice feel more actionable and grounded.
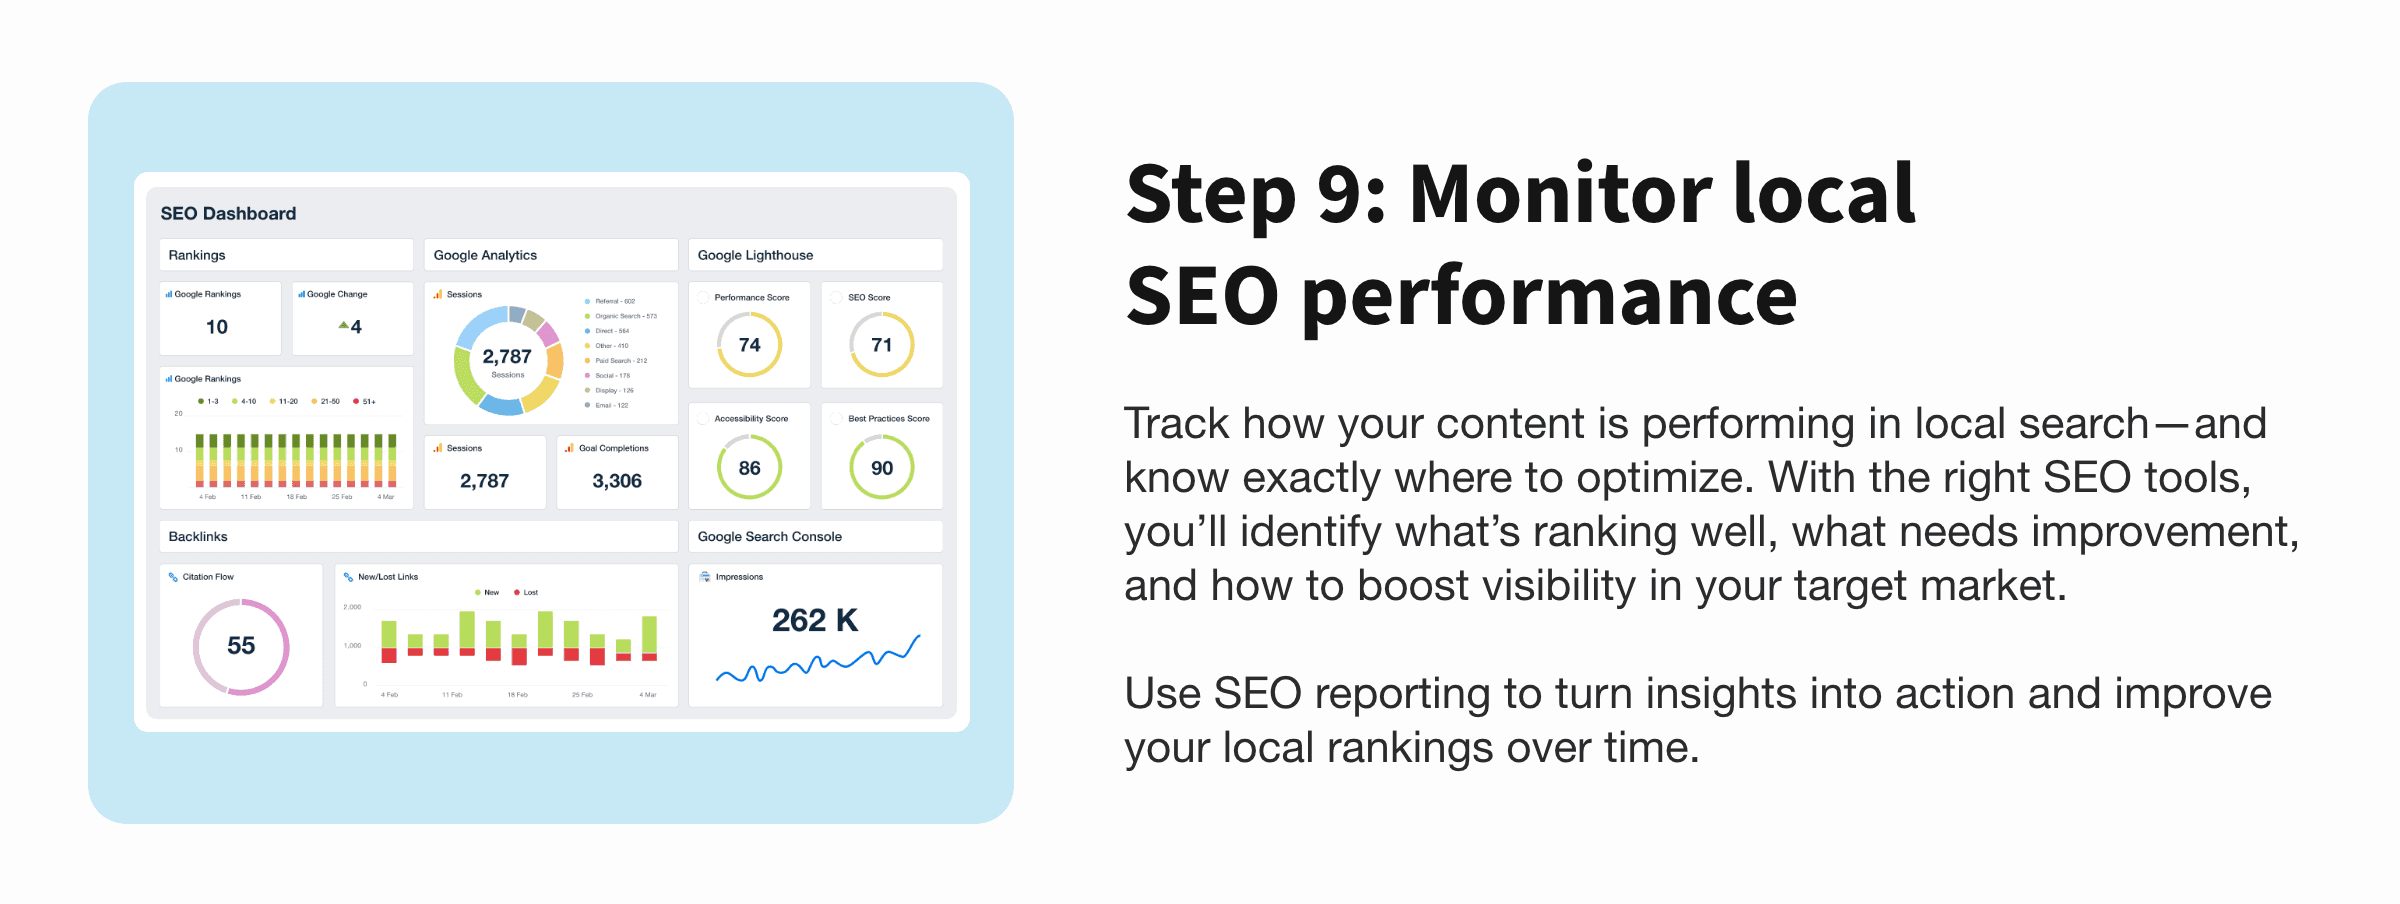
It also serves as a subtle proof point—readers see the agency’s approach to reporting and get a preview of what it would be like to work with them.
Case studies that showcase results visually
Rather than explaining outcomes with lengthy paragraphs of text, many agencies include dashboard snapshots in their case studies. It helps illustrate the performance story—before and after—without relying entirely on copy.
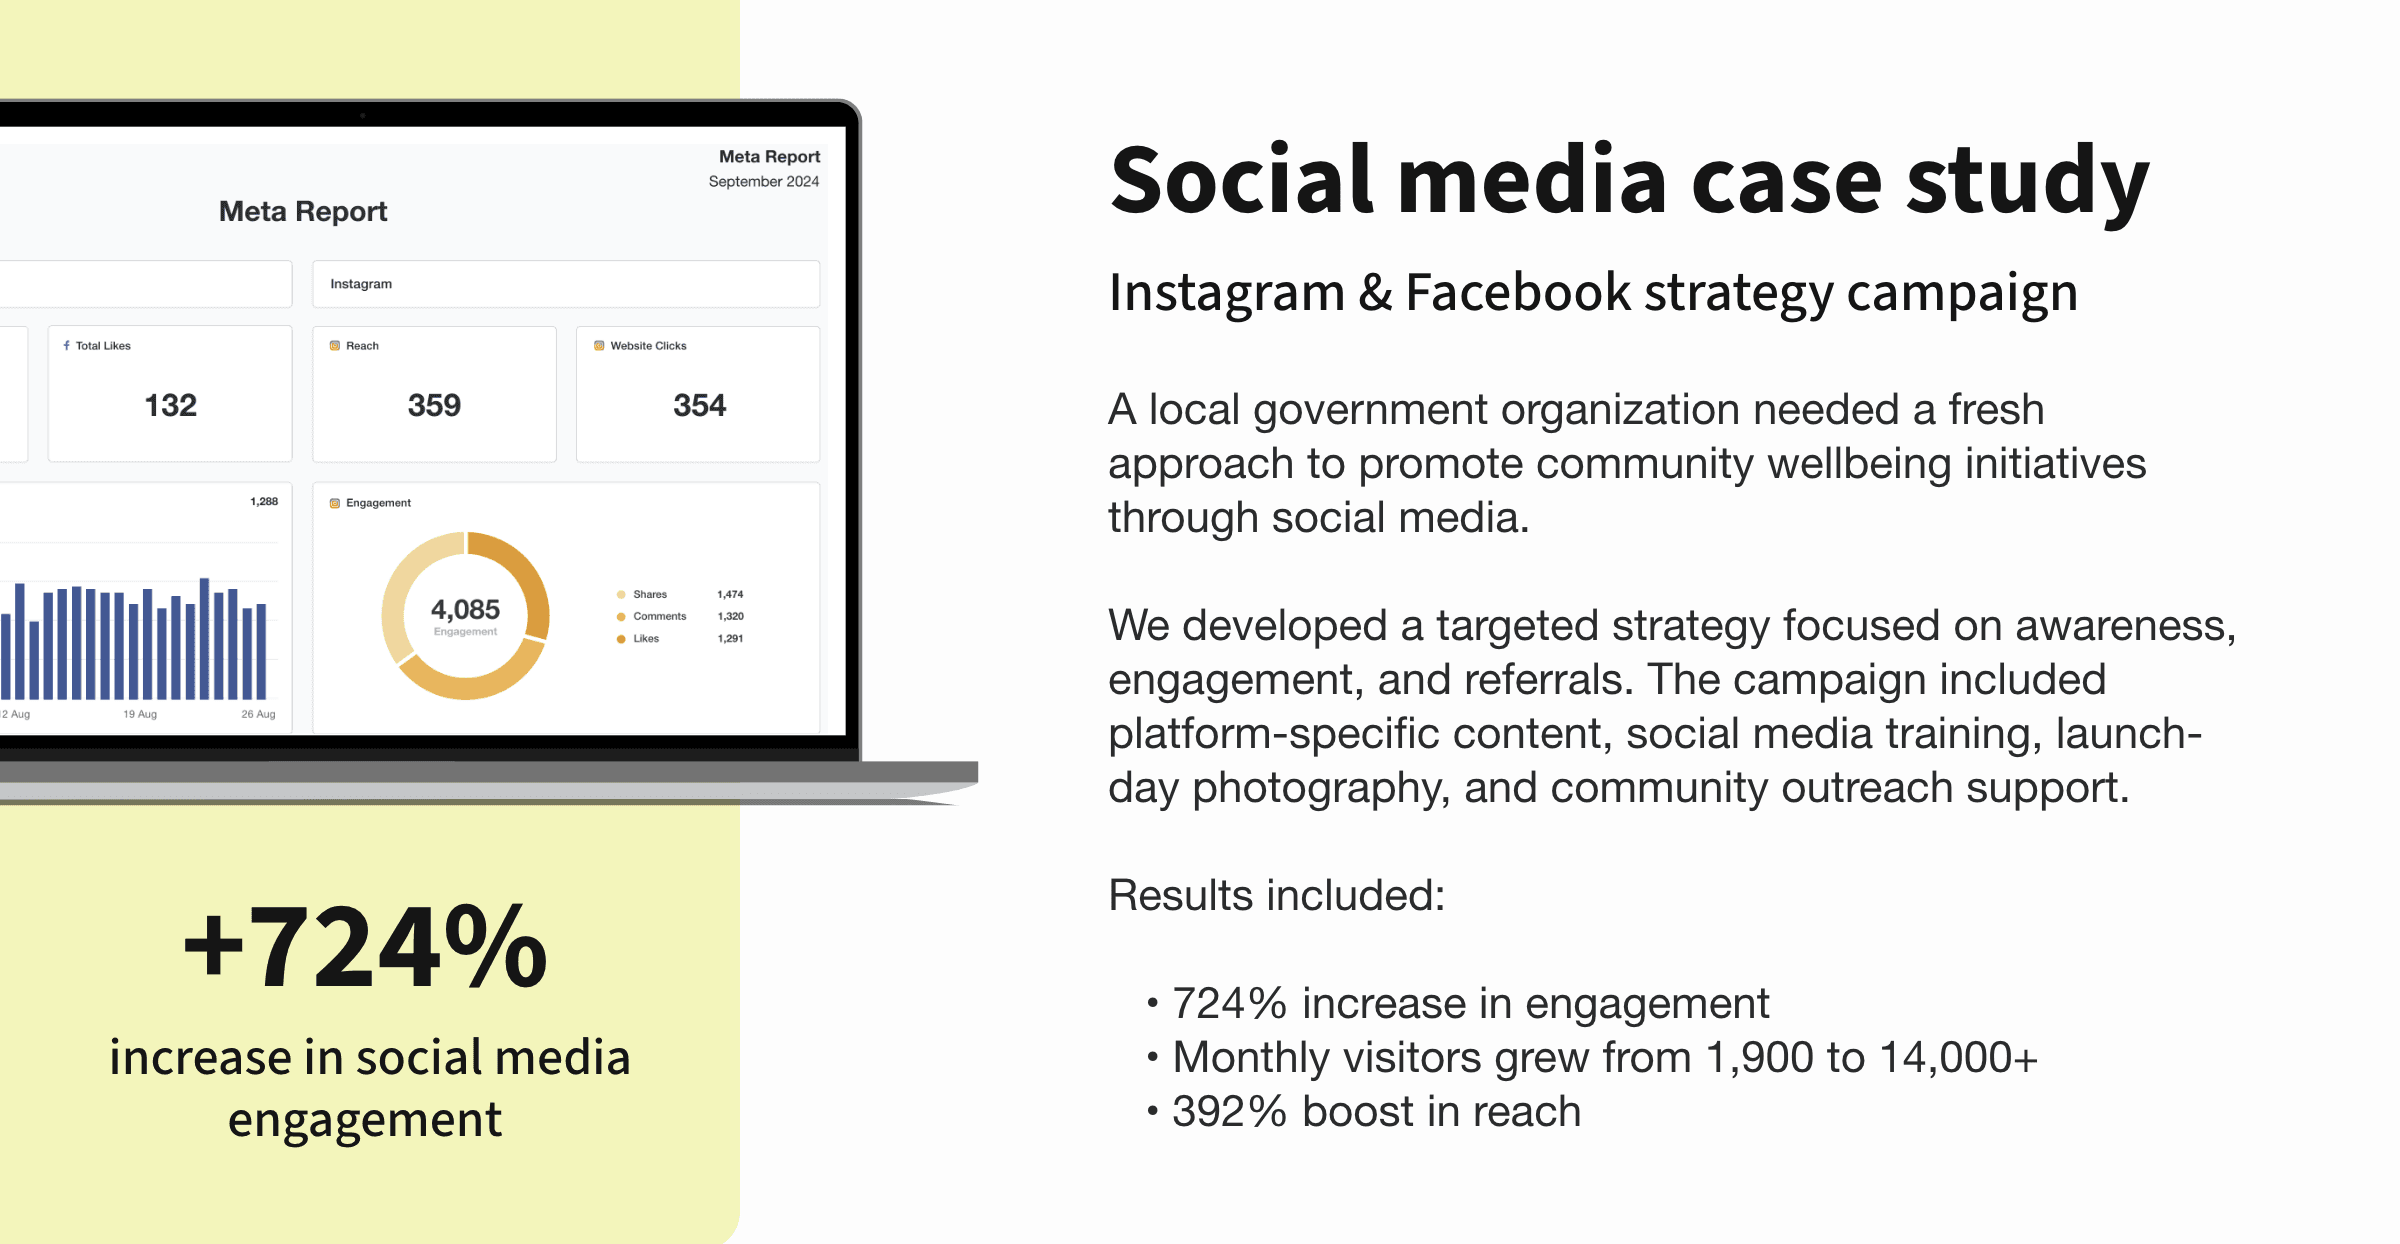
This type of visual storytelling builds trust faster. It shows potential clients exactly how performance is tracked and communicated.
Using reporting expertise to seal the deal
In new business pitches, what’s shown is often more persuasive than what’s said.
Agencies are increasingly using real client reporting visuals in proposals, pitch decks, and discovery calls. Why? Because prospects want to know three things:
What results can you drive?
How will you communicate progress?
Will I have visibility into what’s going on?
Branded dashboard examples answer all three—visually, clearly, and in a way that builds immediate confidence.
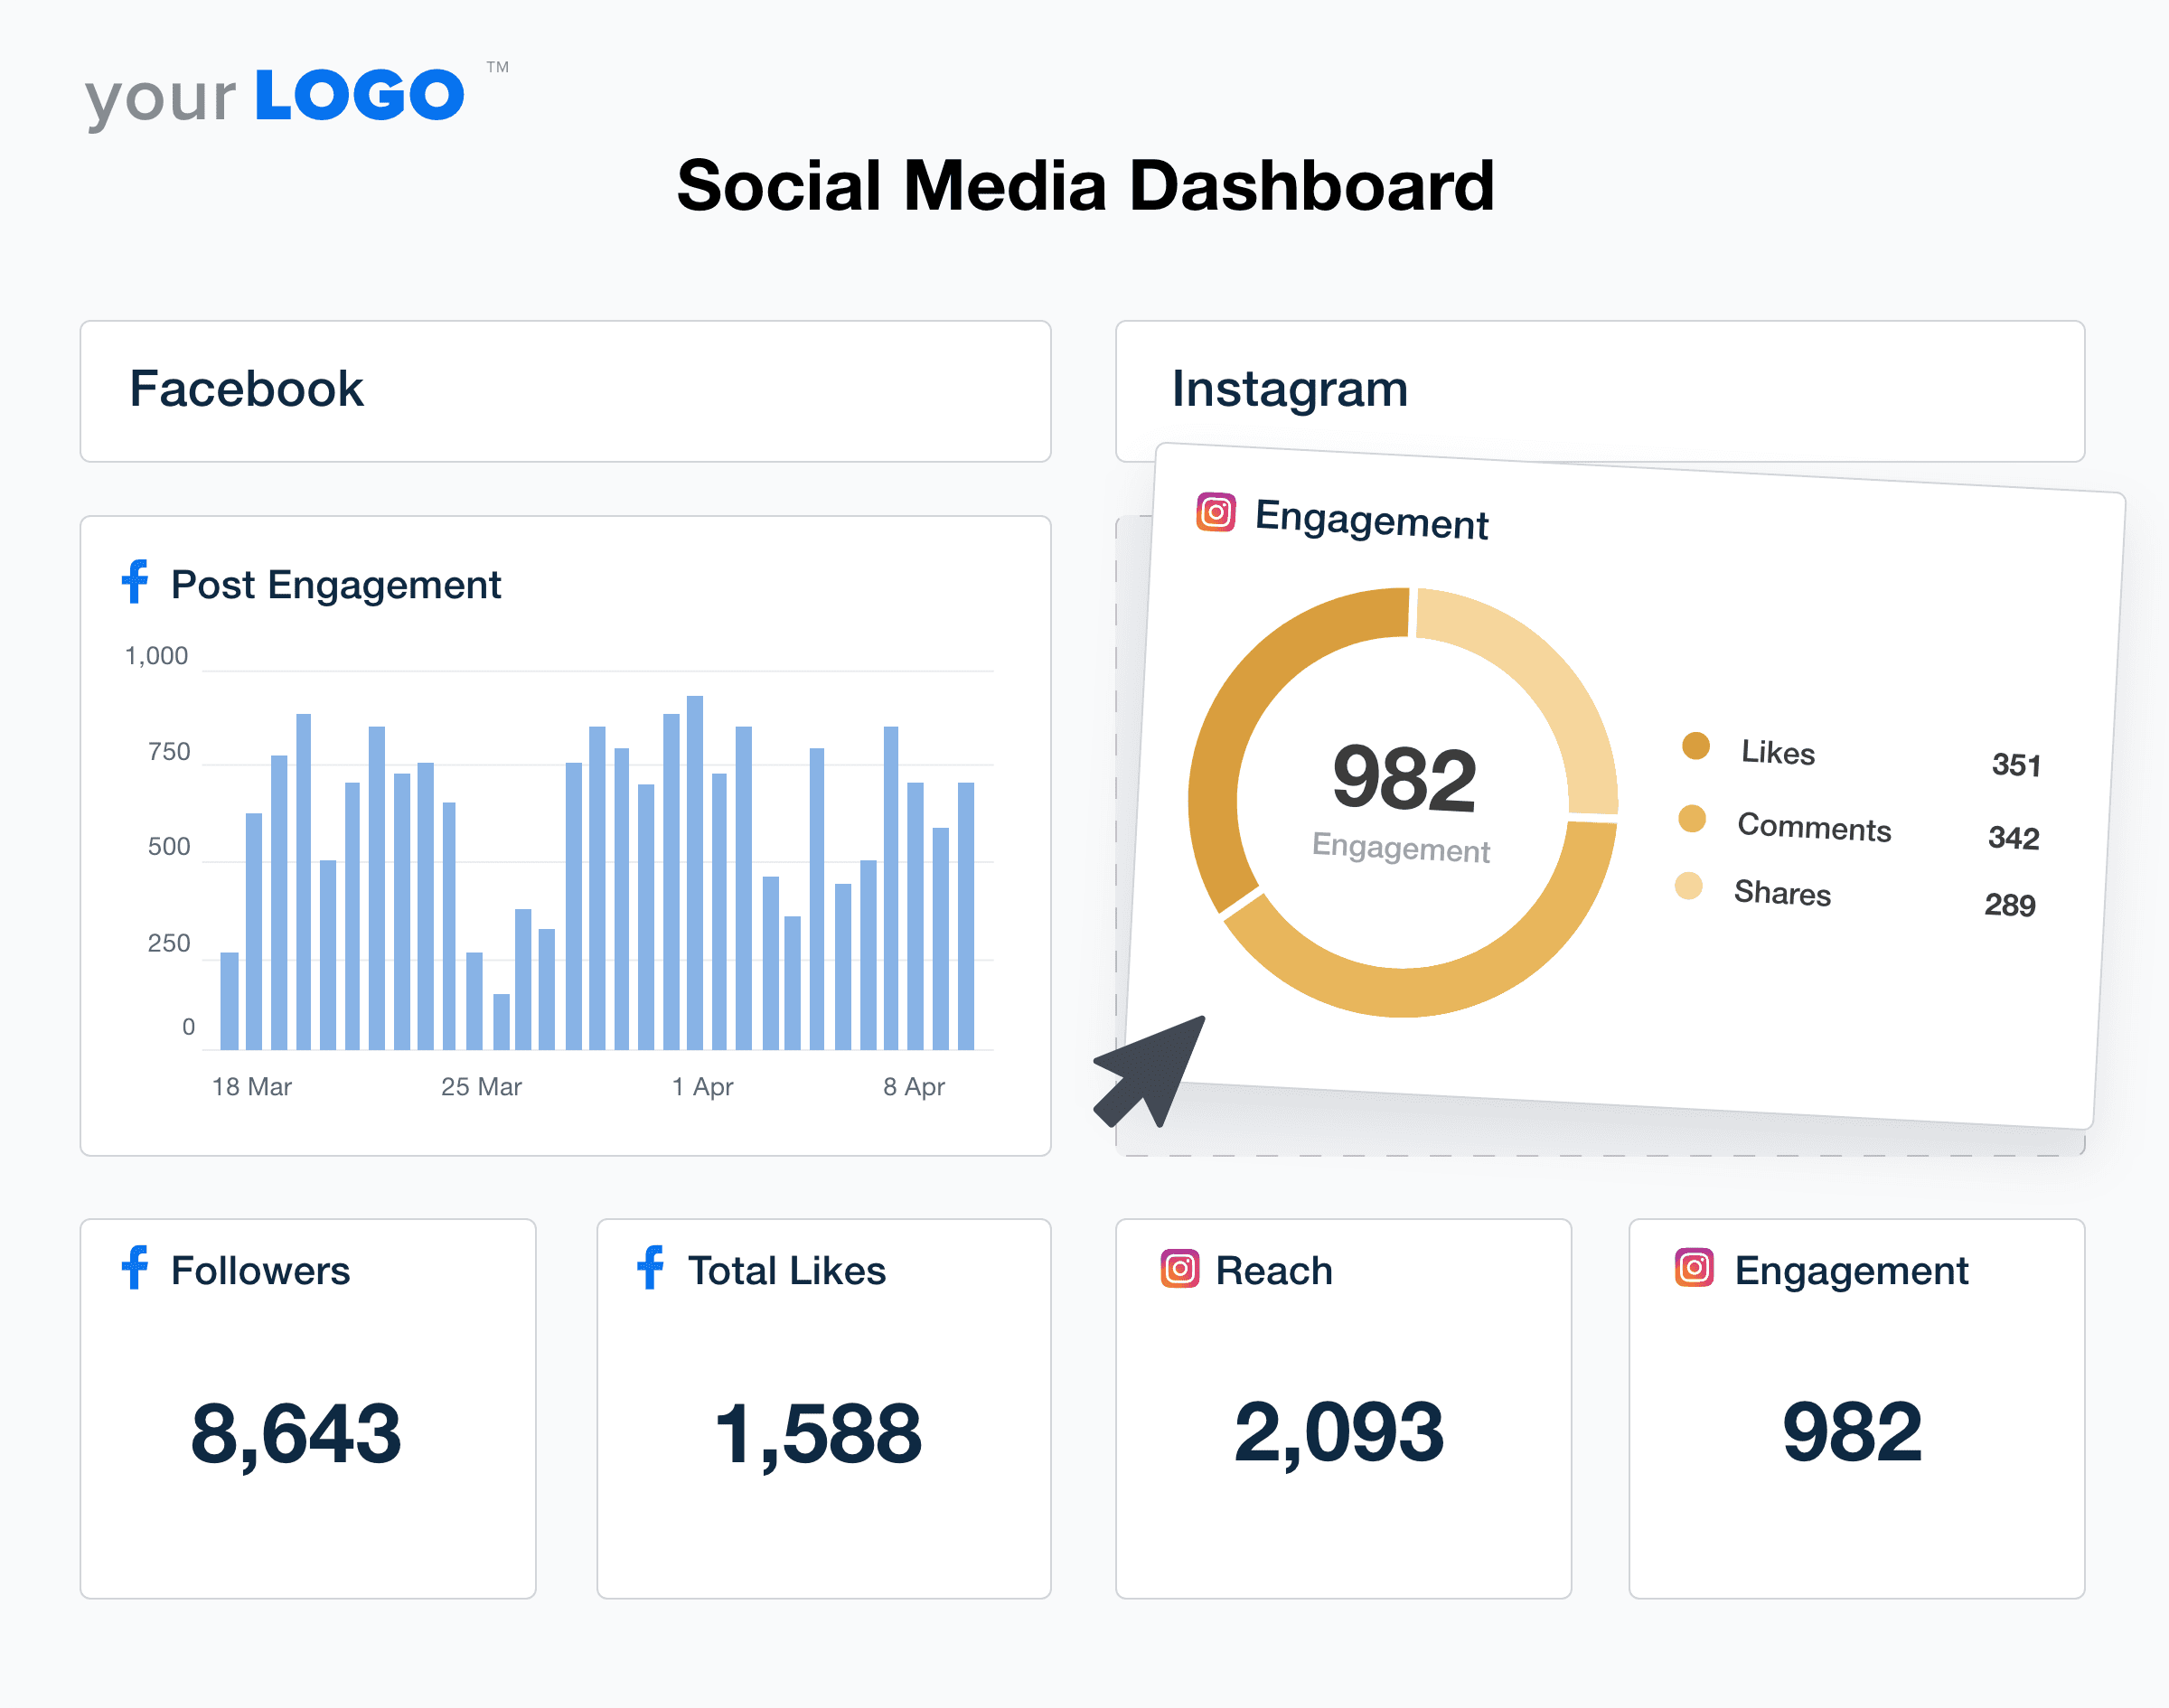
In pitch decks
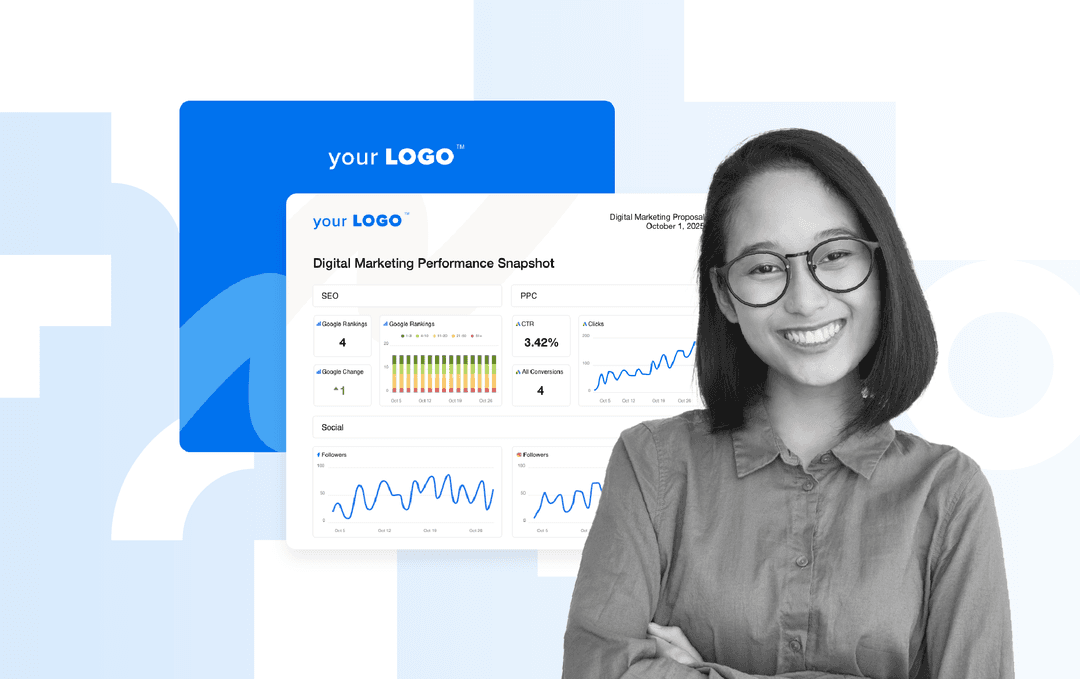
Dropping a dashboard into your deck isn’t just about aesthetics—it’s about setting expectations. Agencies use these visuals to show how they track KPIs across SEO, PPC, social, and more. Instead of just promising transparency, they’re proving it.
Potential clients love seeing screenshots and demos of the marketing dashboard. Our clients have even bragged about our dashboards so much that another vendor reached out to ask how we built them!
Adam Palmer, President, Inertia Digital Marketing
A single screenshot often speaks louder than a slide full of bullet points. It demonstrates a clear process, attention to detail, and a professional client experience from day one.
In proposals and one-pagers
Some agencies include a preview of their reporting experience right in the proposal document. This could be a full-page dashboard image or a side-by-side comparison showing what clients receive vs. the industry average.
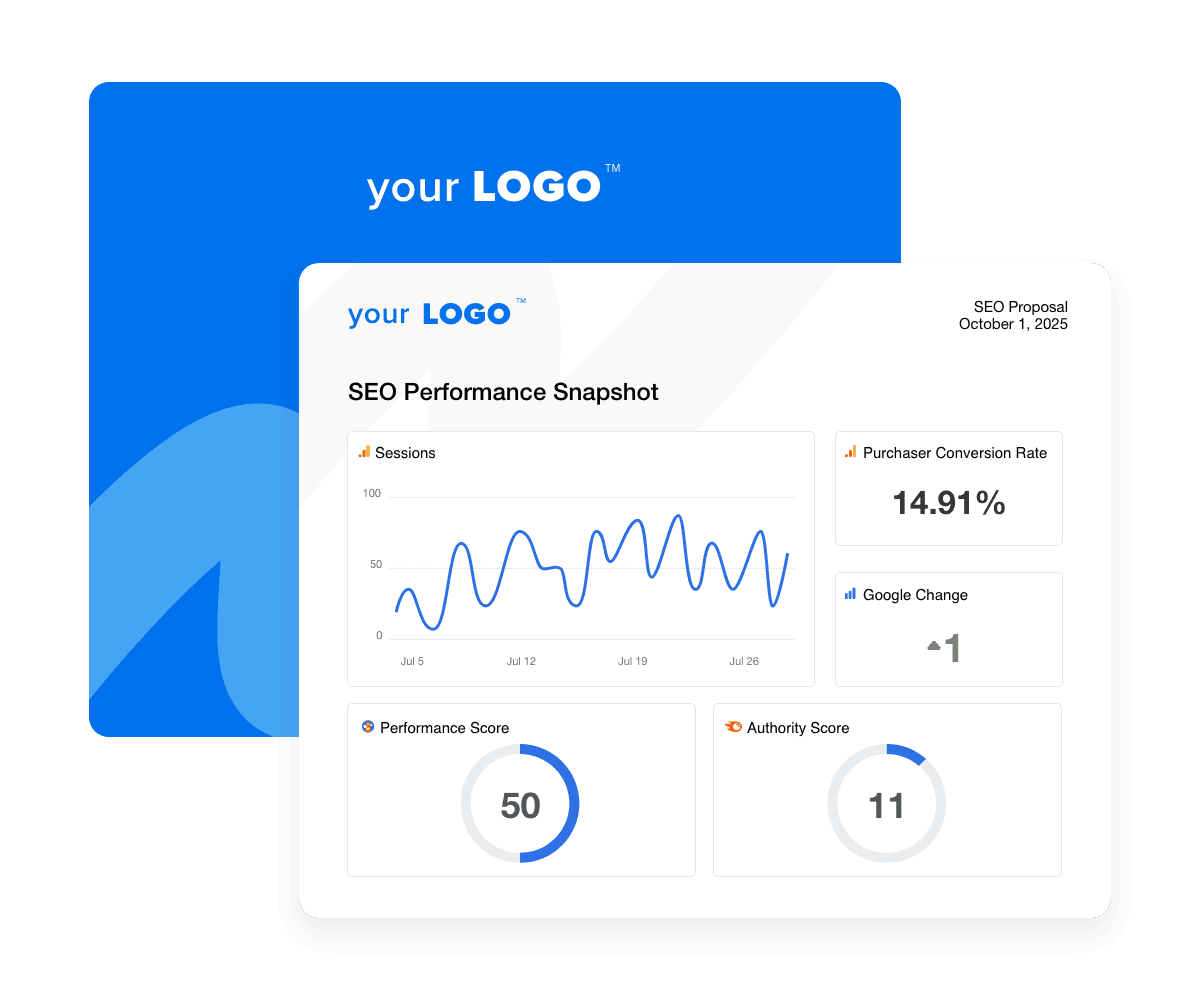
Including visuals here helps reduce friction. It removes uncertainty and makes it easier for decision-makers to imagine what it will be like to work with your agency.
In discovery and prospect meetings
Agencies are also screen-sharing live dashboards or example reports during their meetings with potential clients. This creates an immediate impression: you’re organized, data-focused, and client-first.
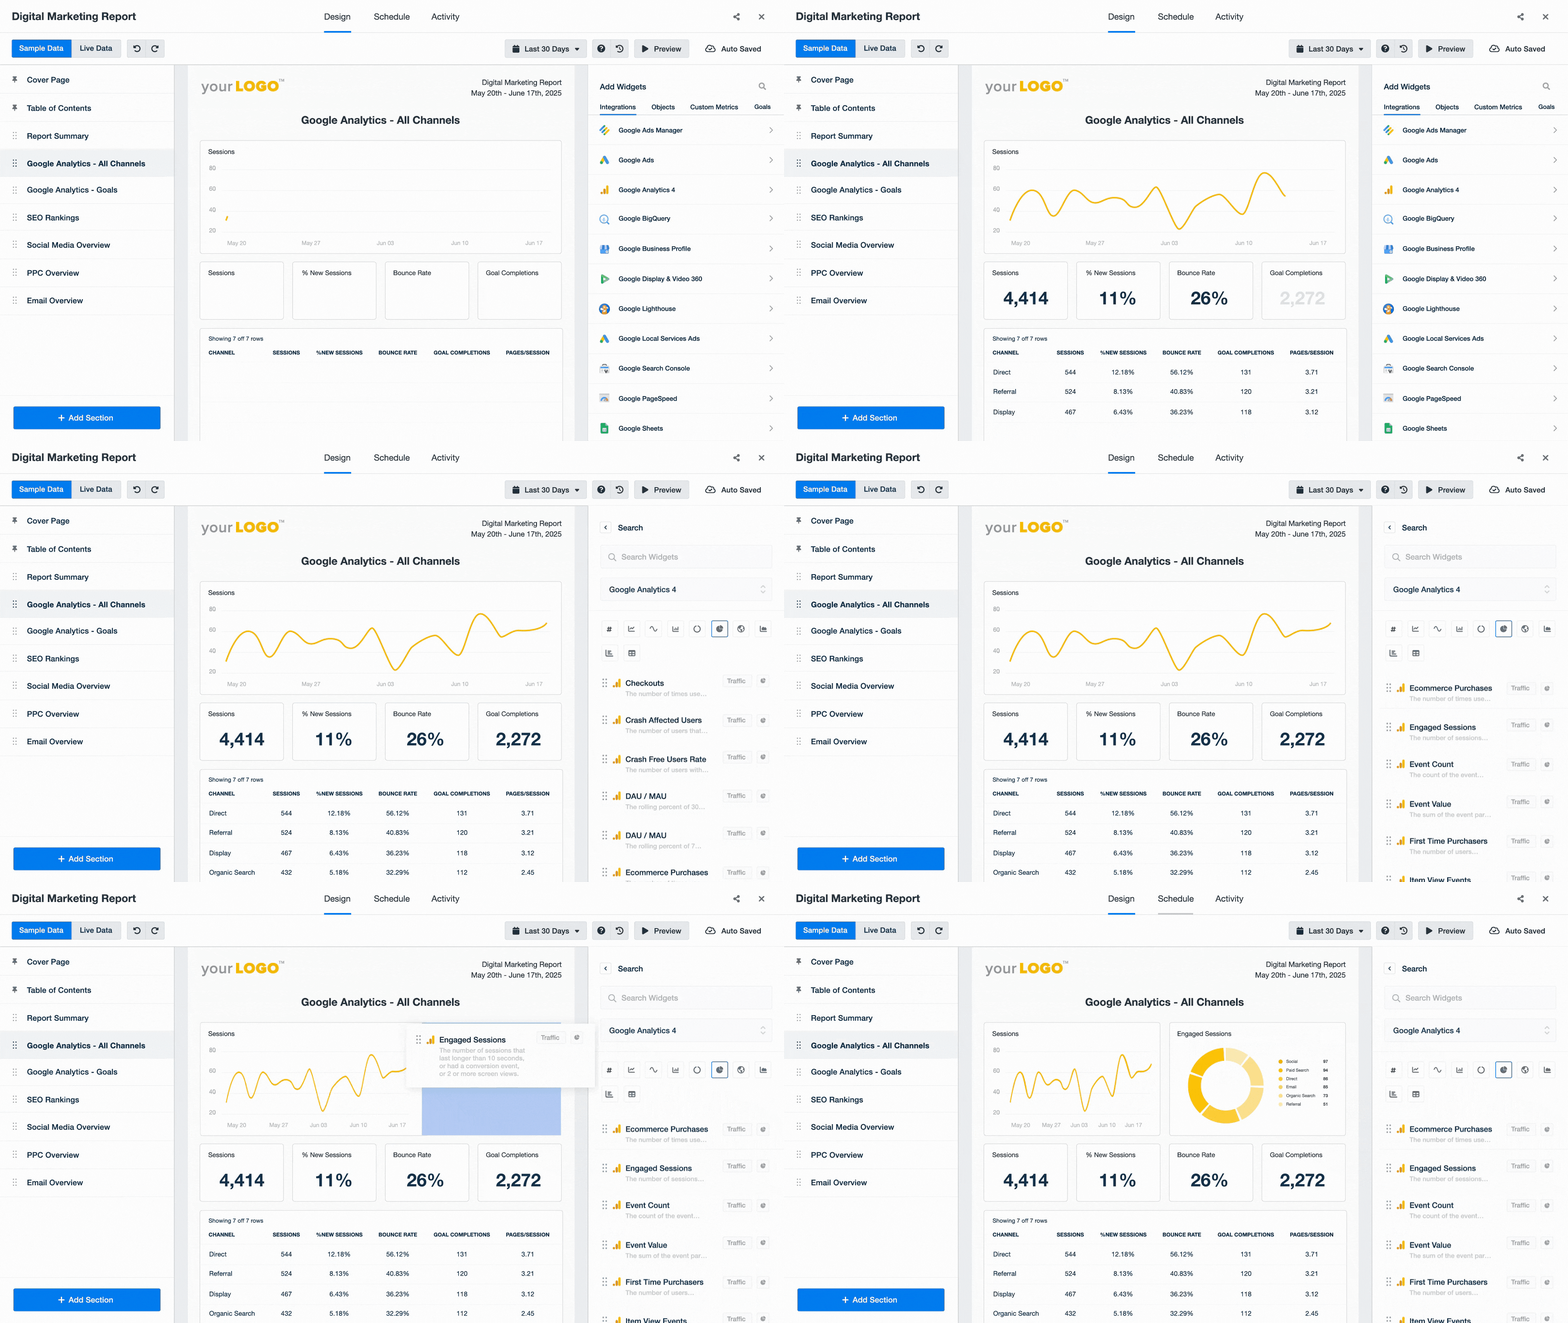
Rather than showing slides filled with claims, they walk prospects through precisely how results will be tracked and reported. It builds credibility and gives the agency a strong visual edge over competitors who stick to generic sales talk.
When we pull up an AgencyAnalytics dashboard during a sales pitch, 100% of our leads immediately see the value that this reporting can bring to their business. It helps us seal the deal several times per month.
Graham Lumley, Director of Marketing, Blackhawk Digital Marketing
When reporting is baked into your pitch, it’s not just a backend process—it becomes a selling point.
How to make your reporting a differentiator (quick tips)
If your agency is already producing great work, your reporting should show it—clearly, consistently, and in a way that reflects your brand.
Here are a few ways to turn your client reports into a standout feature of your agency’s experience.
Brand your dashboards
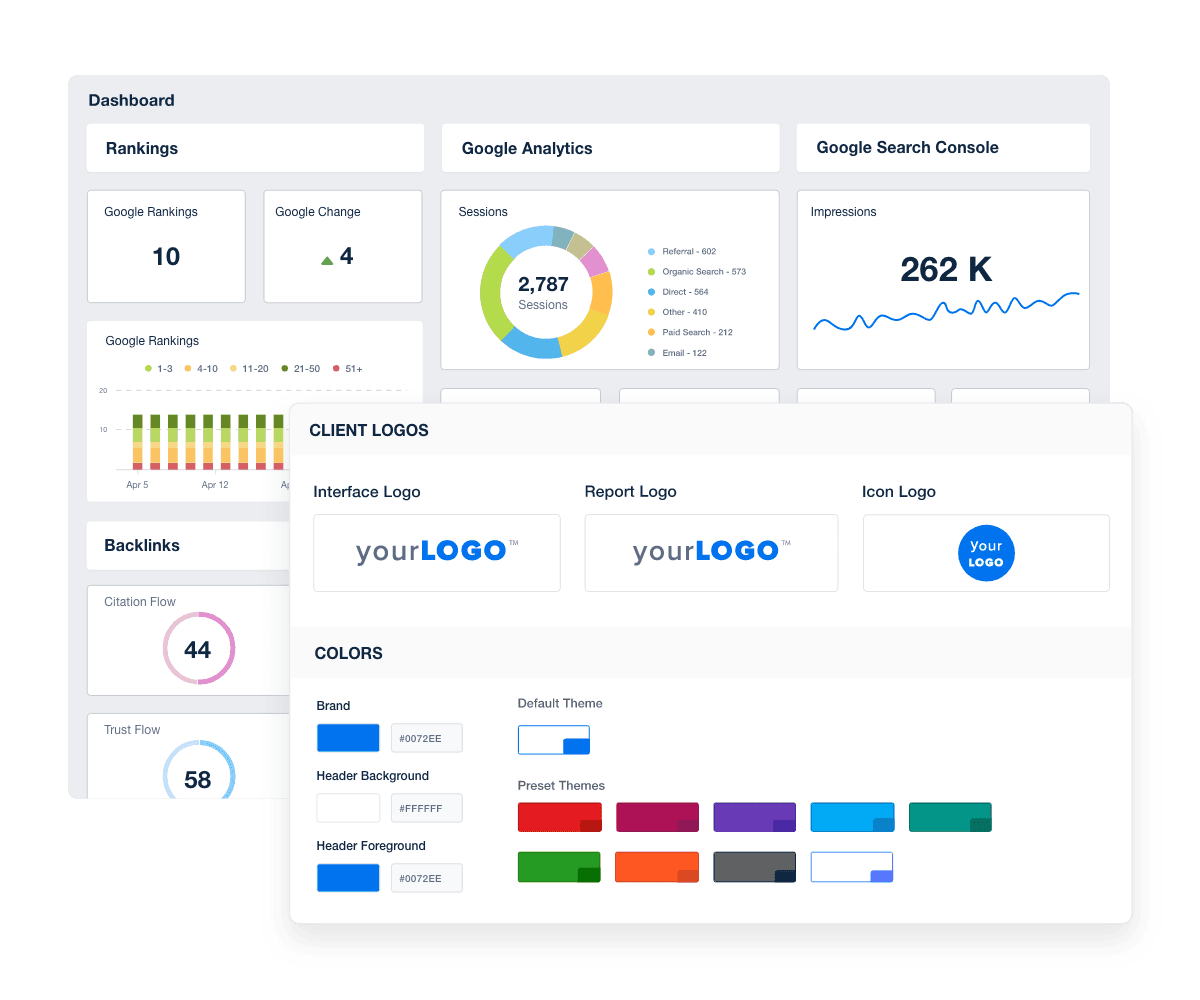
Add your agency’s logo, color palette, and design touches to make white label reports feel like an extension of your brand—not a generic software tool. A polished, white labeled dashboard sends the message: we’re organized, and we’ve got this covered.
Show what matters to clients
The best reports don’t overwhelm with data—they focus on the KPIs your clients care about most. Customize dashboards and utilize custom metrics to highlight performance indicators that directly tie back to business goals, rather than focusing on vanity metrics.
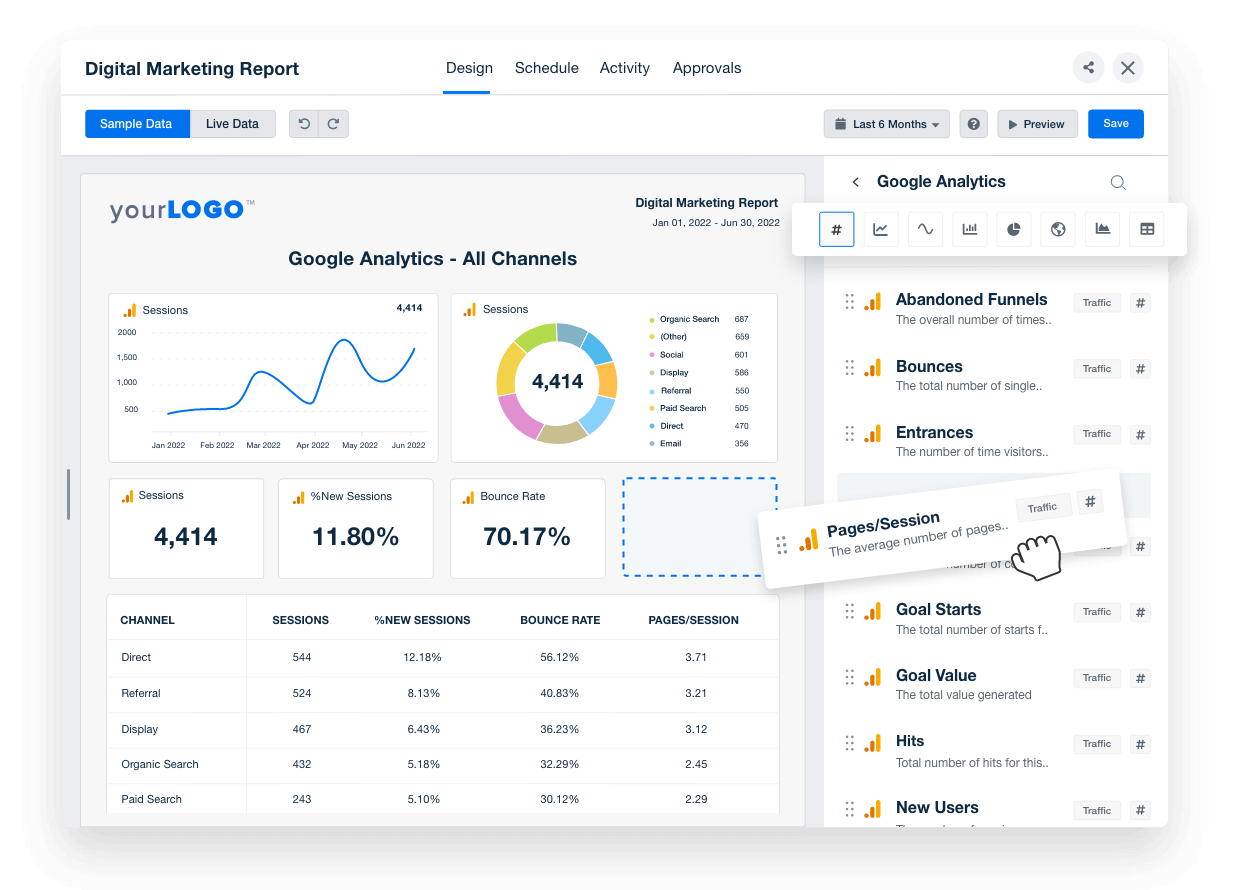
This shows clients you understand what success looks like for them—and you’re tracking it.
Build it into your onboarding process
Set the tone early. Show new clients what their reporting experience will look like in the very first week. Some agencies even include a walkthrough of their dashboard during new client onboarding calls.
Walk them through the first report! Especially if you are working with contacts that don’t have a marketing background. We might know what CPC, CPM, etc. means, but they perhaps don’t. Tell them why you picked specific subjects to show on their monthly report and what numbers are ‘good’ or ‘bad’. This way, you show them the value of the report.
Nico de Jong, CEO, Forward Marketing
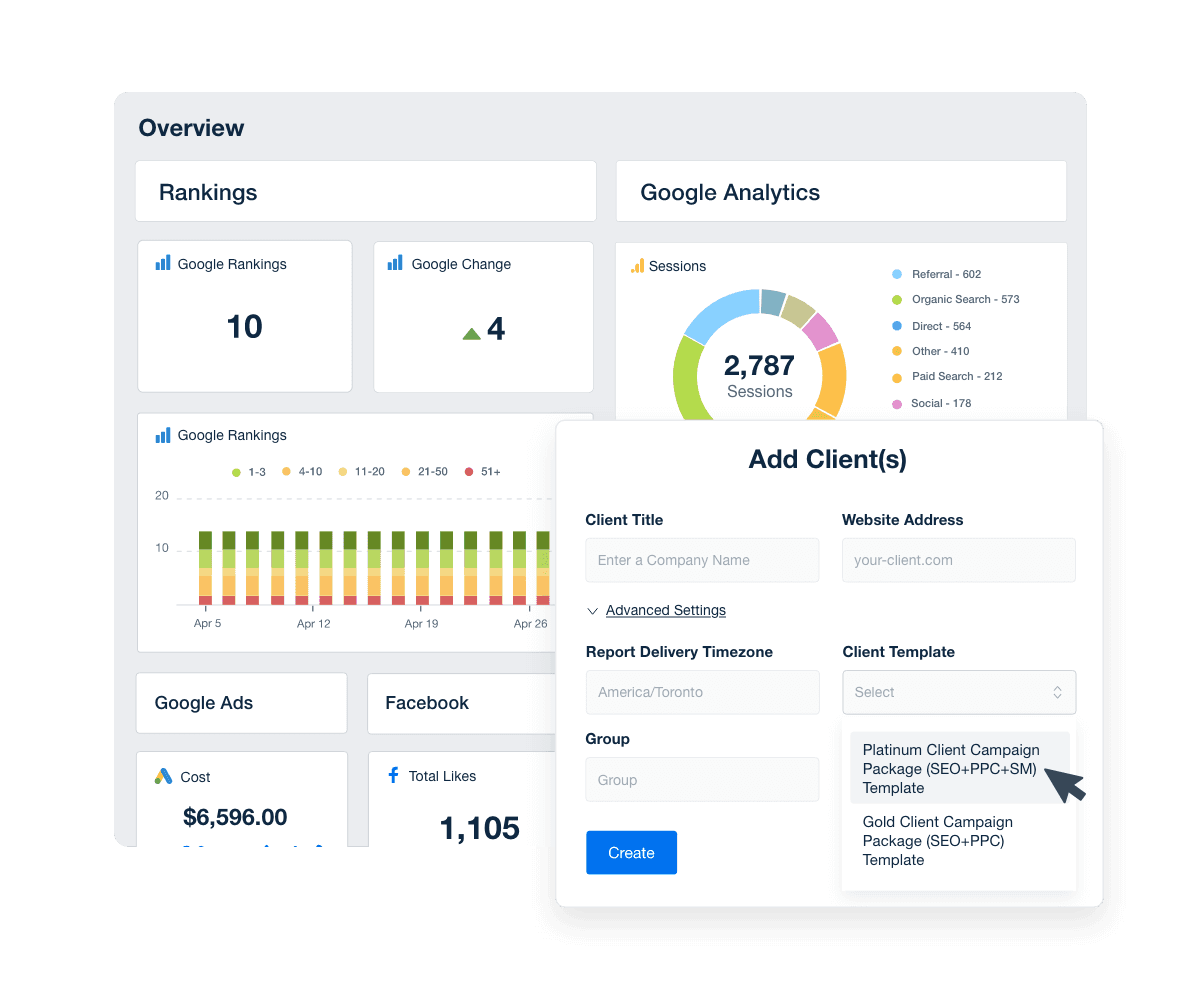
This builds confidence right away and reduces client questions later on.
Use reports in your monthly check-ins
Rather than simply emailing over a PDF, make your reporting part of the conversation. Use presentation mode as the visual foundation for monthly meetings or quarterly reviews.
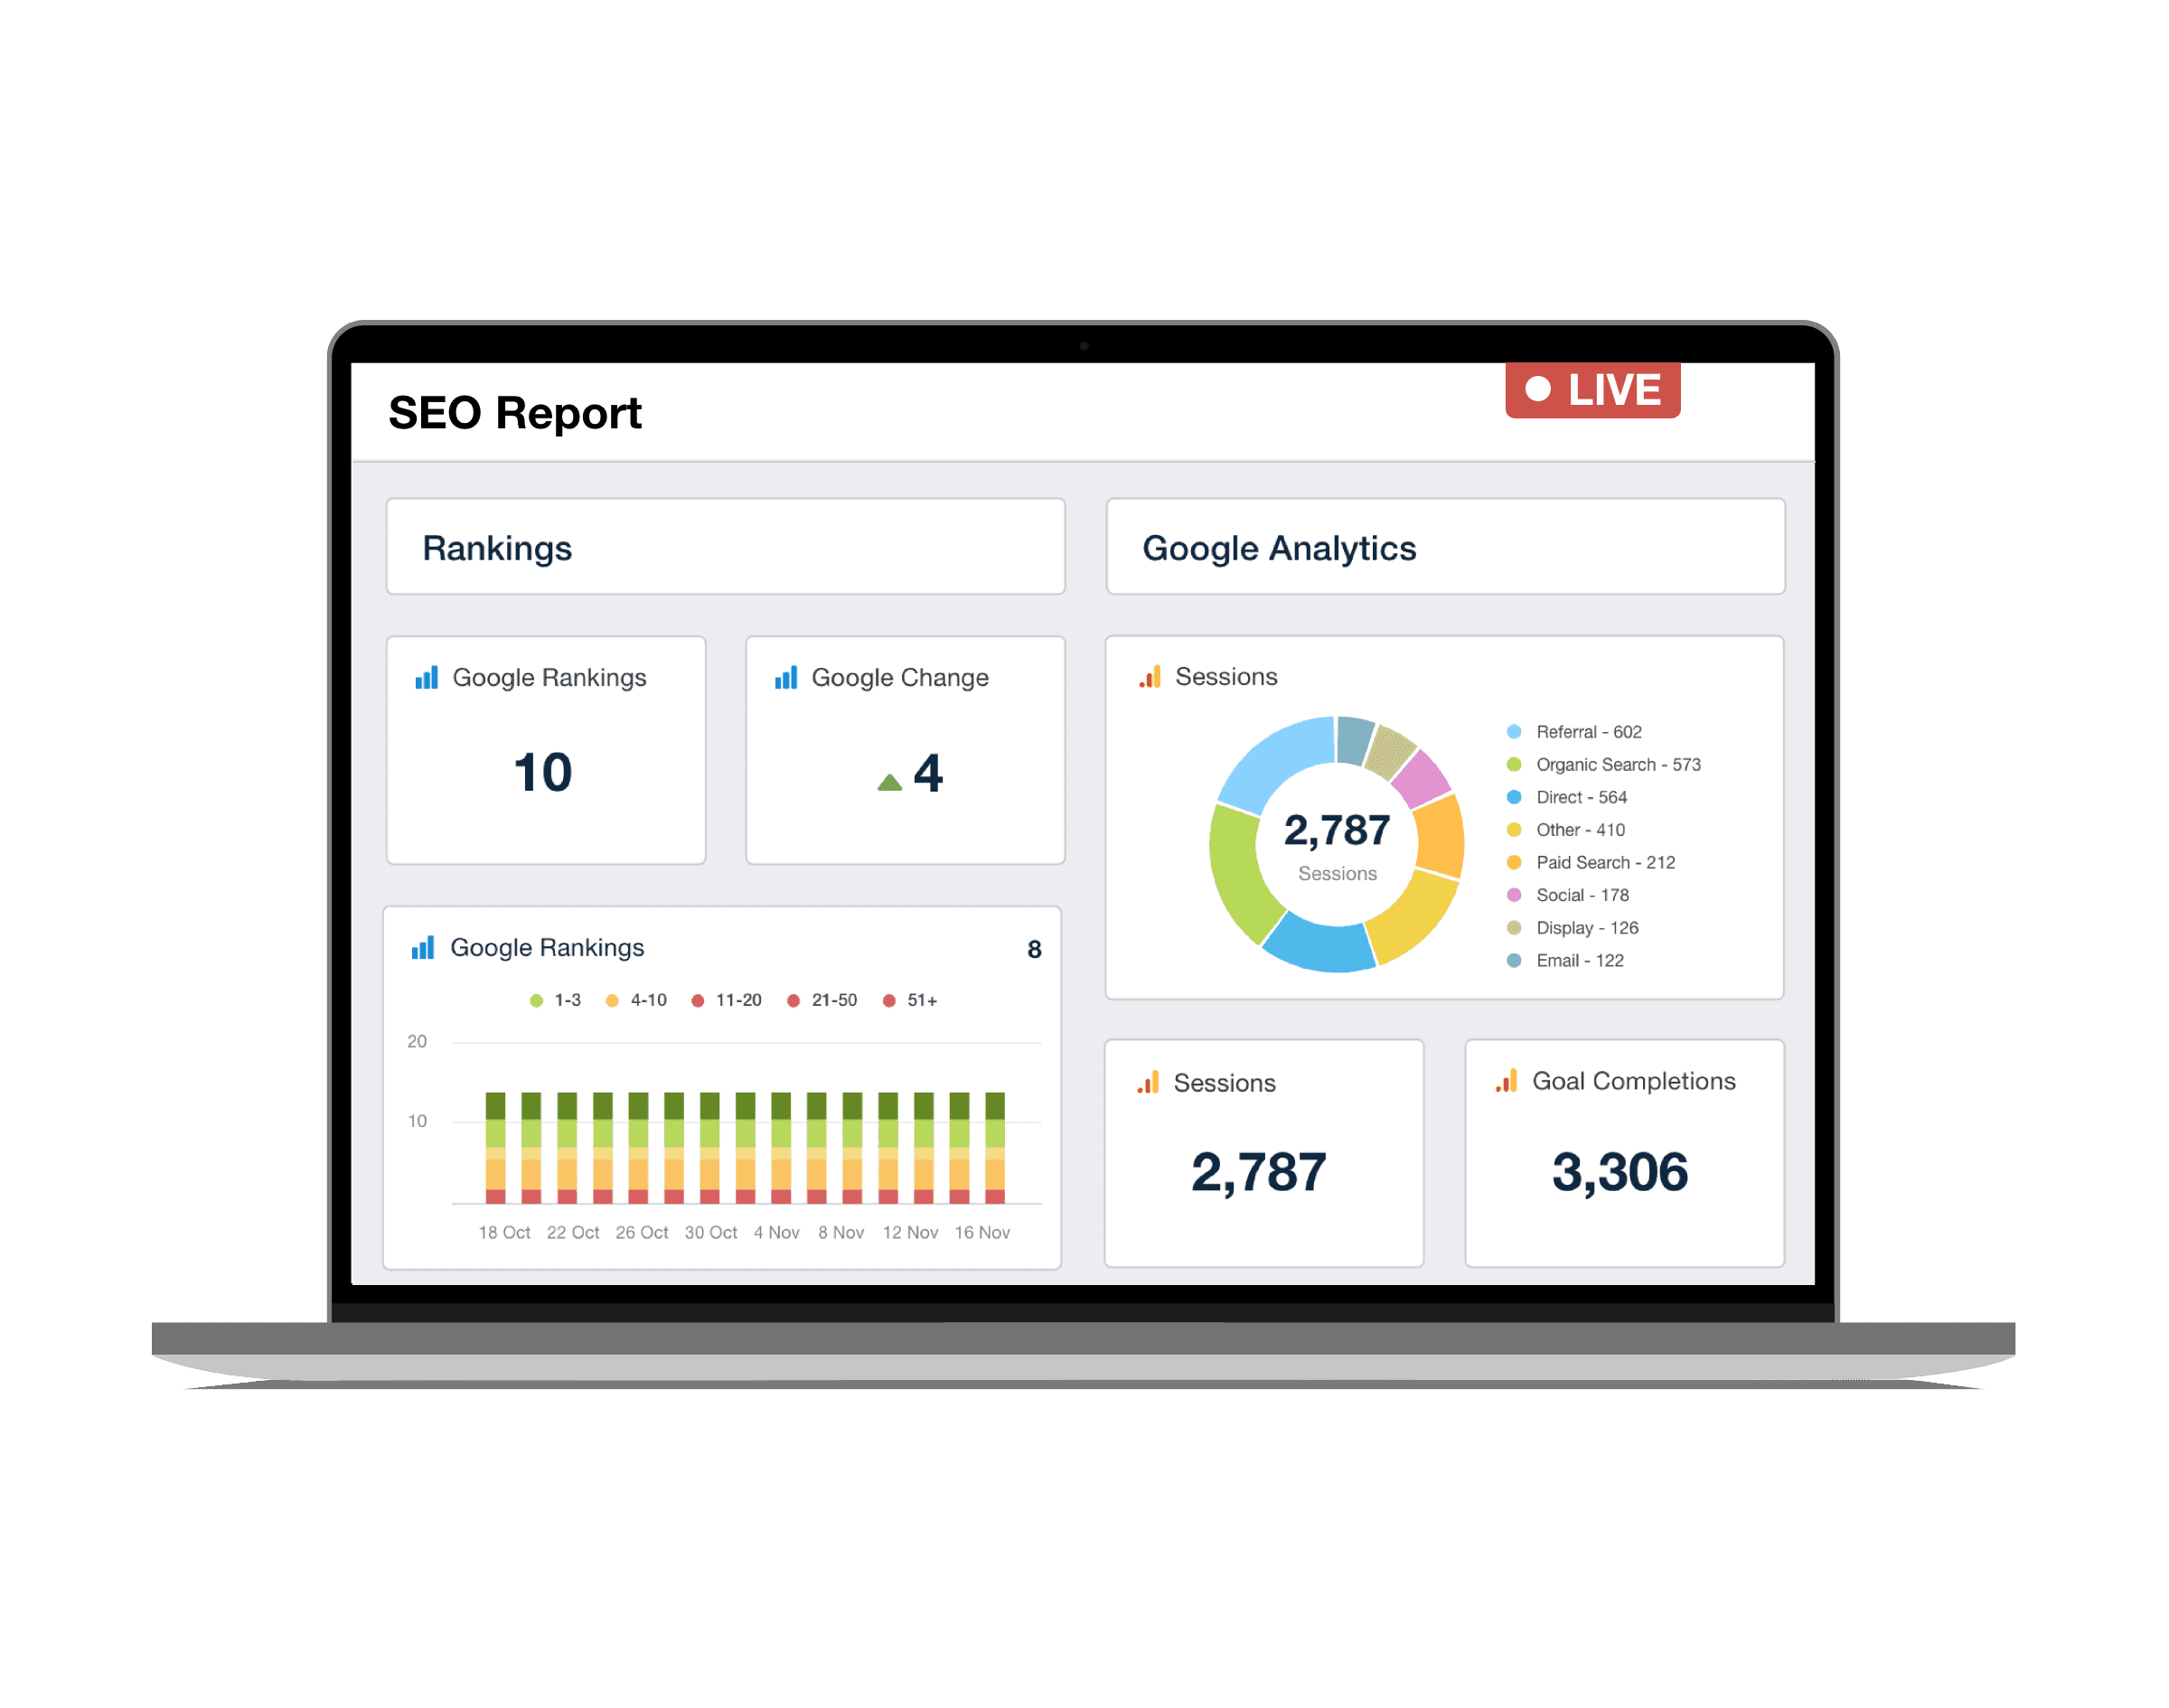
This keeps clients engaged, aligns strategy, and makes it easier to identify opportunities for growth.
We're able to spend a lot more time on client strategy. Our discussions with clients move from "let's walk through the report" to "let's talk about what we should do next." It might seem like a small adjustment, but it’s how marketing campaigns get moved forward.
Ryan Burch, Owner, Tobie Group
Make reporting part of your pitch
We’ve said it before, but it’s worth repeating: when you show prospects how you report, you set yourself apart. Your reporting process becomes a trust signal and a selling point—not just a follow-up task.
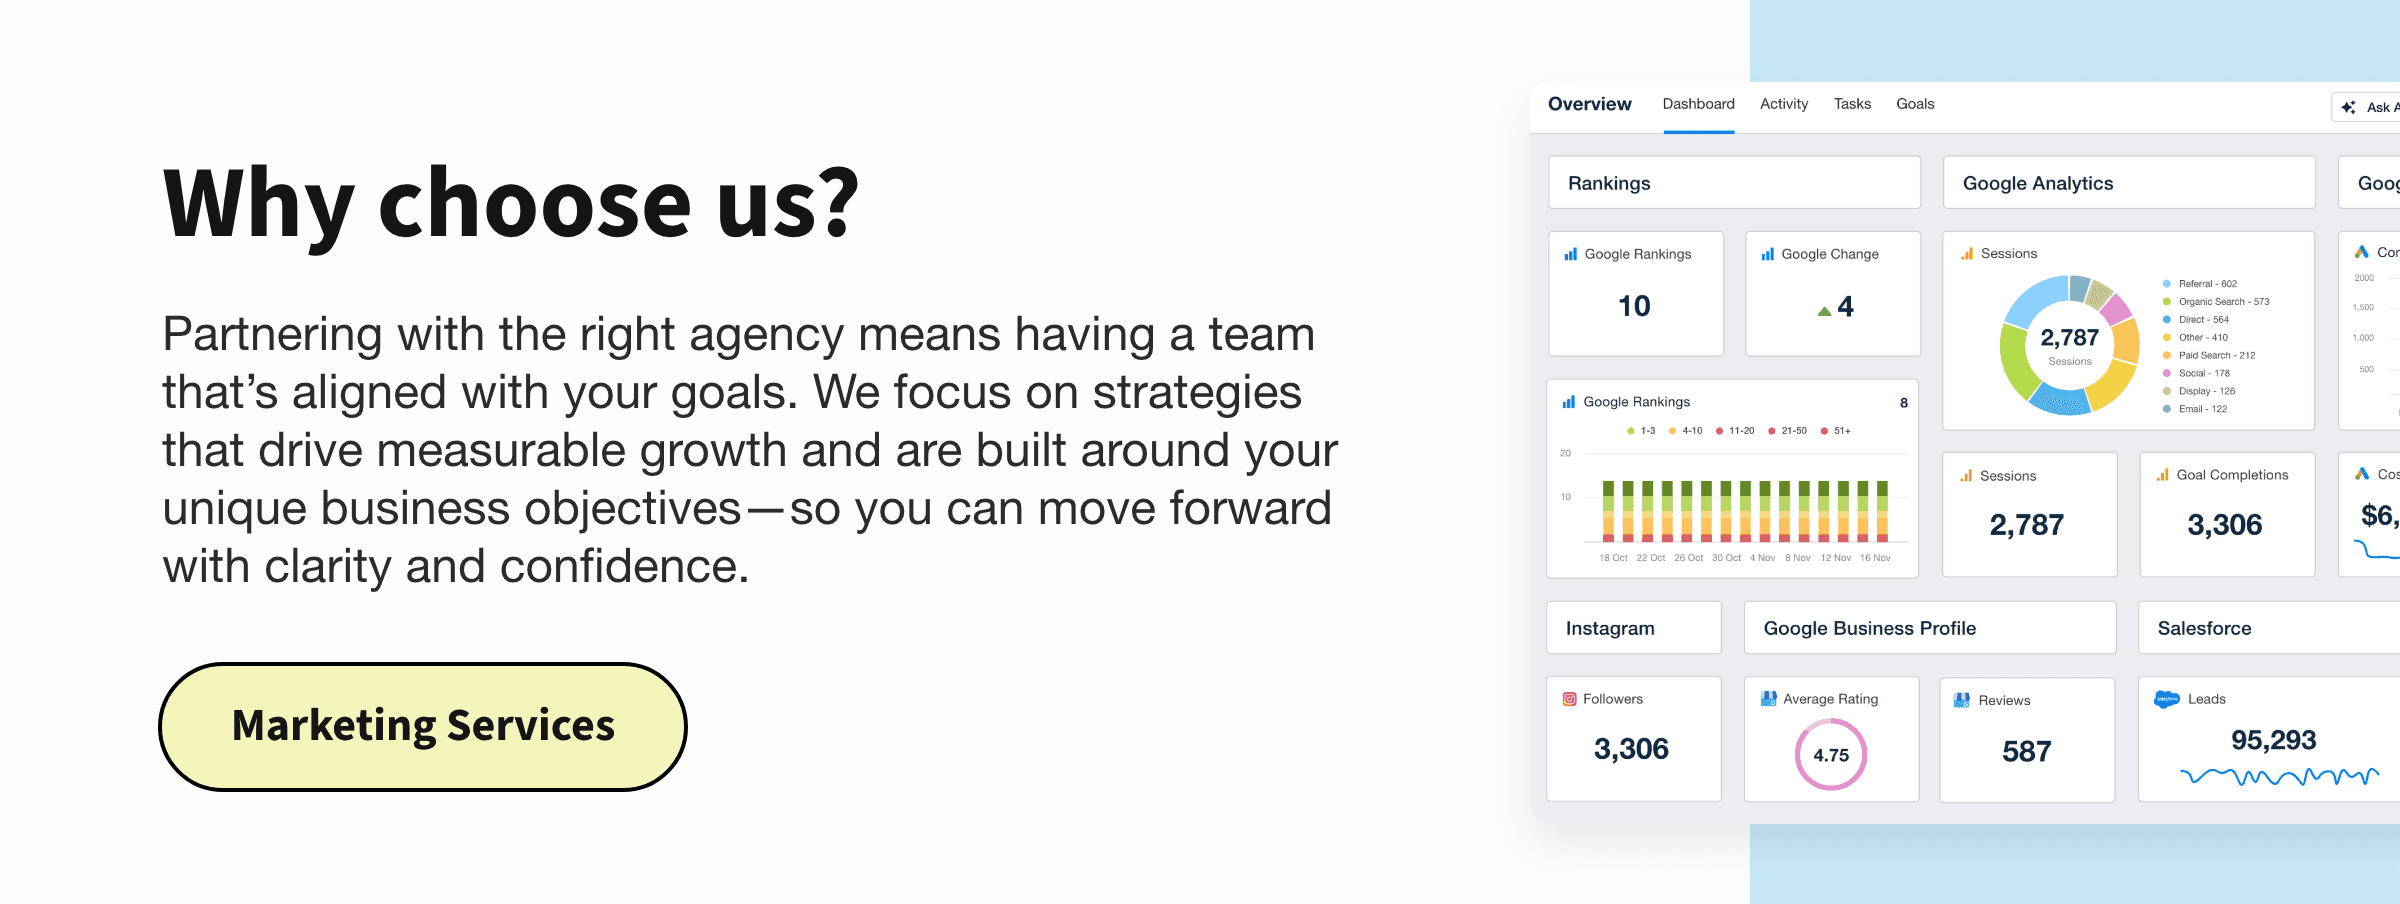
When your reporting is transparent, branded, and built into your agency’s workflow, it becomes more than a deliverable. It becomes proof of your value—something that reinforces your professionalism at every step.
Download free client reporting visuals
Want to show off your client reporting like the pros? We've curated a set of high-quality visuals that you can use across your agency’s website, pitch decks, or sales materials.
Whether you’re looking to:
Add visual trust signals to your landing pages
Showcase your reporting process in proposals
Or simply polish up your pitch decks
These free assets (for any existing AgencyAnalytics customers) will help you position your agency as organized, professional, and data-driven.
No need to design anything from scratch—just download, add your agency’s logo, and drop them in.

Written by
Paul Stainton is a digital marketing leader with extensive experience creating brand value through digital transformation, eCommerce strategies, brand strategy, and go-to-market execution.
Read more posts by Paul StaintonSee how 7,000+ marketing agencies help clients win
Free 14-day trial. No credit card required.


