Table of Contents
Table of Contents
7,000+ agencies have ditched manual reports. You can too.
Free 14-Day TrialQUICK SUMMARY:
Delivery margins refer to the profit remaining after deducting all direct costs involved in delivering a service. Optimizing delivery margins is necessary for agency profitability, promoting growth and sustainability. This guide shares practical strategies to boost delivery margins, ensuring financial health and scalability for marketing agencies.
What are some questions that would keep a marketing agency owner (or head of ops) up at night?
How profitable is your agency?
Where are its gaps?
How much money are you leaving on the table for you and your team?
Are your delivery margins large enough to scale your agency?
Let's face it–profitability plays a crucial role in serving your clients and team. Without sufficient financial resources, none of this would be possible. While money shouldn't be the sole motivator, it's certainly one of the most important ones, especially given the cost of good talent today.
Moreover, a profitable agency is a success for the entire team, meaning more growth opportunities, competitive salaries, and the ability for each team member to thrive in their respective roles.
Here at Parakeeto, our sole focus is helping digital and creative agencies measure and improve their profitability. With our experience helping hundreds of agencies over the years, we differentiate between a well-run organization and one that's on the verge of breaking down.
Below is precisely what you need to know in order to take charge of your profit.👇
First Things First
Before we dive into the details, let's first establish some guidelines before to ensure you have the necessary definitions to understand the information we’ll be sharing.
Agencies charge money for their services (Revenue).
Take away any Pass Through Expenses, which are any expenses incurred by an agency for outsourcing work to external vendors to satisfy client demands. i.e., white label partners, ad purchases, printing budgets, etc.
You’re left with Agency Gross Income (AGI) which is just revenue without any Pass Through Expenses. That’s the true income of your business.
Other Definitions To Know:
Delivery Expenses (Costs): The expenses that an agency incurs in providing its primary services. It primarily includes the payroll allocated to the delivery team, as well as some shared delivery expenses like software and tools necessary to facilitate the team's work.
Delivery Profit: The remaining amount of money after deducting delivery costs from the adjusted gross income (AGI) of a business. It does not include any overhead expenses. It’s worth noting that having a delivery margin below 50% can make it challenging to achieve high profitability.
Overhead Expenses: The continuous expenses incurred by running an agency that is not directly related to providing services. It encompasses administrative, sales and marketing, and facility costs.
Operating Income: The income earned after deducting delivery and overhead expenses, excluding interest, taxes, depreciation, and amortization. It's often measured as EBITDA (short for earnings before interest, taxes, depreciation, and amortization). An operating income of 15% is generally considered acceptable, with a target range of 25-35% for most clients.
Are you still with us?
Hang in there because the exciting part is coming!
Your Golden Metric: Delivery Margin
At the highest level, your Delivery Margin will be the ticket to having profitability baked into your marketing agency.
Delivery Margin: The ratio of Delivery Cost to Agency Gross Income (AGI) that your business earns in a given time period/ across a given section of work.
Formula: Delivery Margin = (AGI - Delivery Cost) / AGI
Alright, so you've done some rough calculations, and now you're staring at your computer. You might be wondering, “Is my Delivery Margin good?”
Well, it depends on the level/scope you're looking at. For Delivery Margin agency-wide, strong profitability might be difficult to achieve if you're under 50%. We consider anything between 50-60% as “healthy.” If you’re looking at this on a per-project or per-client scope, 60-70% is considered "healthy.”
The agency-wide scope is lower because it factors in an expected drop-off due to gaps in Utilization, time off, holidays, turnover/training, and other factors that aren’t typically measured at the project or client level.
It also factors in Shared Delivery Expenses that are related to delivery as a whole and can’t easily be attributed to a particular project. For example, if you were a design firm, these expenses might include design software, stock footage libraries, shared hosting, and so on.
Moving Your Delivery Margin: Three Levers
Now that you're concerned about your Delivery Margin (or maybe you're happy with it but still think there's room for improvement), let's dive into the exciting part - how to improve these numbers.
There are three main levers you can use to influence and improve your Delivery Margin:
Average Billable Rate (ABR) – This has an impact on AGI
Average Cost per Hour (ACPH) – This has an impact on Delivery Costs
Utilization – This also has an impact on AGI
Let’s unpack these.
Lever 1 - Average Billable Rate (ABR)
The first lever you’re going to want to explore is Average Billable Rate (ABR).
How efficiently does your team earn your revenue?
Formula: ABR = AGI / Delivery Hours
For the average amount of AGI that your agency earns (remember, AGI is just your Revenue minus anything that’s Pass Through), how many hours did your team work to earn that money? Did you sell a project with an AGI of $10,000 and work 50 hours (ABR of $200) or 40 hours (ABR of $250)?
That approach may seem reasonable in theory, but how can we actually increase that figure? Is the solution always to work less?
Not quite.
There are two primary ways to boost your ABR:
Raise the price for the same product or service without increasing its scope.
Reduce the amount of time needed to produce the same product or service without lowering the price.
Although it's often disregarded, the second approach can be as effective as raising prices. In terms of where you should be benchmarking yourself, you’re going to want your ABR to be around 3x your ACPH - more on that below:
Lever 2 - Average Cost Per Hour (ACPH)
Simply put, we’re trying to figure out how you’re going to be able to do the same work that you’re doing at the same prices while spending less money.
Formula: ACPH = Total Payroll Cost & Benefits / Total Hours
So, what constitutes a total Payroll Cost? While salary is likely included, could you factor in expenses such as that can of Coke Zero Janet from HR recently purchased during a business trip?
Your Total Payroll Cost & Benefits are your team members’ salaries, benefits, payroll taxes, and any other costs you incur that are directly related to employing these people summated. Typically you would think of the scope of this as all the compensation and benefits you would advertise to a prospective employee.
Total Hours is a little more straightforward in that it’s just how many hours in total you have to work for a given time period. For one team member, that’s usually 40 hours a week. If we’re talking about a year for a team of 10, you’d be looking at 40 (hours) * 52 (weeks) * 10 (employees) for that Total Hours number.
The next step would be looking into how to decrease this number while not actually increasing your prices or lowering your standard of work. The major opportunity here is to create better processes & SOPs to make use of more junior/less experienced and, therefore, less expensive talent. How often does your team leave a trail behind them of how their tasks are done? You might even be halfway there to a solid SOP and don’t even know it.
In terms of where you’re going to want to be considered at a “healthy ACPH,” generally, being ⅓ of your ABR is a good start.
Lever 3 - Utilization
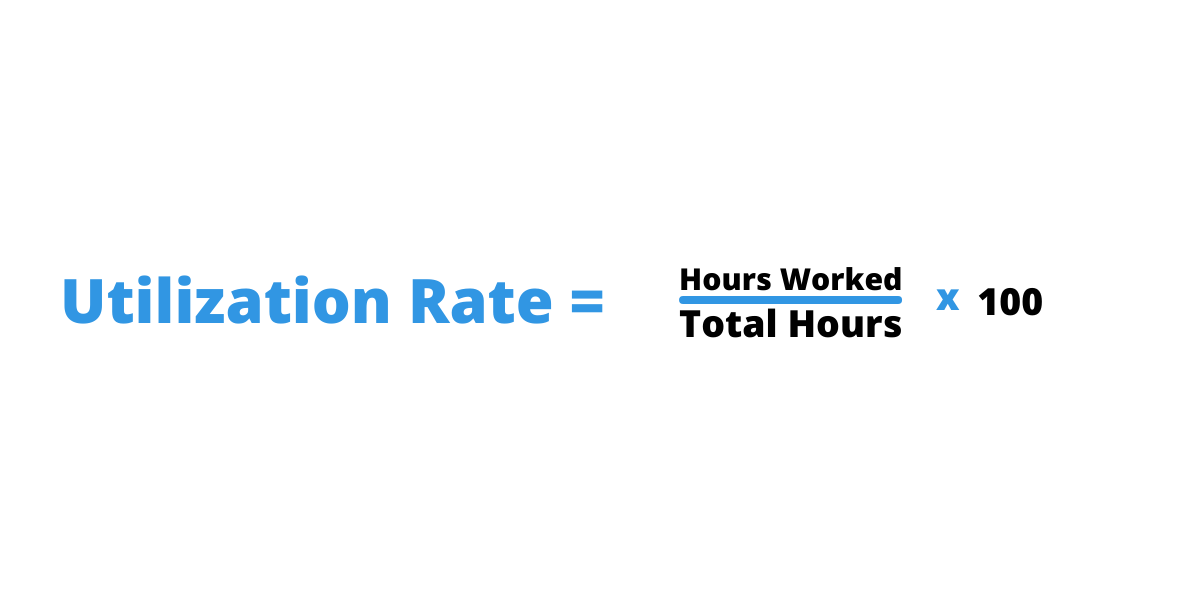
The third and final lever for you to make a positive impact on your Delivery Margin is by improving your Utilization rate. This is a metric that calculates the average capacity that is used for revenue-generating activities over a certain time period or within a specific section of your team.
Formula: Utilization = Delivery Hours / Capacity
Where Delivery Hours is the number of hours spent working on tasks for a client, and where Capacity refers to the total number of hours that the team has available during that time period (delivery work or not).

For a typical team member, their capacity is 40 hours a week, 52 weeks a year, so 2080 hours. Use this for an individual’s Utilization rate, or multiply it by the number of team members to get an agency-wide or department-wide rate.
You might have already guessed this, but to increase your Utilization rate, you’re looking at either selling more work to keep the team busier (easier said than done) or decreasing your team’s capacity to align closer to the delivery hours that are available.
In terms of what we would deem as a successful Utilization rate, somewhere from 50-60% on an agency-wide level would be considered healthy. Remember, when looking agency-wide, we’re also including those on the sales team, internal marketing, admin team, and whoever else isn’t doing delivery work along with your delivery team all in one.
However, if you’re looking at just the delivery team or, say, a pure producer role like a “designer” or a “developer,” it’s slightly different. Something closer to 70-90% weekly would be where to shoot for, depending on the culture at your agency. Yearly, this number might look more like 60-80% if you include vacations, sick days, and such… but it’s a good starting point.
Agency Tip: In general, it's not recommended to share this metric with your team and use it as a performance target, as this can result in inflated timesheets or unnecessary delays. Instead, the utilization metric should be used as a tool to assess the management team's ability to effectively balance capacity with the sales pipeline.
By monitoring your Utilization rate, you can make informed decisions about when and where to adjust staffing levels in order to optimize your available capacity.
Closing Thoughts
If there is one thing that we know, it’s that many of our readers (typically marketing agency owners or senior PM/Ops people) are strapped for time.
This kind of reporting can’t really be done “off of the side of your desk,” but ironically, it’s almost always being done like this, and if you’re reading this post, I guarantee you there is a notification in Slack that needs your attention.
Given your amount of time available, the one major takeaway to start down the road of optimizing your profitability would be to measure your Delivery Margin and make use of the three main levers that you have to influence this number.
Good luck out there!

Written by
Marcel Petitpas is the CEO & Co-Founder of Parakeeto, a company dedicated to helping agencies measure and improve their profitability by streamlining their operations and reporting systems. In his work as a speaker, podcast host, and consultant, specializing in Agency Profitability Optimization, he's helped hundreds of agencies around the world measure the right metrics and improve their operations and profitability.
See how 7,000+ marketing agencies help clients win
Free 14-day trial. No credit card required.


