Table of Contents
QUICK SUMMARY:
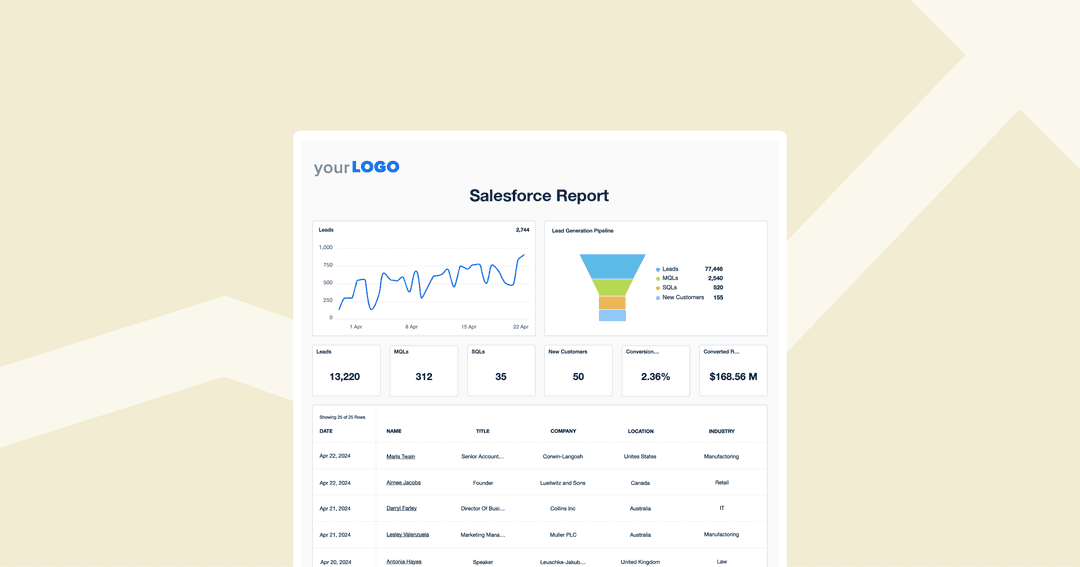
Client reporting is a key step in creating a transparent, collaborative relationship while helping customers understand the full effect of each marketing campaign. Salesforce reporting is vital when looking at lead generation success stories and understanding how well a client’s marketing and sales teams are doing. This article looks at how to create clear, comprehensive reports without overwhelming your clients with data.
Salesforce is a critical lead generation tool that allows your clients to manage each stage of their pipelines. Best of all, the solution provides a wealth of data that helps agencies understand sales performance and drive better results.
While accessing these metrics is key, the real game-changer lies in client reporting. Without a way to visualize and interpret Salesforce CRM data, it’s hard for marketing agencies to showcase their achievements.
Creating comprehensive Salesforce reports increases client-agency transparency, allows clients to make data-driven decisions, and lets marketers track lead gen performance over time.
Today, we’re taking a deep dive into how to create Salesforce reports, which metrics to include, and common challenges to avoid.
After all, you can’t celebrate a lead gen milestone if your clients don’t understand what you’re celebrating.
Understanding Salesforce Native Reporting Options
Lead generation can be an overwhelming endeavor for clients. A solid Salesforce report not only helps clientss understand how they’re doing, it demystifies the marketing process.
Potential customers are at different stages of the buying cycle. Customers need information to move them to the next buying cycle stage. It's all about moving these prospects down your sales funnel–not as quickly as possible, but as efficiently as possible.
Bryan Lozano, Vice President of Operations, Ad-Apt
Through these customized reports, marketing agencies show which areas are doing well and where there’s still room for improvement.
Salesforce includes a basic Salesforce report builder, which creates a native or standard report type. This includes four report type options:
Tabular Reports: These reports show lines of data, like an Excel spreadsheet. To create a tabular report, go to Salesforce's Reports tab, select your report type, select your filters in the report canvas, then go to the Outline tab to choose what you'd like to display. Finally, click Save & Run. You can then export Salesforce reports.
Summary Reports: Summary reports show groups of data, and are the most commonly used. To run a Summary report, create a tabular report, then type a field name (like Account Name) in Add Group to create a grouping. You can add additional fields, and when you're ready, click Save & Run.
Matrix Reports: Matrix reports are similar to summaries but let users group by rows and columns. To create a Matrix report, first build a summary report, then click a Group Column (like type of account) to add another grouping.
Joined Reports: These reports let users compare data by building two separate reports. To create reports that are joined, go to Start a New Report, click New Report, and choose your report type. Then, change the report format to Joined Report. Any report can be converted to a Joined Report.
Marketers also use Salesforce's custom report type option, which is created by administrators and tailored to client needs. Salesforce custom report types allow for marketers to choose which fields and objects to include.
While the internal reporting options from Salesforce are beneficial, many agencies find that they lack the customization and visualization options needed to fully demonstrate agency value to clients.
Using the AgencyAnalytics Salesforce integration, agencies access a variety of features, like white labeled marketing dashboard tools, which let marketers monitor several campaigns at once while creating automated reports in as little as 11 seconds.
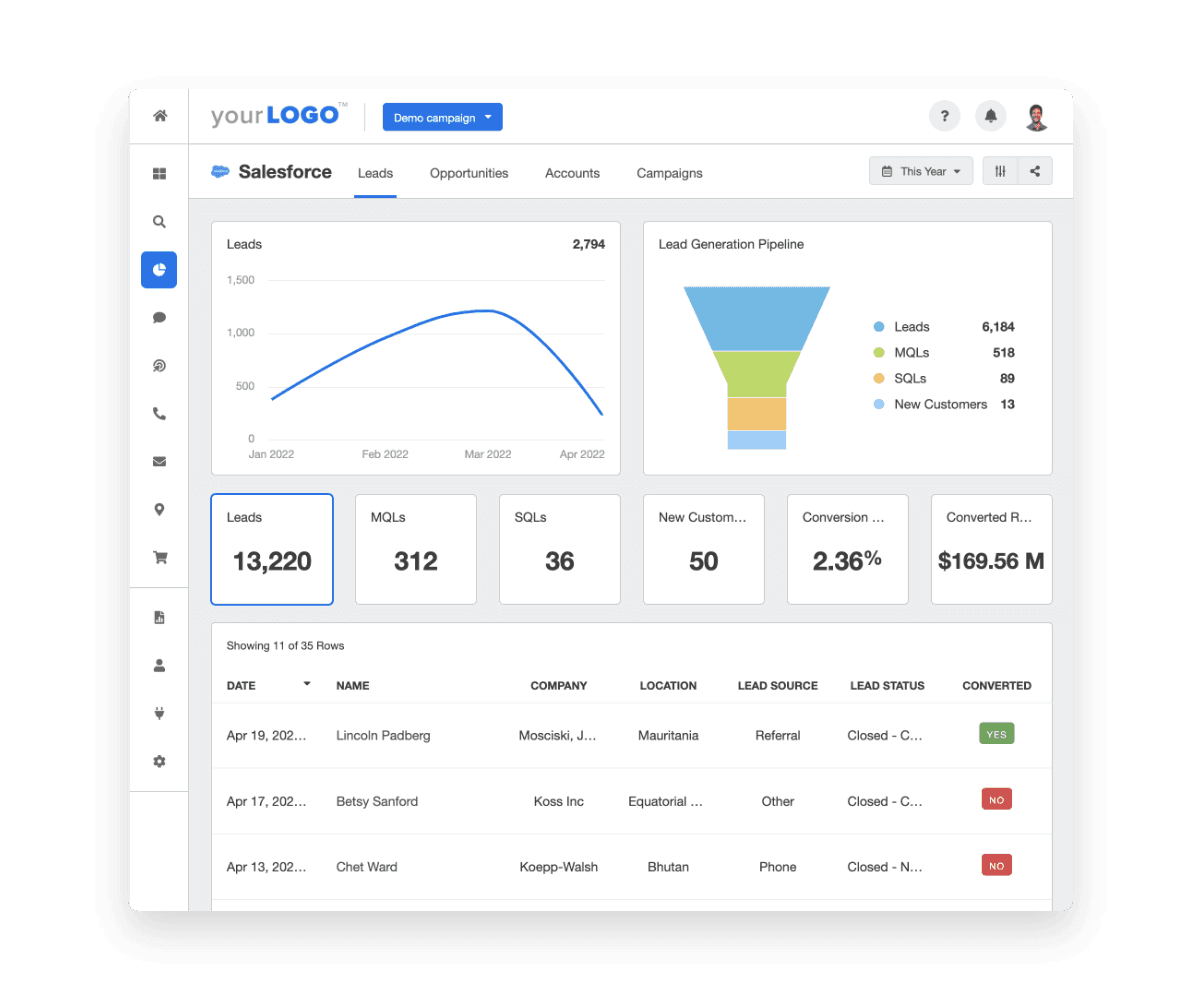
Create custom Salesforce reports in just 11 seconds using the AgencyAnalytics Smart Reports feature! Try it free for 14 days.
What Makes a Great Salesforce Report?
To build an exceptional Salesforce report, you’ll need to keep the following in mind:
Keep It Clear and Transparent: A mound of data is overwhelming and confusing. Instead, reports should be concise, well structured, and visually engaging.
Personalize Reports to Each Client’s Growth Goals: There is no cookie cutter approach when it comes to metrics. Each report should center on your client’s sales journey. For example, if you’re working with a client trying to increase their customer retention numbers, you wouldn’t focus on new customer growth.
Focus on Actionable Metrics: While data is great, your reports should highlight next steps and include growth recommendations. A trend analysis is also a helpful tool to include in the report.
Ensure all Metrics are Relevant and Timely: It’s important to understand your clients’ objectives and provide reporting based on real-time data.
Reporting shows our clients the results we achieve for them in an easy-to-understand visual. We provide monthly reminders of how we are helping their business grow with these reports.
Denise Bowen, Managing Director, WEB ROI
Knowing Which Metrics To Include in Your Salesforce Report
It’s important to understand your client’s growth goals before building a comprehensive Salesforce report. While Salesforce offers a multitude of metrics, including irrelevant data gets confusing for clients.
Here are some analytics available in Salesforce, and when to use each metric:
Number of Campaigns Sent
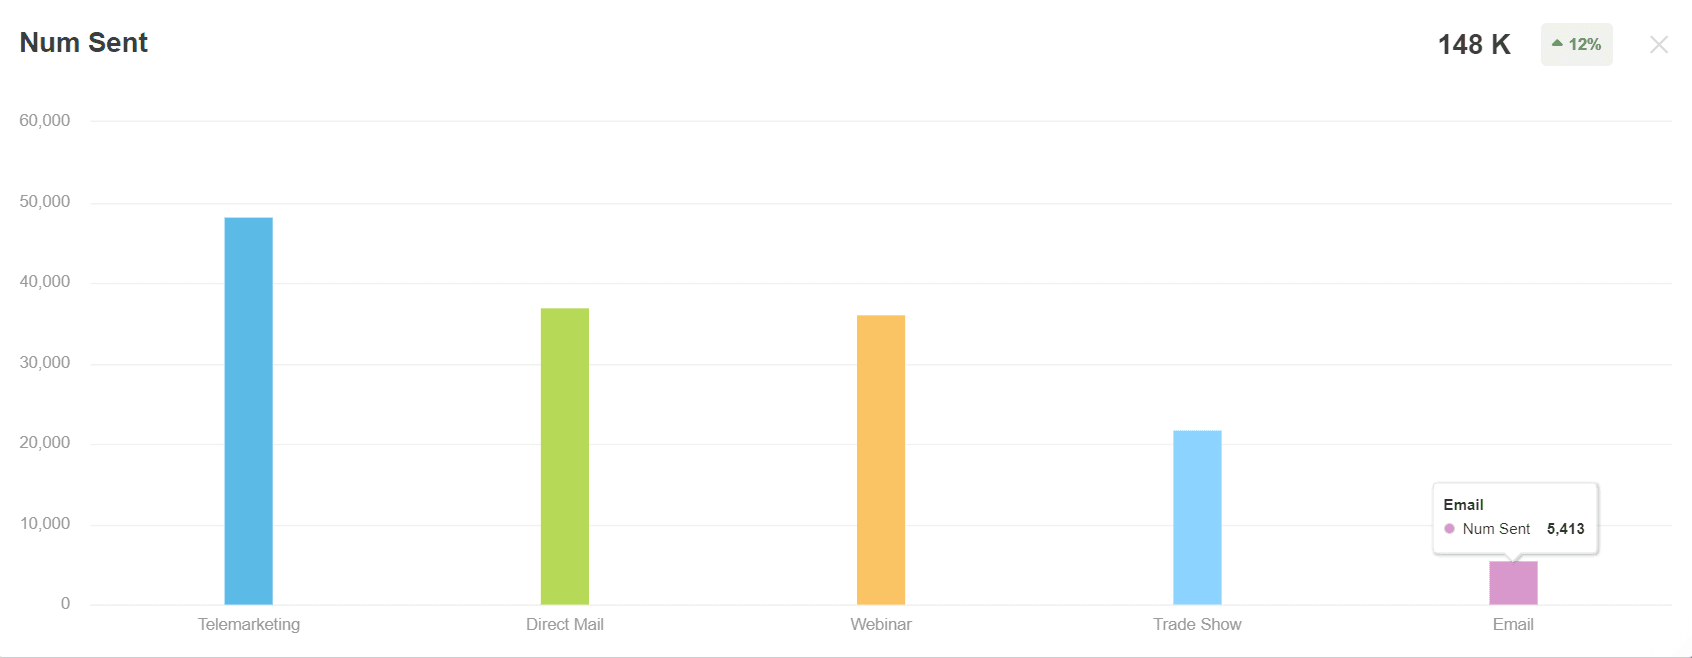
This will be shown as “Num Sent”. It measures the amount of correspondences sent to potential leads and current customers through a variety of channels, including newsletters, cold calls, and emails.
When To Use This Metric:
Num sent is a good way to understand if your marketing campaigns are working and whether these correspondences are reaching the right audience. For example, if your client has sent 500 emails to a list of leads and gotten zero responses, it may be time to analyze and re-work your email marketing strategy.
Responses
This data point shows how many clients interacted with your client’s marketing campaigns. Interactions include clicking on email links or filling out web forms.
When To Use This Metric:
Responses help marketing agencies better understand how customers are engaging with your client's campaigns. It’s helpful in showing brand growth and analyzing whether messaging is working.
Leads
This is a top-of-the-funnel metric, often used in custom reports, that shows how many leads are currently in the pipeline. These leads have yet to be reviewed by your client’s sales team, so may not all be qualified (or helpful).
Actionable metrics give you clear information that you can use to improve your business. For example, the number of sales, or the number of new leads. They give you clear information that you can use to make changes and improve your business.
Guy Hudson, Founder, Bespoke Marketing Plans
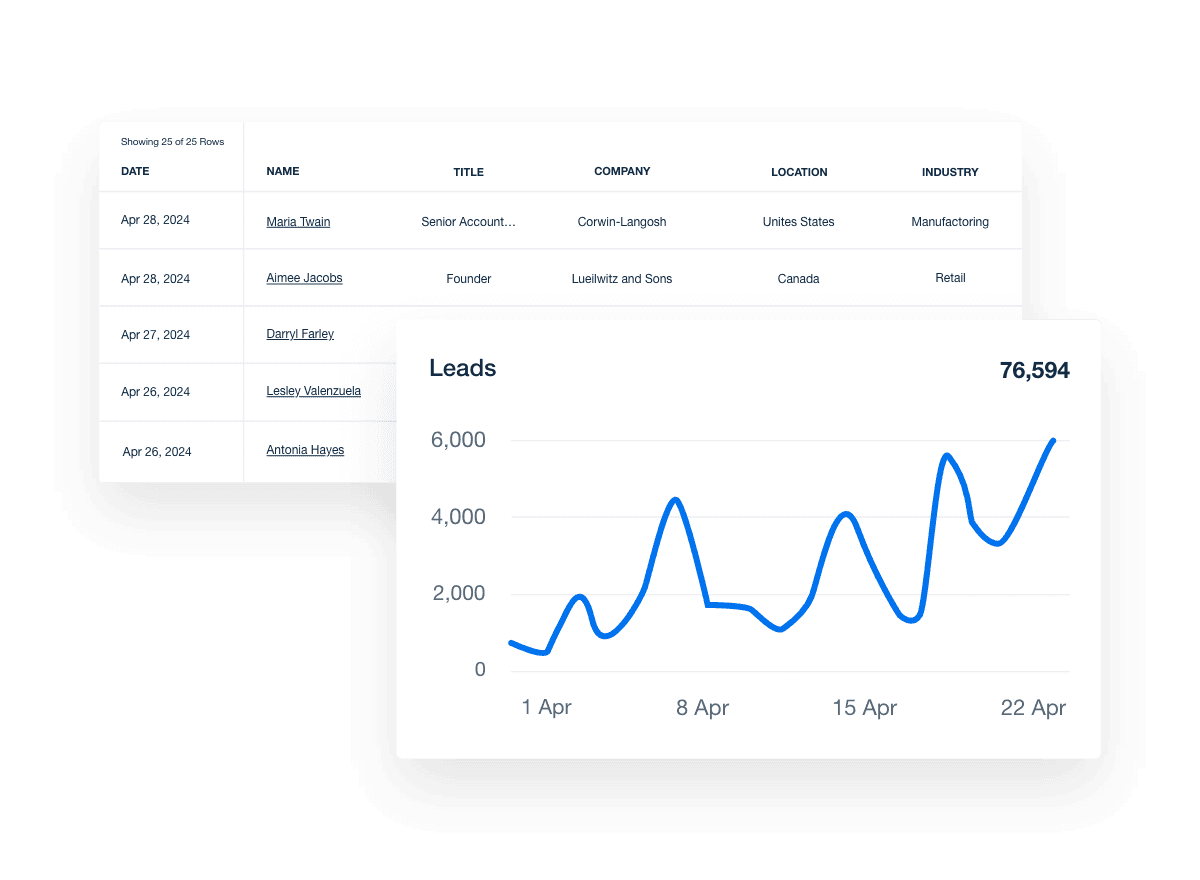
When To Use This Metric:
If your client is looking to grow, tracking the number of leads your marketing efforts are producing is essential. Not only does it help demonstrate ROI, it allows clients to see whether campaigns are working.
This is also a great way to understand when it’s time to pivot and change your marketing strategy. If your strategy is not producing enough leads, it may be time to reconsider messaging or increase ad spend.
Marketing Qualified Leads (MQLs)
These are the leads that have already been reviewed by your client’s marketing team, meaning they’re a step above regular leads. For example, let’s say your agency is running a social media campaign and a lead reached out and agreed to fill out a survey. At this point, your client would review the survey and, if the results match their goals, the lead would be marked as MQL.
When To Use This Metric:
MQLs are more likely to convert. Including the amount of MQLs that resulted from a specific campaign is a good way to highlight your agency’s accomplishments.
Sales Qualified Leads (SQLs)
This metric goes further than MQLs, as these leads have been reviewed by the sales team and shown to have higher conversion potential.
When To Use This Metric:
Like MQLs, this type of metric highlights how well each campaign is doing, based on your client’s growth goals.
Opportunity Win Rate
This shows how many sales opportunities were closed by your client’s sales team.
When To Use This Metric:
The opportunity win rate is a good way to show the effectiveness of your client’s sales team. For example, if your client is focused on optimizing their sales department, this data point helps them understand how many deals have been closed and whether any changes need to be made.
Impress clients and save hours with custom, automated reporting.
Join 7,000+ agencies that create reports in under 30 minutes per client using AgencyAnalytics. Get started for free. No credit card required.
Already have an account?
Log inNew Customers
This metric shows how many leads have been converted into active customers.
When To Use This Metric:
This is a helpful way of proving ROI while highlighting campaign-related accomplishments. For example, if this metric had been lagging in the first two quarters, then started to grow in the third quarter after your agency implemented an email marketing campaign, it would show the effectiveness of your strategy.
Expected Revenue
This shows how much cash flow will be generated once deals are closed in your client’s pipeline.
When To Use This Metric:
Expected revenue is helpful to include when clients are looking for cash flow projections and long-term forecasts. It allows clients to understand how their pipelines are growing and which deals their sales team should focus on.
Conversion Rate
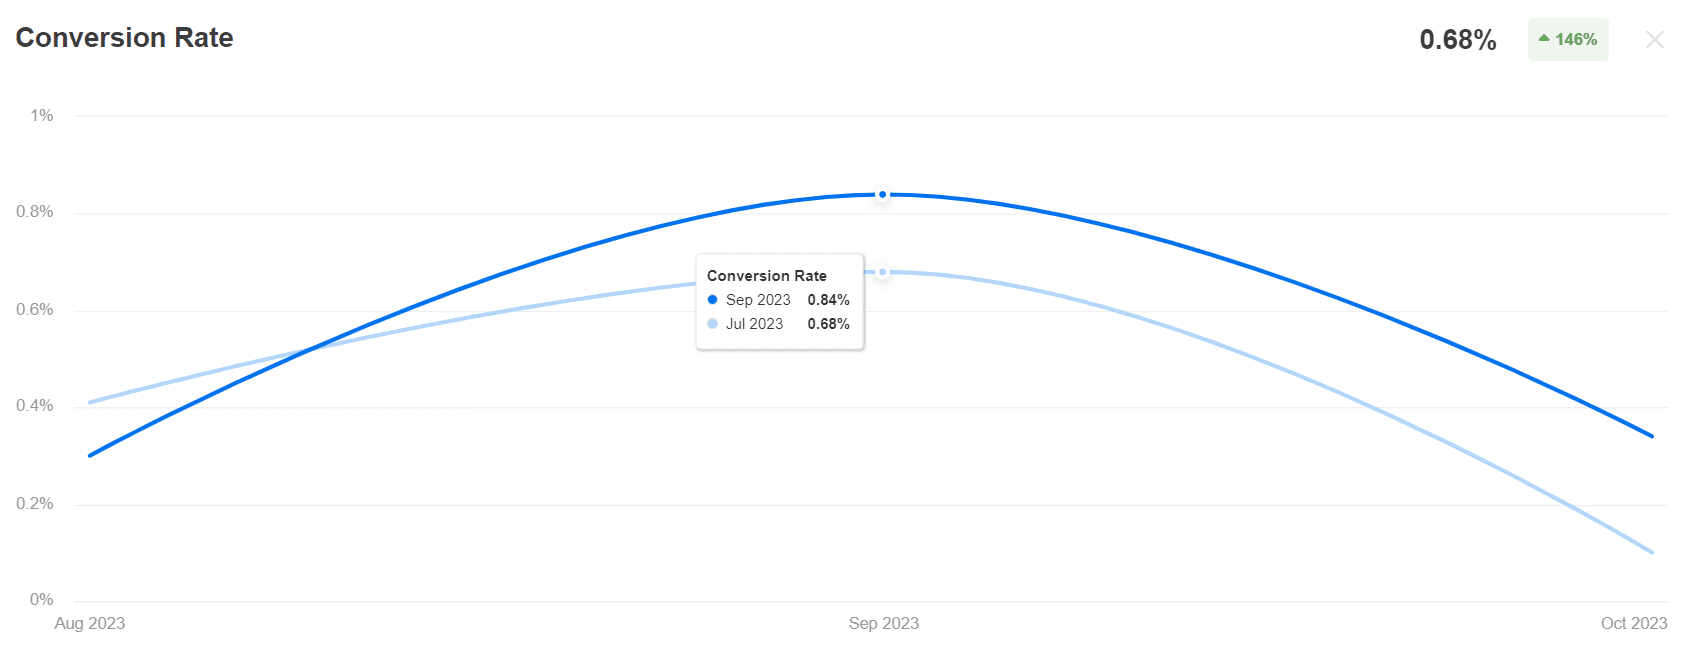
Shown as a percentage, this metric measures how many leads transitioned into new clients.
When To Use This Metric:
This data point is commonly used in Salesforce reports and provides a clear look at a client’s pipeline, allowing your marketing agency to pivot if needed. For example, if your conversion rates are decreasing, it may be time to analyze the sales funnel and see where leads are leaving.
Amount Won/Lost
Amount won is a useful metric that shows total revenue generated by your client’s sales team through closed deals. Similarly, amount lost shows potential revenue that dropped off because a deal couldn’t be closed.
When To Use This Metric:
Like expected revenue, these data points are good indications of future cash flow and sales success rates.
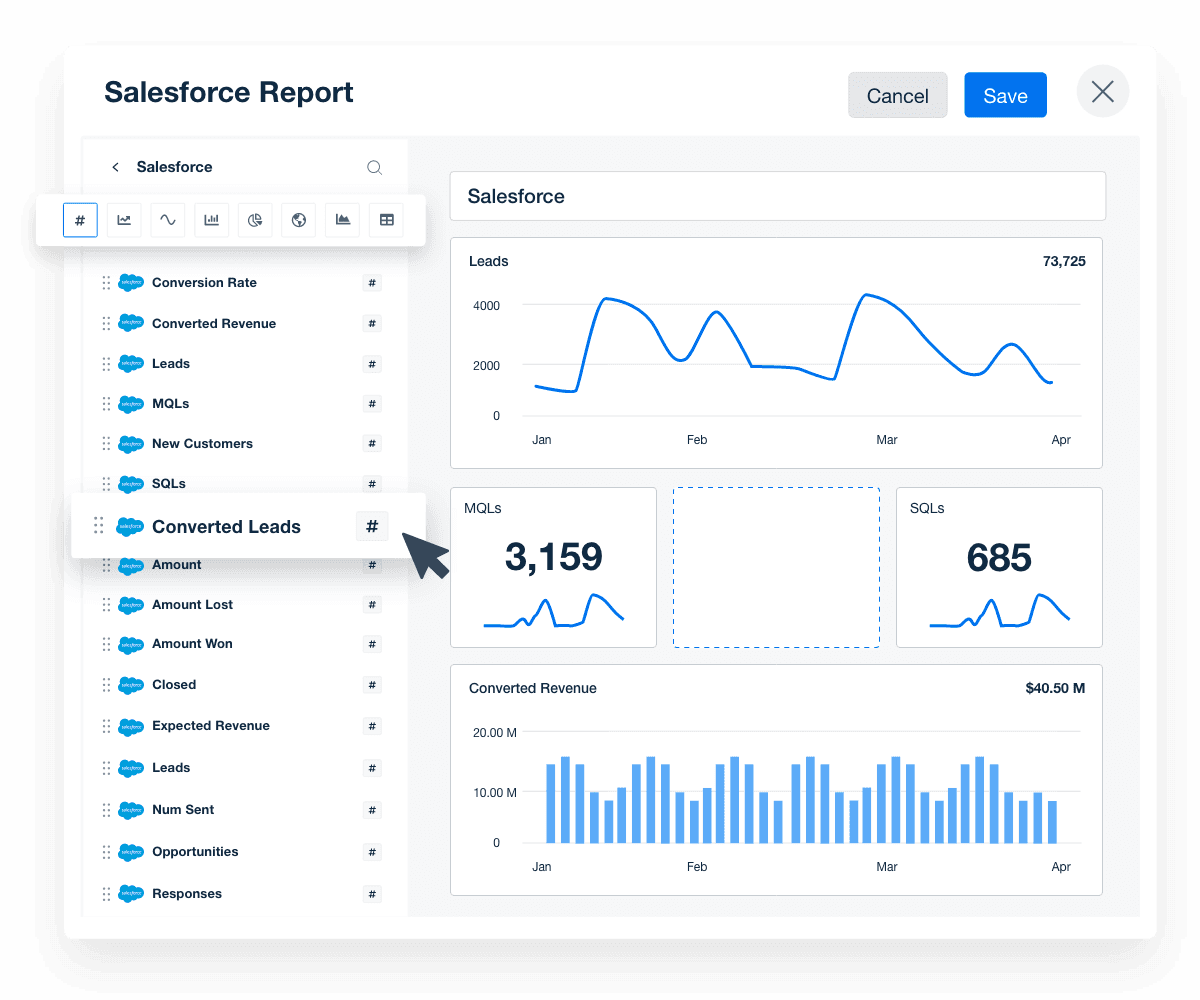
Simplify your agency’s Salesforce client reporting–lean on our world-class customer support team to get you started. Try AgencyAnalytics free for 14 days!
Common Challenges To Avoid
Creating solid reports is no easy feat. From choosing the wrong metrics to overwhelming the client, there are a variety of common issues even the best marketer faces. Which is why we’ve created a list of pitfalls to avoid:
Overloading Clients With Data
Salesforce offers a wide variety of data, and it’s easy to put all of it into a report. Not only will this overwhelm your client, it won’t show the story you need to tell.
Solution:
When building Salesforce reports, choose several key metrics to focus on based on your client’s growth goals.
Not Adding Enough Context
Clients aren’t marketers. They won’t understand why each metric matters unless you explain it to them.
Solution:
Adding visuals and clear annotations helps avoid any confusion.
Opting For Manual Reporting
Creating reports manually is incredibly time-consuming and intensive. Not only does manual reporting waste billable hours, it increases your chances of making mistakes.
Solution:
AgencyAnalytics’ automated reporting tool allows agencies to quickly create scheduled reports, freeing your team up to focus on client needs.
Failing To Show Impact
If you’re only showing results without connecting these numbers to your client’s goals, you’re creating a disconnect with your client.
Solution:
Connect your client’s metrics to their objectives. For example, if your client is concerned about long-term cash flow, your report should include expected revenue and amount won metrics, along with an explanation of how this will affect cash flow.
How To Build Top-Notch Salesforce Reports
Creating a consistent reporting format is key for building comprehensive reports that connect with client goals. AgencyAnalytics’ reporting platform allows marketers to seamlessly build customized reports with clear visuals and real-time data.
Here are our top tips for successful Salesforce reporting:
1. Set KPIs and Goals Early
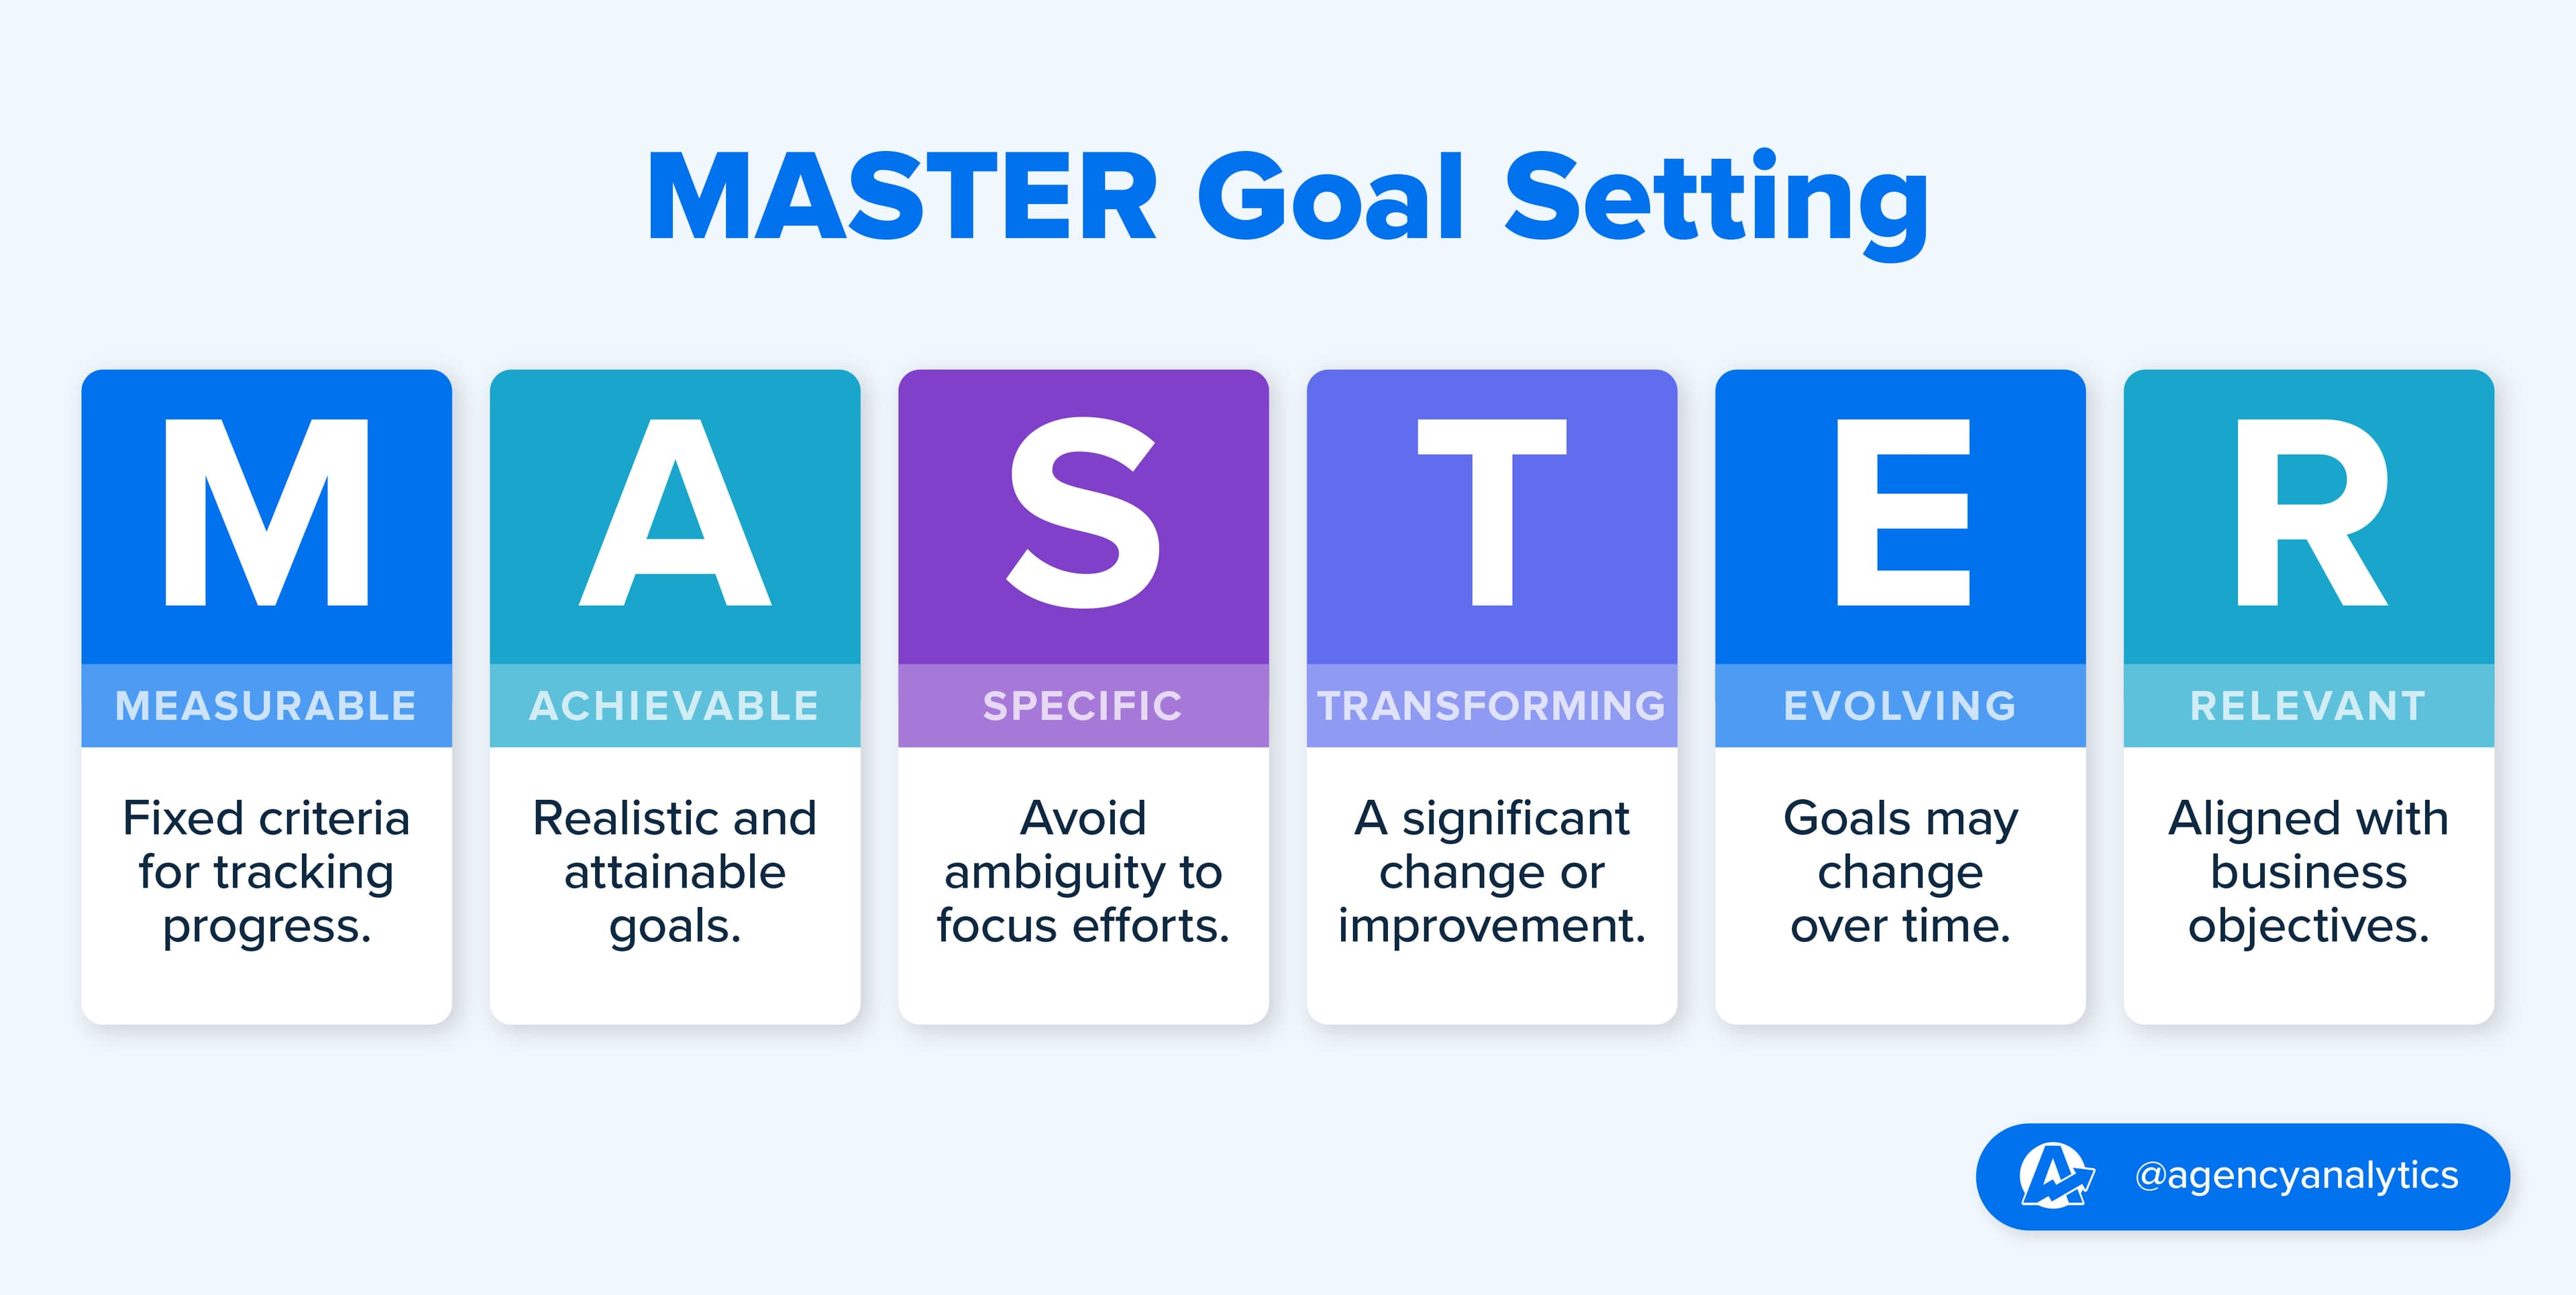
Establishing growth goals with your client is a critical part of the reporting process. After all, if you don’t know what you’re aiming for, what’s the point of collecting metrics? The MASTER goal-setting framework is useful here, as it lets you work with your clients to choose realistic objectives that are:
Measurable
Achievable
Specific
Transforming
Evolving
Relevant
Once you understand your client’s objectives, you’ll be able to choose which key performance indicators (KPIs) make the most sense to follow. For example, if your client is interested in improving their pipeline growth, you may decide your goal is to improve the sale’s team’s lead conversion rate by 20% in 6 months.
2. Decide Which Metrics to Track
Once you’ve established your client’s goals and KPIs, you’ll be able to choose which metrics to track in your Salesforce reports. Ensure all analytics relate to your client’s objectives and KPIs. For example, if you’re trying to improve lead conversion, you could track lead conversion rates, MQLs, and SQLs.
3. Choose How Often To Send Reports
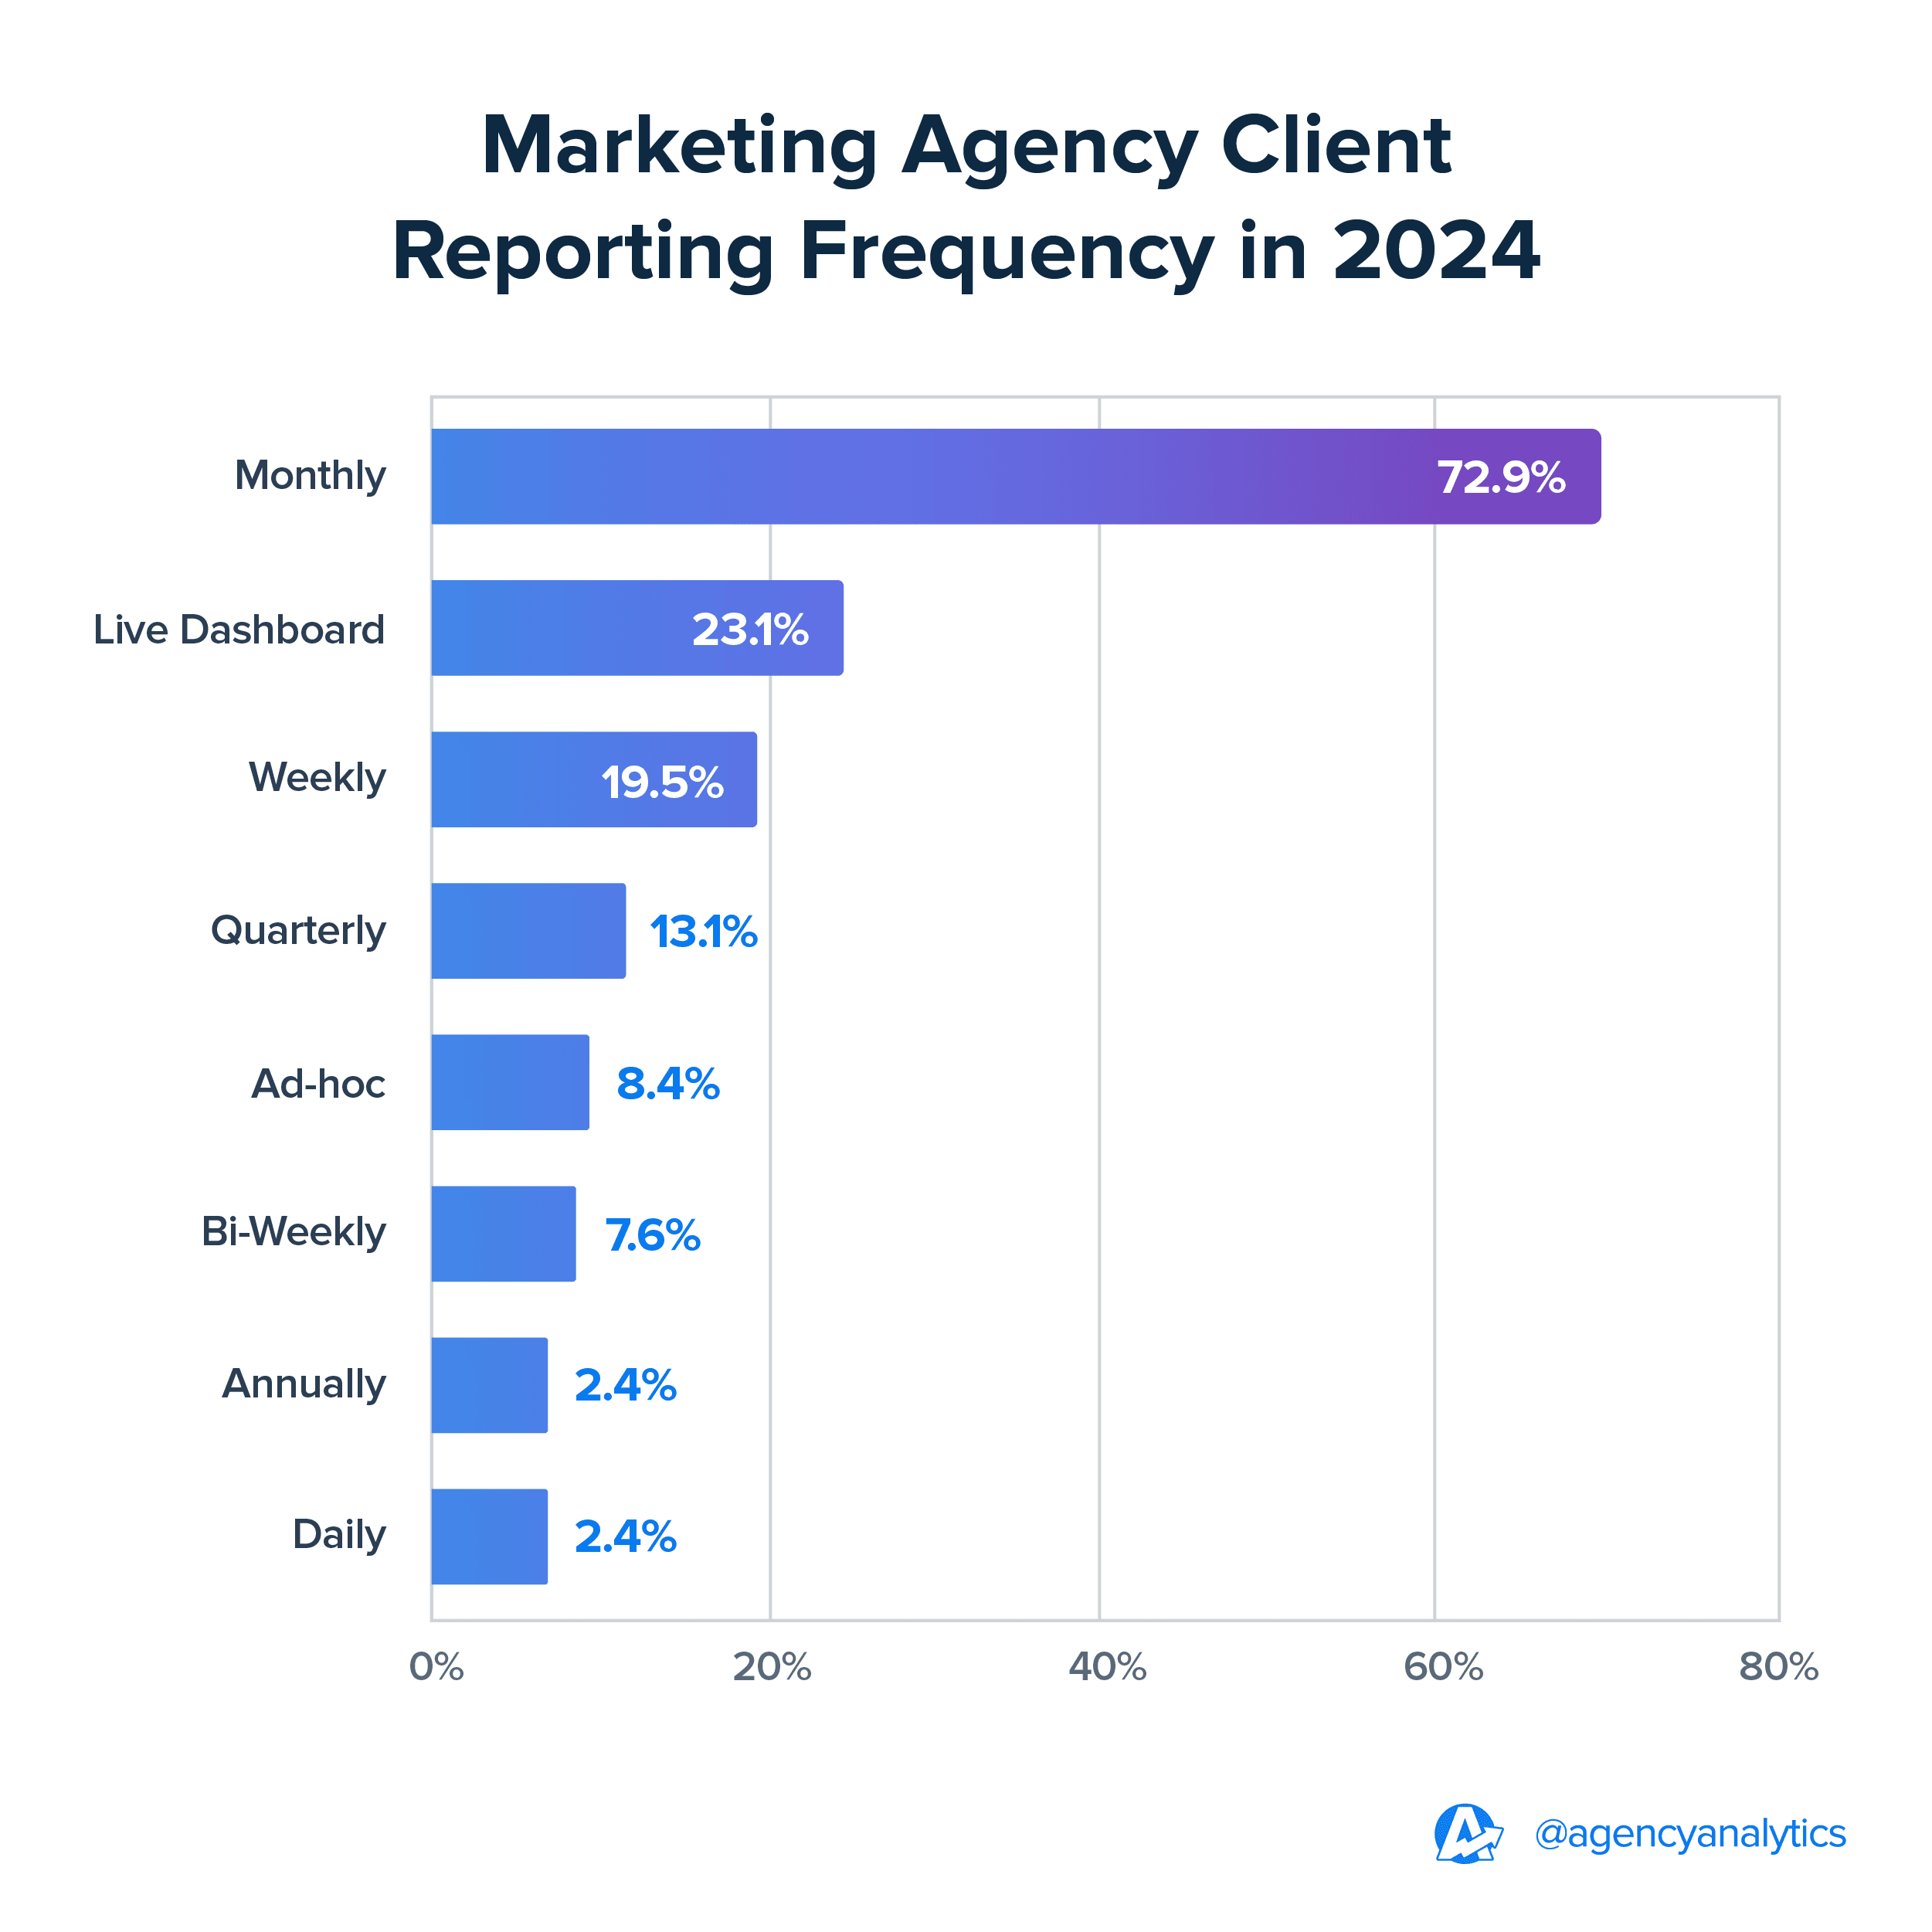
Deciding on reporting frequency allows for better collaboration with your clients while helping create clear reporting deadlines for your team. The AgencyAnalytics Marketing Benchmarks Report showed that most agencies opt for monthly reporting, though some clients may prefer quarterly or bi-weekly reporting.
4. Create a Template
Reporting templates allow marketing agencies to provide consistent, comprehensive reporting while saving time deciding. AgencyAnalytics makes it easier to create effective Salesforce templates customized to each client.
When creating your template, it’s important to:
Include Real-Time Data: Up to date numbers are key when showing a full picture to your clients. It’s a good idea to include a historical overview to add context to your metrics.
Choose a Reporting Platform With White Label Capabilities: AgencyAnalytics allows agencies to add their branding to each report, creating a professional feel.
Leverage Automated Reporting: AgencyAnalytics’ Smart Reports feature allows agencies to build reports in 11 seconds based on each client’s personalized needs.
5. Pick Your Chart Types Carefully
Visuals should add clarity to your reports. Add data visualizations like a report chart and graphs to highlight trends, compare historical data, and ensure clarity. For example, if you’re aiming to show trends over time, you would go with a line graph over a pie graph.
6. Double Check Your KPIs and Metrics
Once you’re putting your report together, it’s good to confirm that the KPIs and Metrics are telling an accurate story and properly showcasing key Salesforce data. It’s easy to get caught up by vanity metrics, which don’t show the full picture. For example, focusing only on leads isn’t enough to tell a client whether a campaign is working. Instead, it’s important to include how many of those leads are MQLs and SQLs.
7. Include Goals and Annotations
When creating a Salesforce report, it helps to add goals and annotations, or notes, to your template. This provides context to your reporting, allowing clients to better understand the impact of the data. With AgencyAnalytics, add goals and annotations to your reports to demonstrate progress to clients and underscore any additional items that need to be highlighted.
8. Stay Flexible
While templates do follow a certain format, it’s essential to allow room for any necessary adjustments as client goals evolve. For example, if a client decides to shift their focus to customer retention instead of lead generation, your template will need to be flexible enough to reflect that change.
A Dependable Platform for Better Reporting
Salesforce provides a long list of key metrics, but without the ability to make sense of these metrics, it’s hard to tell a full story that resonates with your clients. AgencyAnalytics helps agencies create comprehensive, seamless reports through:
Intuitive visualization features
Over 80 marketing platform integrations with industry-leading partners, including Salesforce.
The goals and annotations feature, which allows agencies to add important context to their reports
Ask AI and AI Summaries, two features that use the power of AI to help agencies surface deep insights in seconds flat.
AgencyAnalytics allows for easier, faster reporting, saving your team both time and money in the long-term. Sign up for a free 14-day trial today.


Written by
Rita Poliakov is an experienced content writer with a knack for storytelling. As a former journalist, she's a skilled researcher, interviewer, and grammar nerd.
Read more posts by Rita PoliakovSee how 7,000+ marketing agencies help clients win
Free 14-day trial. No credit card required.


