Table of Contents
QUICK SUMMARY:
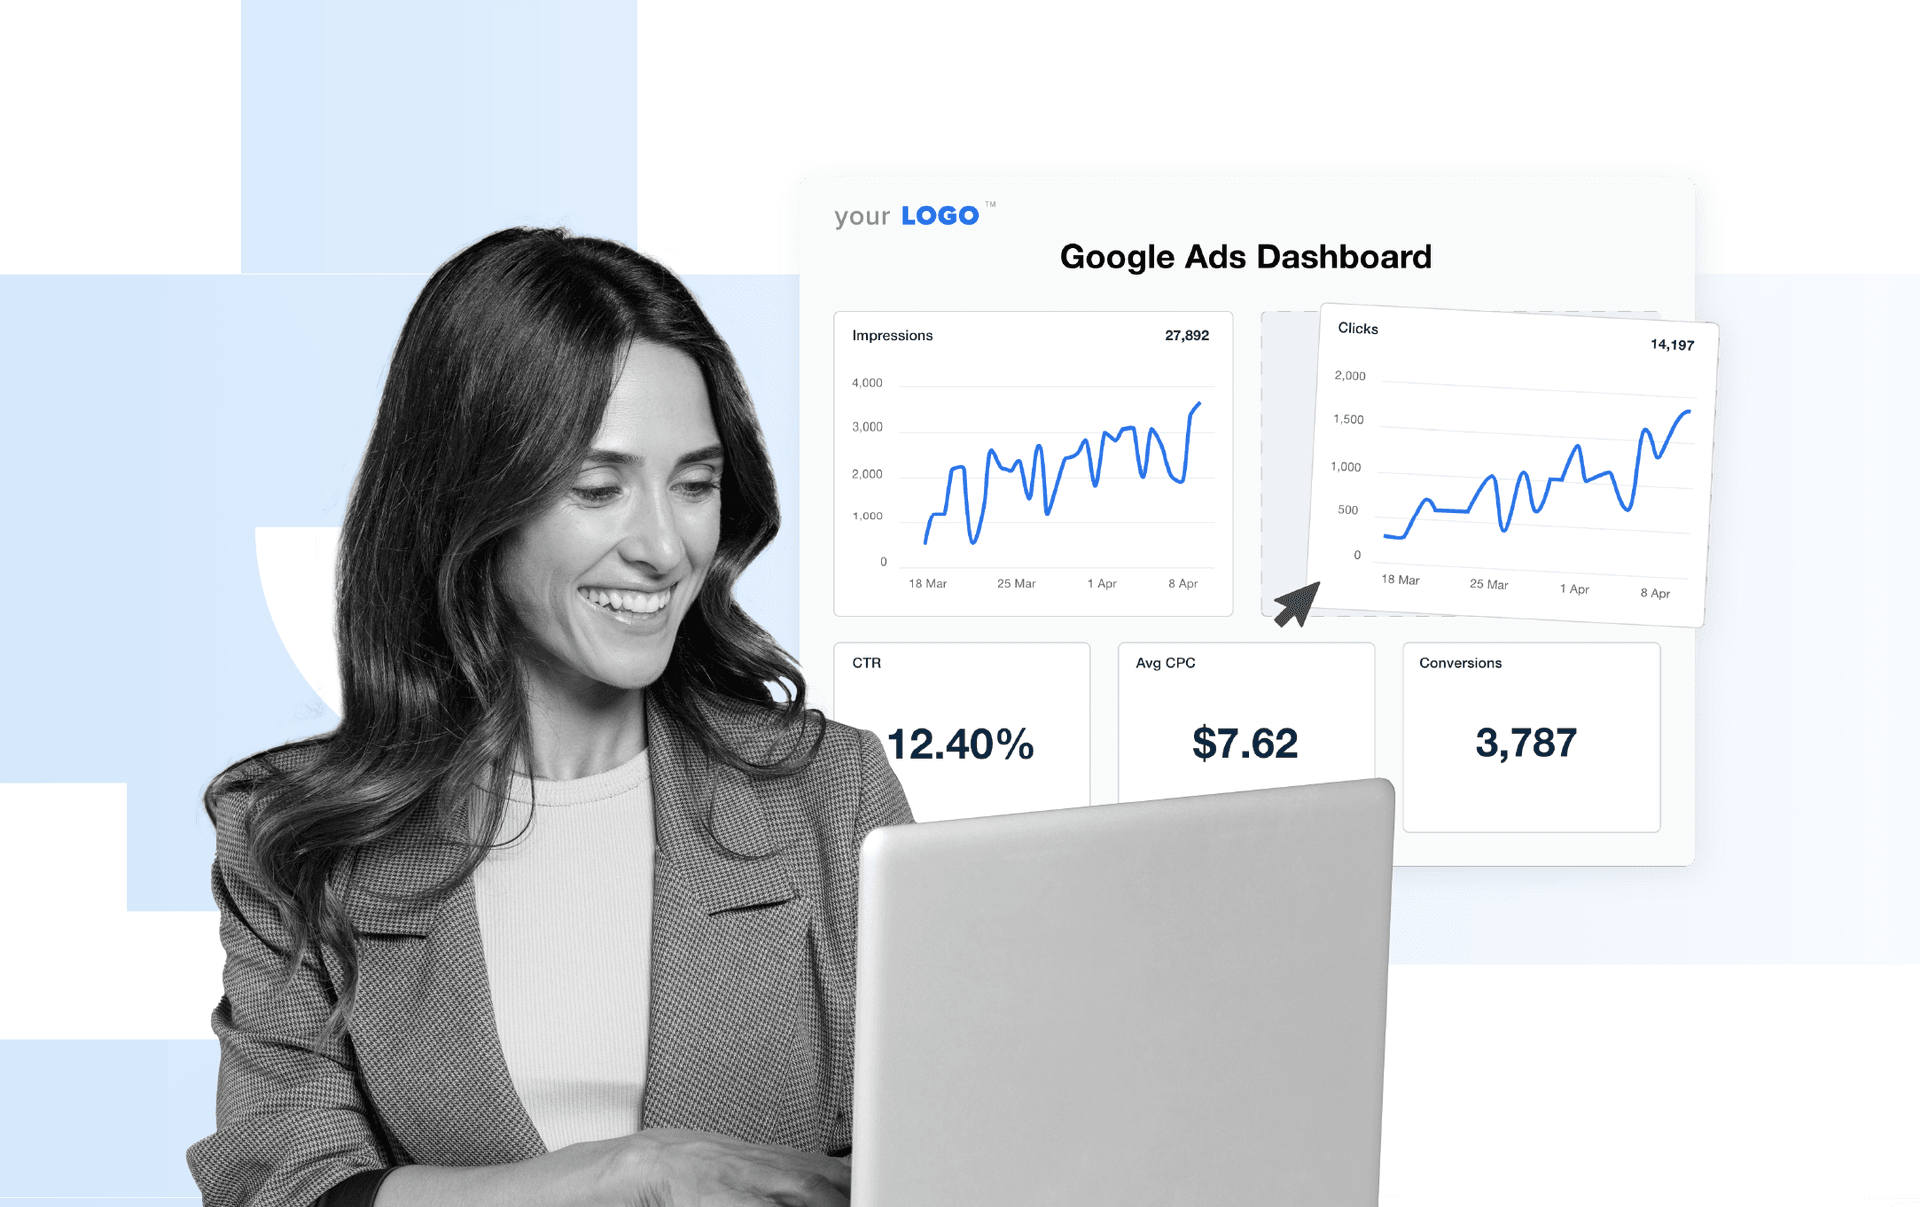
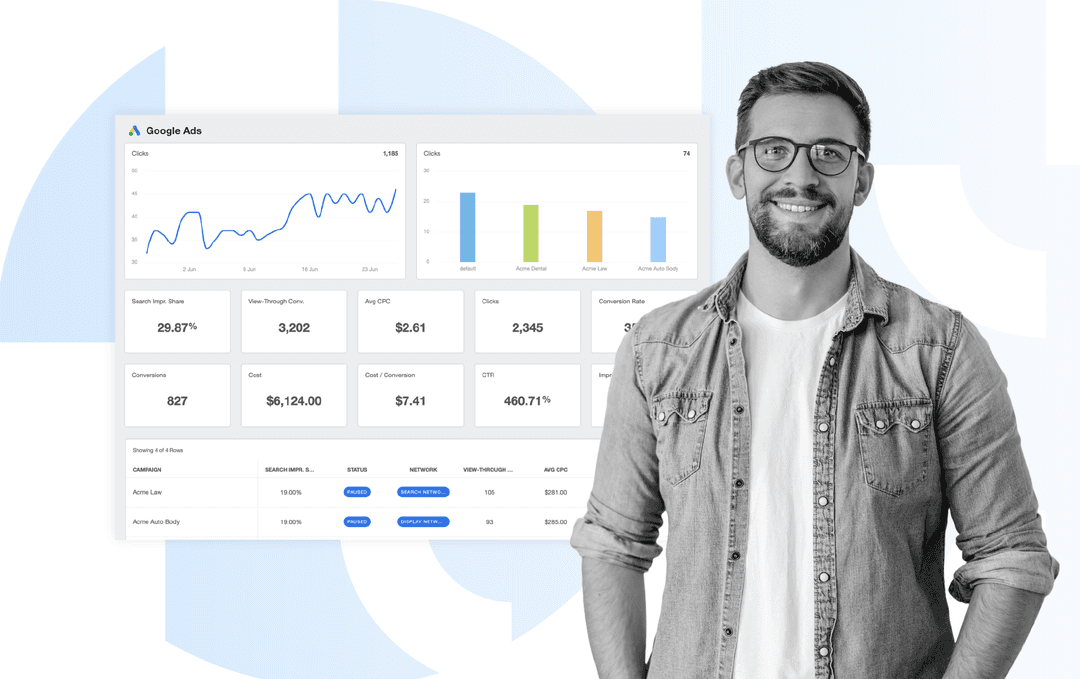
A Google Ads report compiles key campaign performance data from a given period and presents it in a clear, client-friendly format. It’s used to identify trends, optimize strategies, and track the performance of these advertising campaigns. This article explores essential steps for building effective Google Ads reports, along with the importance of using a client reporting tool to streamline data tracking.
Client reporting is one of the most effective ways to prove your agency’s value. For Google Ads in particular, clients expect visibility into budget allocation, performance outcomes, and the factors driving clicks.
That’s why the reports you deliver need to be more than a collection of numbers. A well-structured Google Ads report helps clients understand results, spot opportunities for improvement, and see the direct impact of their investment. This document reflects your agency, too. It’s a way to demonstrate expertise, set a high standard, and show why you’re worth partnering with.
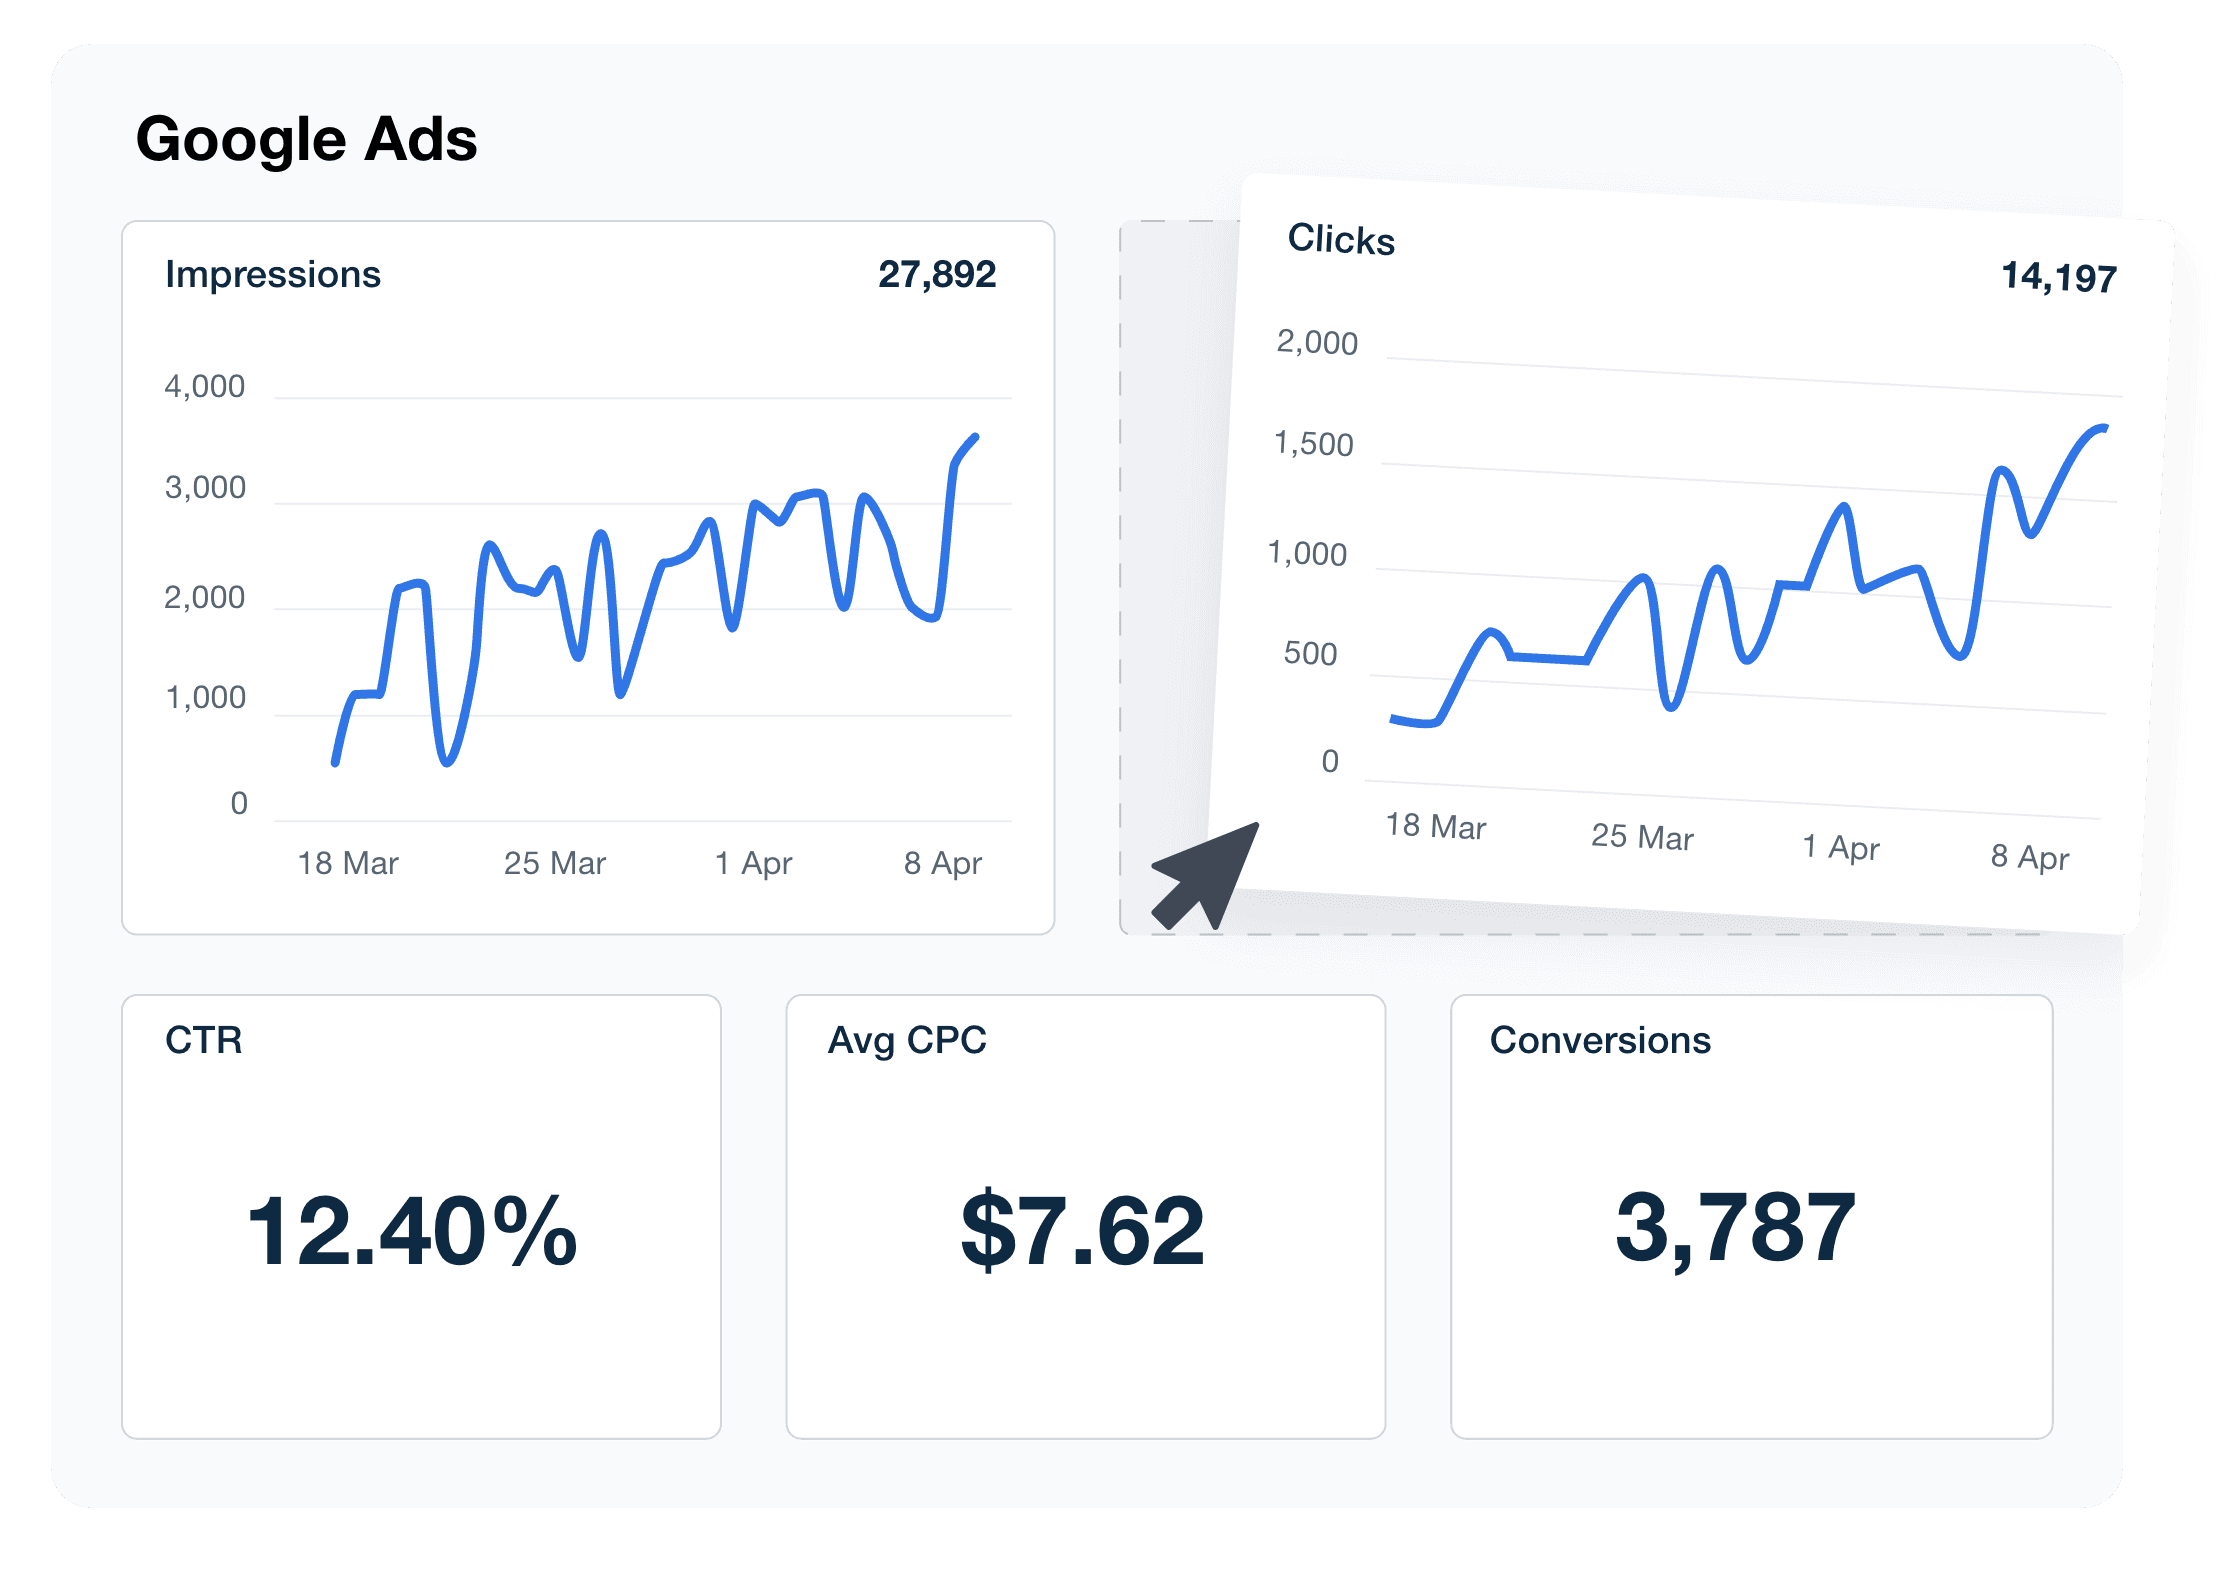
Not quite sure how to create an effective Google Ads report? In this article, we’ll share the most important data to include, common challenges (along with how to overcome them), and the importance of using a client reporting tool to streamline the entire process.
What makes a great Google Ads report?
A great Google Ads report gives clients a clear picture of how their campaigns are performing and the impact on their bottom line. Most clients invest in these campaigns to drive clicks, generate leads, and increase conversions–sometimes with the added goal of outperforming competitors.
Whether it highlights top-performing keywords, breaks down ROI by campaign, or flags areas for budget reallocation, each Google Ads report should reflect the client’s priorities and answer the questions they care about most.
We don’t just build reports in a vacuum and hope they stick; we listen closely to what our clients say, whether it’s through casual check-ins, formal reviews, or those offhand comments about what’s working (or not). It’s their real-world input that keeps us sharp and ensures the reports stay relevant and useful.
Ryon Gross, CEO, Local Leap Marketing
With that in mind, every standout Google Ads report should have the following qualities:
Clarity: It’s easy to understand, the data is well-visualized, information is presented intuitively, and the structure is logical.
Relevance: The selected metrics connect directly with the core objectives of the campaign. Even better if the metrics were agreed upon before launch!
Customization: Report data should be tailored to the client's specific needs, goals, and preferences. While pre-built templates speed things up, there should always be a level of personalization.
Transparency: A clear breakdown of their Google Ads budget allocation, ad spend, and results should be included. It's important not to hide any data, even underperformance or campaign hiccups. Instead, show how your team plans to iterate, improve, and achieve better results.
Actionability: Beyond tracked metrics, include next steps and your recommendations moving forward. This shows your agency’s ability to be proactive and future-oriented.
By adopting this approach, you’ll communicate results with clarity, improve campaign performance, and show the true value of your team’s work.
Types of data to include in your Google Ads performance reports
Google Ads tracks many metrics, but you don’t need to include everything in your reports. What matters most is highlighting the data that directly connects to your client’s goals.
Each Google Ads metric tells a different part of the story, and the right mix gives a clear picture of campaign performance. Here are some of the key metrics worth focusing on:
Impressions: Impressions are the total number of times your client’s ads were displayed on Google search. This is a good metric for measuring reach and tends to indicate that you’ve selected good target keywords.
Clicks: This is the number of times users clicked on your client’s ads. Clicks help assess whether users are actually visiting a website, landing page, web store, or other destination link.
Click-through rate (CTR): Click-through rate is the ratio of clicks to impressions, expressed as a percentage. A high CTR indicates that your client’s ad is reaching the right target audience, conveying the right message, and/or catching the attention of users with compelling ad copy and visuals.
Conversions: This metric tracks the number of desired actions users take after clicking on your client’s ads. Conversions could be a measurement of purchases, forms submitted, sign-ups, services requested, or something else. Usually, a conversion reflects the point where a lead becomes a customer.
Cost-per-click (CPC): This is the calculation of the average cost paid for each click on your ads. Monitoring CPC helps your agency optimize ad spend to ensure a better ROI for your clients.
Cost-per-action (CPA): This metric represents the cost associated with each conversion that comes from your client’s Google Ads campaigns. Again, this is a way to measure ROI and optimize campaigns accordingly.
While these metrics are a great starting point, they're just that—a starting point. A great report should go deeper by analyzing Google Ads data over time and drawing meaningful conclusions.
This is where a third-party client reporting tool makes all the difference. It’s a way to pull data across your tech stack and craft reports with metrics from other platforms (e.g., Google Analytics, LinkedIn Ads, Meta Ads).
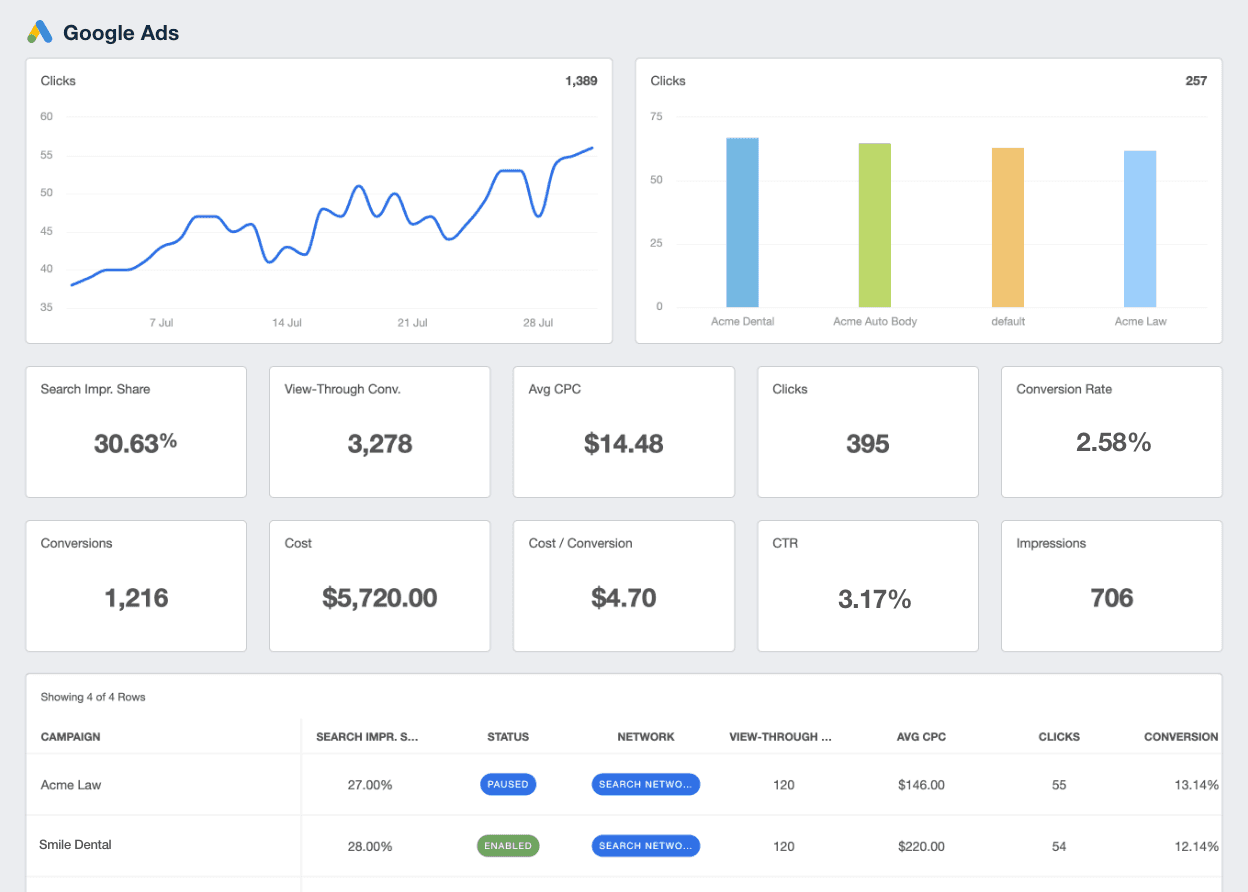
Quit wasting billable time and start creating custom Google Ads reports in minutes! Invest in a reporting tool that doesn’t freeze up with increased data volume–try AgencyAnalytics, free for 14 days.
4 common challenges of creating Google Ads reports
Of course, there's a reason why you've ended up on this page looking for ways to improve Google Ads reporting. Here are some common challenges agencies face when putting reports together and how to overcome them.
Challenge | Description | Solution |
|---|---|---|
Data overload | It might be overwhelming and hard for your team to interpret all the data in Google Ads. | Focus on select metrics that align with your client's goals and use clear visualizations to simplify complex data. |
Misunderstanding metrics (like Quality Score) | Clients may place too much emphasis on metrics such as Quality Score. They could treat them as end goals rather than diagnostic tools. | Instead of reporting on a metric like Quality Score in isolation, connect it back to tangible KPIs (e.g., conversions, ROAS). That way, clients will have a broader context. |
Lack of context | If data is presented without context, it's easily misunderstood. | Include annotations in reports to provide context and highlight how data relates to client objectives. |
Limited insights | Reports that only present raw data lack substance and depth. | Use trends, comparisons, and marketing benchmarking to provide a meaningful analysis and recommendations. |
By addressing these challenges upfront, you’ll create Google Ads reports that are easier to understand and more impactful for clients.
8 best practices for building Google Ads reports
Creating effective Google Ads reports requires thoughtful planning and a clear understanding of your client's objectives. Here are some ways to provide insights that matter and show clients the impact of their marketing efforts.
1. Establish goals and KPIs upfront
Start by discussing the campaign’s goals with your client, which ensures everyone is on the same page. This early alignment sets a clear direction, helps manage expectations, and keeps the conversation goal-oriented.
This is also the time to define the most important performance metrics, such as CTR, CPC, conversion rate, or ROAS. With this foundation in place, your reports will show progress toward client objectives and highlight opportunities for optimization.
Agency example
Imagine your agency is managing a Google Ads campaign for an ecommerce client focused on driving sales. By establishing a target conversion rate, average purchase total, or specific revenue goal upfront, you’ll both have the same framework for evaluating the campaign's success.
2. Select metrics wisely
Google Ads offers endless data points, but that doesn’t mean you need to share them all. Clients care about a handful of metrics, so focus on those instead of overwhelming them with irrelevant numbers.
Vanity metrics tend to show some of the ignorance that you see in the industry from time to time. There are some who like to gloat, but don't have much to show.
They are grabbing for shoestrings. Those who know the difference are able to actually make a difference. For example, a vanity metric might be showing that your Google Ads have a certain percentage of a click-through-rate (CTR).
But, an actionable metric might be the actual conversion rate. Or, even better, the cost per click as opposed to the actual cost per acquisition. Nathan Hawkes, President, Arcane Marketing
As a best practice, avoid including too many data points that distract from the bottom line. Also, be sure not to narrow in too closely on a single metric without showing the bigger picture–it’s truly a balancing act.
Agency example
Say your agency is managing a lead gen Google Ads campaign for a B2B business. Tracking metrics like cost-per-lead and lead conversion rate would be more relevant than simply focusing on impressions.
3. Schedule reports in advance
Establishing a clear reporting schedule benefits both sides. Clients know when to expect updates, while your team avoids last-minute scrambles and unnecessary ad-hoc reporting.
For best results, choose a cadence that balances your client’s need for updates with your ability to provide tangible results. For example, clients may prefer weekly reports to monitor budget pacing and geographic performance for a specific campaign. On the other hand, monthly reports could be a better option for assessing long-term campaign ROI.
Sending reports monthly provides clients with an overview of what was achieved and gives campaigns time to set and normalize. Although it is nice to check in on a campaign weekly, sometimes it is better to get a macro perspective of how the campaign went in order to determine its success. Ariene Dionela, Digital Media Account Director, Connections Marketing
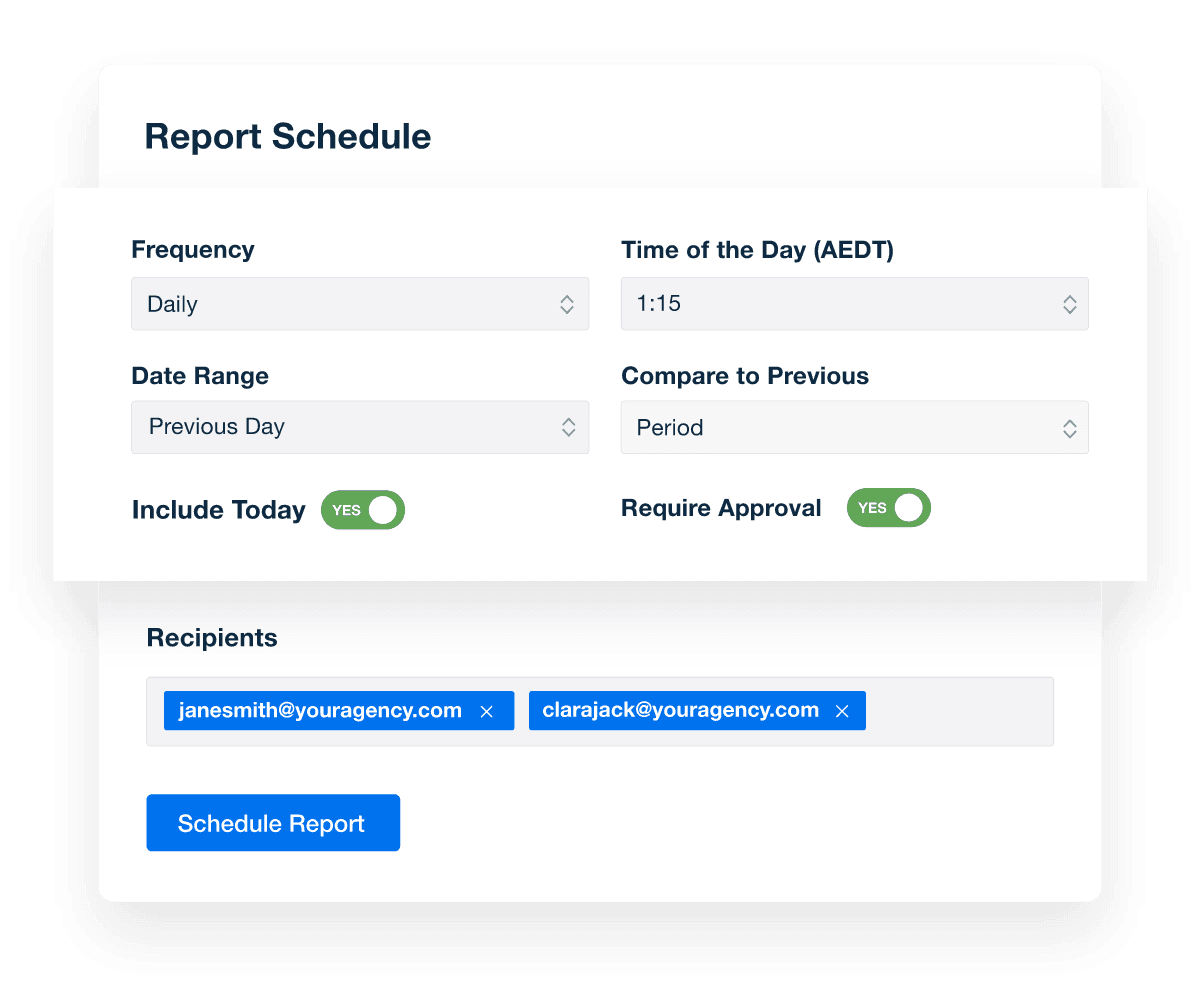
Want to set up an automated reporting schedule and alleviate the manual work for your team? AgencyAnalytics puts your client reporting on autopilot—try it free for 14 days!
4. Build your Google Ads report template
Creating a template streamlines the reporting process and ensures a uniform presentation of data. This saves your team time, reduces the chance of errors, and creates a consistent brand experience for clients. To make the most impact, your template should include:
An executive summary: Start with a concise overview that highlights outcomes, trends, performance by campaign type, and recommendations. This gives clients a quick, high-level understanding before diving into the details. To speed up the process, use a reporting tool that generates a customizable AI summary.
A full overview of campaign performance: Provide a snapshot of core metrics like impressions, clicks, conversions, and cost-per-acquisition, along with historical comparisons to show progress over time.
White labeling: Keep reports on-brand by including your agency’s logo, colors, and style elements. This extra step adds a touch of professionalism and reinforces your identity.
Customizable sections: Add space for client-specific KPIs or campaign goals. That way, each report feels relevant and personalized without the need to start from scratch.
If you’re not in the mood to create a report from the ground up, use a ready-made Google Ads template. With AgencyAnalytics, it’s also possible to generate a one-click Smart report, which autopopulates with your client’s metrics in just 11 seconds. The best part? They’re both fully customizable!
5. Pick the right chart types
Charts make complex data easier to understand, but the type you choose matters. The right visualization highlights the story you want the data to tell—whether that’s growth, comparisons, or distribution. For example, use:
Line charts to show trends in clicks or conversions over time.
Bar charts to compare campaign or ad group performance side by side.
Pie or donut charts to illustrate budget allocation or device breakdowns.
Matching the data to the right chart type ensures your report is clear, engaging, and actionable for clients.

Agency example
For an ecommerce client running multiple Google Ads campaigns, a line chart will show how conversions rose during a holiday promotion, while a pie chart highlights how budget was split across channels. Together, these visuals give clients a clear view of both performance trends and spending distribution.
6. Share real-time data
Providing clients with real-time access to campaign performance builds trust and makes check-ins more productive. When clients can check performance before a scheduled call, you’ll have more time to discuss strategy, optimizations, and next steps.
We believe that transparency and communication are key to a successful agency-client partnership. To do this, we make sure that our clients are always informed about the progress of their campaigns and have access to the data they need to make informed decisions.
Daniel Dye, President, Native Rank
Worried about sharing too much? With AgencyAnalytics, it’s easy to create custom login profiles, set user permissions, and customize dashboards as needed. That way, clients only see the data that’s relevant to them.
7. Add goals and budget-tracking insights
Include a dedicated section in your reports that tracks progress toward campaign goals, whether that’s reaching a lead generation target, hitting a sales milestone, or keeping cost per acquisition within the benchmark. This helps clients quickly see if results are on track with their objectives.
Budget pacing is equally important. For example, if a campaign has used 70% of its budget halfway through the month, it may require adjustments to stay on track (e.g., reducing daily spend). Keeping an eye on both of these elements reassures clients that their investment is being properly managed.
Track dynamic goal progress, monitor ad spend, and make timely adjustments when needed. Try the goal and budget-tracking feature in AgencyAnalytics–it’s free for 14 days.
Remember, reporting isn’t one-size-fits-all–every client and Google Ads campaign is different. Use these best practices as a guide, but don’t be afraid to adapt your approach when circumstances call for it.
Make Google Ads client reporting your agency’s superpower
As we’ve covered, creating an effective Google Ads report doesn’t happen by chance. Instead, it’s about having the right approach. For best results, remember to:
Decide on campaign goals upfront: Define what success looks like, whether it’s lead volume, sales revenue, or maintaining a target cost per acquisition.
Choose metrics that reflect those goals: Focus on actionable KPIs like conversions, ROAS, or CTR, depending on the client’s priorities.
Use data visualizations that tell a story: Line charts, bar graphs, and pie charts make it easier to understand performance at a glance.
Provide sufficient context: Explain performance shifts, highlight trends, and recommend clear next steps to keep progress on track.
With a tool like AgencyAnalytics, you don’t need to scramble between multiple Google Ads accounts or spend hours manually compiling spreadsheets. Instead, it’s a solution designed to streamline reporting and save your team valuable time. Fully customize dashboards as needed, blend data from 80+ platforms, and even access first-party data benchmarks—all in one place. Ready to give it a try? Start your free 14-day trial today.
FAQs about Google Ads client reports
Still have questions about Google Ads reporting? Here’s everything you need to know to create fast, insightful client reports.
A Google Ads report for clients should include performance metrics that highlight what's working and what needs improvement. Focus on KPIs like CTR, cost per conversion, bounce rate, and ROAS. Use visual elements like pie charts or bar charts to make insights clear. Predefined reports and custom report templates make it easy to align your reporting process with each client’s brand and advertising strategies.
The most effective Google Ads reports prioritize clarity over clutter. Start with performance metrics that align with your client’s KPIs—CTR, conversion rate, ROAS, and cost per acquisition.
Segment the data by ad groups to pinpoint what’s driving results. Use custom report filters to break down spend and conversions by device, location, and keyword intent.
Bounce rate and engagement metrics from Google Analytics provide context for post-click behavior. Add visuals like pie charts or bar charts to help clients quickly see how their budget translates into business impact.
Native Adwords reports lack flexibility. With automated tools like AgencyAnalytics, you schedule reports, layer in multiple data sources, and use the report editor to deliver visual, branded custom reports—no spreadsheets required.
Unlike native Google Ads reports, it's easy to add cross-channel data, annotations, and white-label designs—saving hours per report while delivering all the data and confidence your client needs.
Yes, AI tools simplify the reporting process by analyzing google ads data and surfacing trends automatically. Integrated AI reporting tools help you interpret fluctuations, highlight underperforming ad groups, and suggest optimizations—turning raw data into strategic insights in less time.
Instead of manually scanning reports, you get AI-assisted insights on what’s working, what’s not, and how to improve. Combine this with your own strategic context, and you have a faster, smarter reporting process.
Using old-school Google Adwords reporting software or Google’s native tools, it may take 2+ hours per client. With AgencyAnalytics, agencies create a client report in under 30 minutes. Predefined report templates, automated data connectors, drag-and-drop widgets, and AI-powered insights streamline the entire reporting process.
Google rebranded Google Adwords to Google Ads in 2018. The change reflects broader ad inventory beyond search—like YouTube, Display, and Shopping. But many still refer to it as Google Adwords, especially when discussing legacy workflows or when searching for Google Adwords reporting software. Today’s reporting tools must adapt to a multi-network, multi-device ad landscape.
Find the Google Ads report template, along with dozens of other template examples, in the Templates section. It’s built for client-facing conversations, not just raw data exports.
The template organizes metrics by objective, includes campaign-level breakdowns, and uses clean visualizations to help clients immediately understand what’s working. It’s a great starting point if you’re building your reporting process from scratch—or want to improve what you already have.
Absolutely. Google Ads tells you what someone clicked. Google Analytics tells you what they did next. Combining both gives you a complete view—from ad impression to on-site conversion.
It also helps identify gaps, like high bounce rates on landing pages or poor engagement by device type. For any client tracking lead quality or user behavior, including GA data isn’t optional—it’s essential.
The best way is to use a reporting platform that supports automated scheduling. Once you’ve built a client’s report—complete with visuals, commentary, and custom branding—set it to send weekly or monthly without all of the data wrangling.
Look for tools that connect directly to your client's Google Ads account, update data automatically, easily add professional insights, and let you customize each report for the client’s preferences.

Written by
Kyra Evans is the Manager of Content Marketing at AgencyAnalytics. She has over 15 years of experience writing content for SaaS, tech, and finance brands. Her work has been featured by HuffPost and CBC, and she serves an engaged social media readership of over 30,000 community members.
Read more posts by Kyra EvansSee how 7,000+ marketing agencies help clients win
Free 14-day trial. No credit card required.


![The Ultimate Google Ads Optimization Checklist [Guide & Tips] An Easy to Follow Guide to Google Ads Optimization + a Downloadable Checklist](/_next/image?url=https%3A%2F%2Fimages.ctfassets.net%2Fdfcvkz6j859j%2F1RGRDTvZOx2bH3PCJMjDsD%2Fc239f0aed512ea0e761f3713dd6e59ac%2FGuide-to-Google-Ads-Optimization-Checklist.png&w=1920&q=75)
