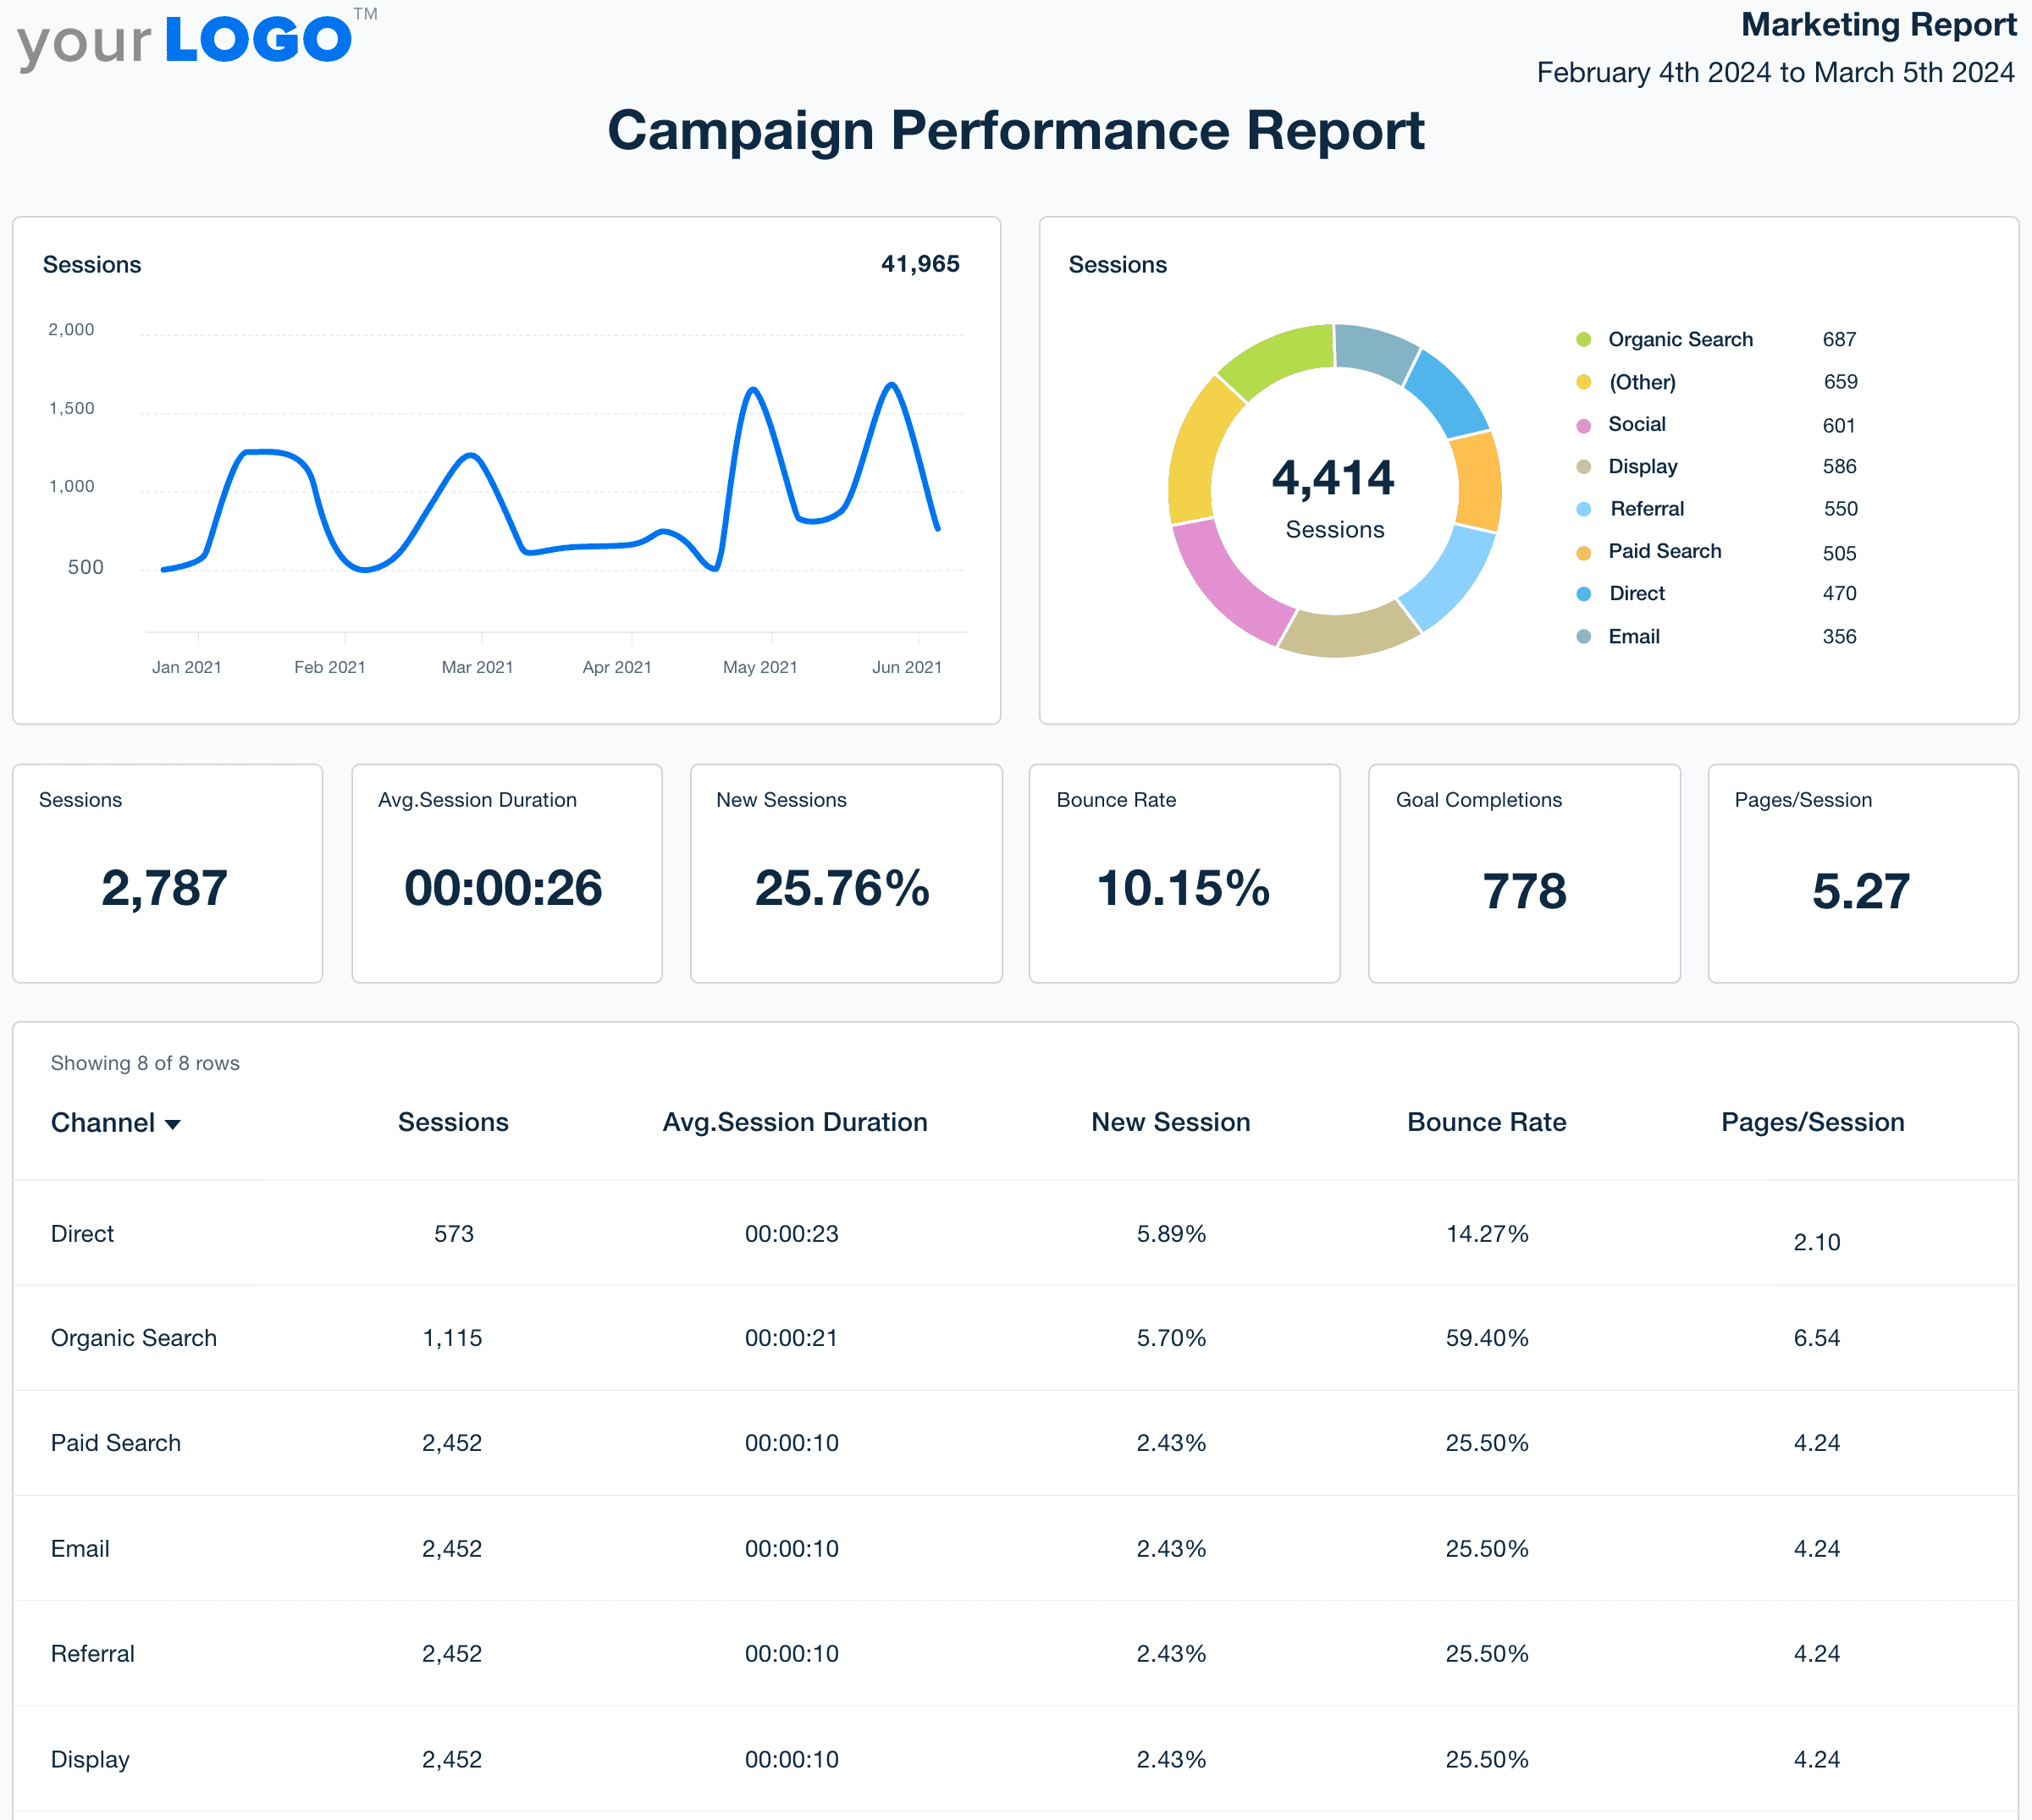
Campaign Performance Report Template
Why Your Agency Needs a Campaign Performance Report Template
As a marketing agency, billable time is of the essence. A campaign performance reporting template cuts through the chaos and streamlines report generation. It saves time by automating data collection, which results in less manual hassle and human error. Essentially, it’s a way to tighten up internal processes, improve reporting quality, and ensure consistency.
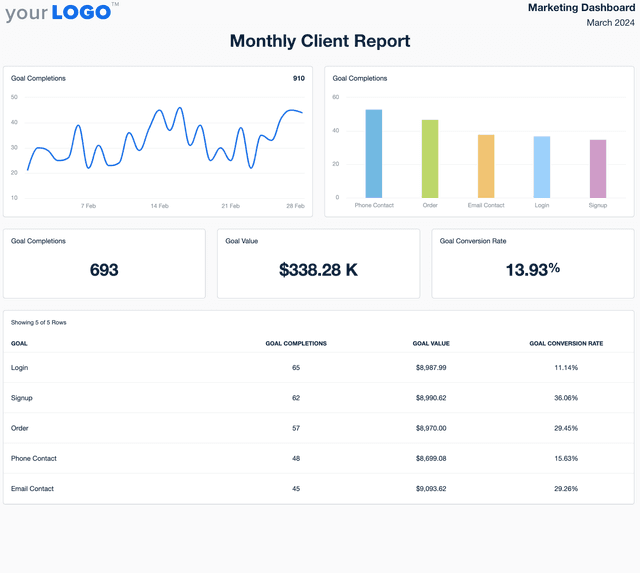
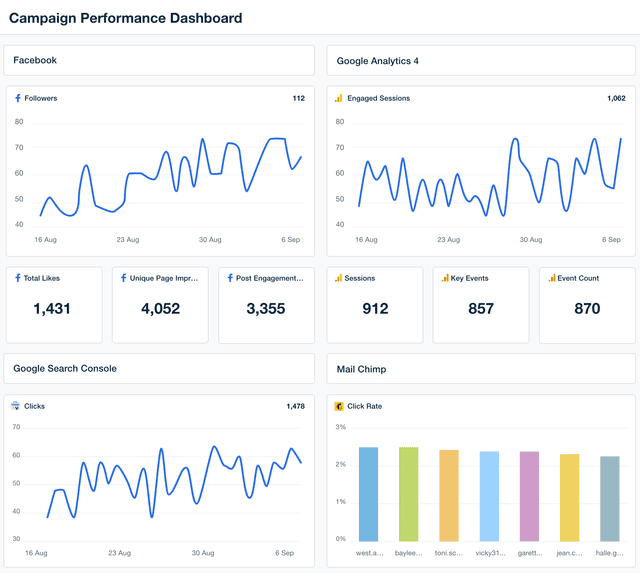
With this marketing report template, quickly highlight key performance indicators and any achieved results. It’s a way to show clients exactly what you’ve worked on and earn their trust over time. Plus, the template’s visual elements make it easy to understand complex data and demonstrate the full value of your agency’s services.
In short, a Campaign Performance report template is an operational upgrade that boosts productivity and strengthens agency-client relationships. It maximizes billable time, maintains data transparency, and delivers actionable results.
Create Professional Campaign Performance Reports in Minutes
Start Your 14-Day Free Trial
8 Key Sections Included in a Campaign Performance Report
1. Cover Page
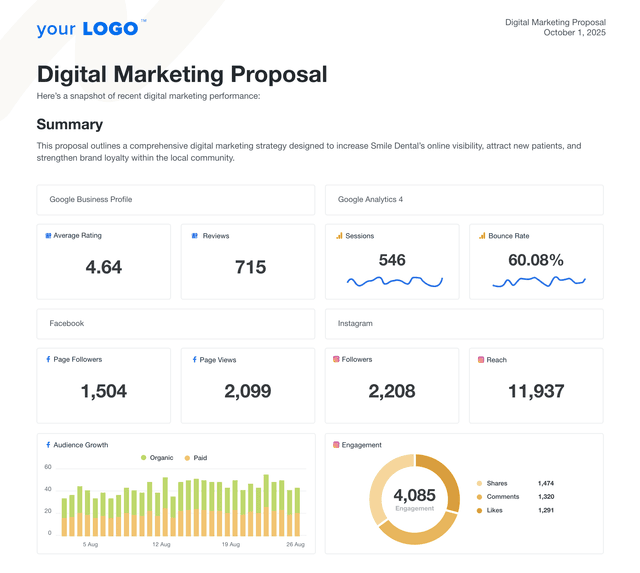
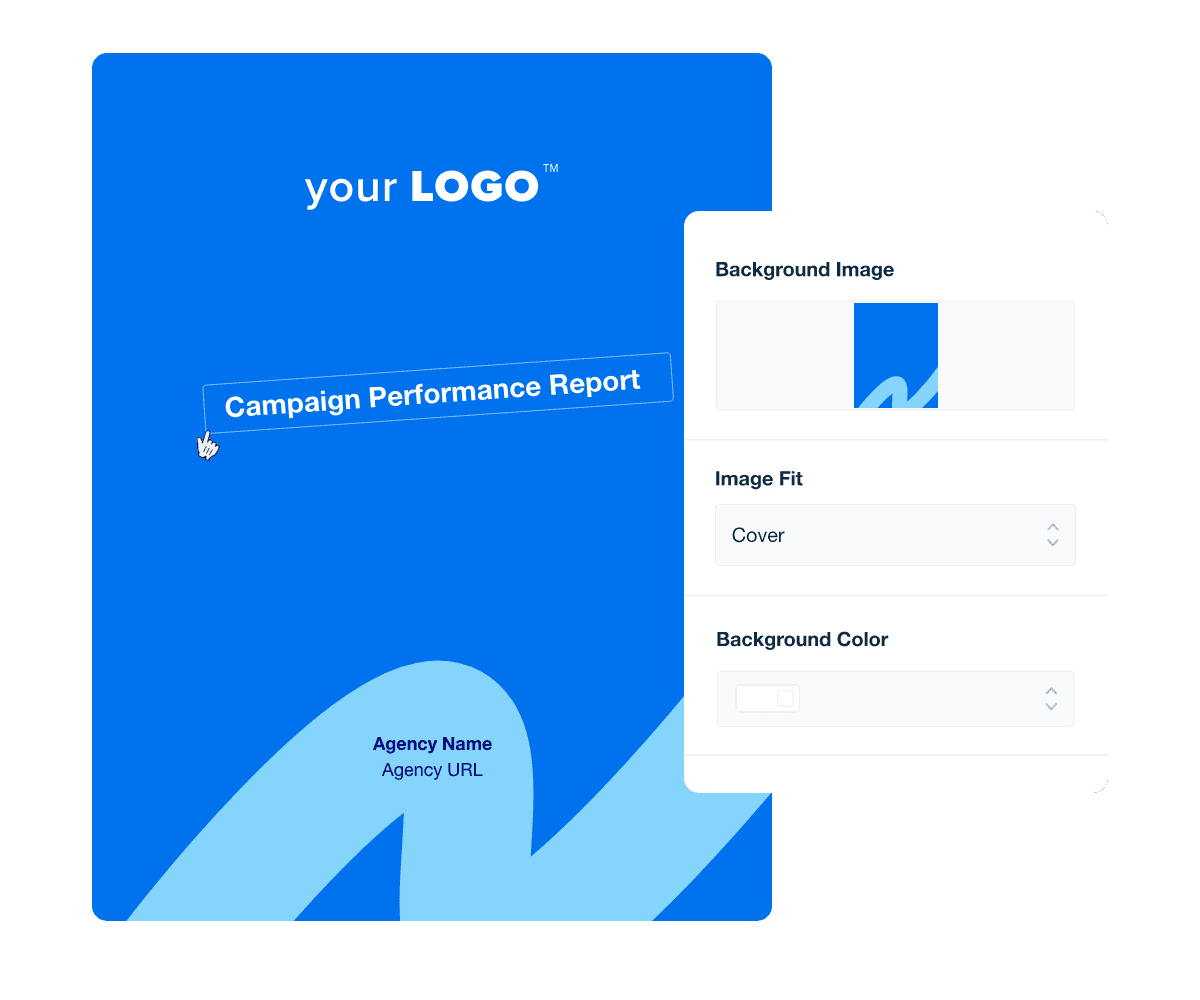
A well-designed report cover page goes beyond aesthetics. In fact, it’s a strategic way to showcase your agency’s brand and set the stage for insightful analysis.
Starting a report with a well-thought-out cover page shows professionalism, high standards, and a dedication to quality. As a best practice, it should also clearly communicate the data’s timeframe (e.g., the exact dates for the weekly marketing report template). This extra step provides clients with a snapshot of the report’s content.
Additionally, cover pages are replicable and reusable. That means you don’t have to build them from scratch every time you send a monthly report template, quarterly marketing report, or whichever frequency your client prefers. This streamlines the report creation process, all while ensuring consistent branding across all communications.
In essence, a standout report cover–combined with the efficiency of templates–elevates your agency's image. It transforms each report into a powerful brand touchpoint, all while highlighting data and your attention to detail.
2. Executive Summary
An executive summary quickly highlights top takeaways, which is useful for clients or C-suite executives who want to get straight to the point. It shows that your agency is mindful of their busy schedules and ensures that key messages are communicated off the bat.
It’s also an opportunity to include any recommendations, which encourages clients to delve deeper into the report and explore the findings.
3. PPC Overview
A PPC overview includes key insights from your client’s paid advertising campaigns, like Clicks, Conversions, and Cost per Conversion. In essence, it shows the direct impact of these marketing efforts in meeting broader goals, such as generating qualified leads or boosting online sales.
This data is useful for evaluating a marketing budget, pinpointing the top-performing campaigns, and optimizing future strategies. It also justifies the value generated from PPC investments, which further reinforces your agency’s expertise.
To get the most from this section, consolidate all the data across your client’s PPC efforts. This provides a big-picture view of performance and identifies the most fruitful campaigns.
For agencies managing PPC campaigns, highlighting specific metrics helps showcase how well your team is optimizing ad spend and maximizing ROI. For example, the following are some essential PPC metrics that should be used in any PPC campaign performance report.
Metric | Importance | Example Use Case |
---|---|---|
Metric Cost | Importance Critical | Example Use Case Monitor overall spend to maintain budget compliance. |
Metric Clicks | Importance High | Example Use Case Track user interactions to assess the initial appeal of ads. |
Metric Conversions | Importance Critical | Example Use Case Measure the effectiveness of ads in driving desired user actions. |
Metric Return on Ad Spend (ROAS) | Importance Critical | Example Use Case Evaluate the profitability of ad campaigns to determine financial efficiency. |
Each metric provides insights into different aspects of campaign performance, from financial oversight to engagement and conversion success, essential for refining strategies and achieving marketing goals.
4. Traffic Overview by Channel
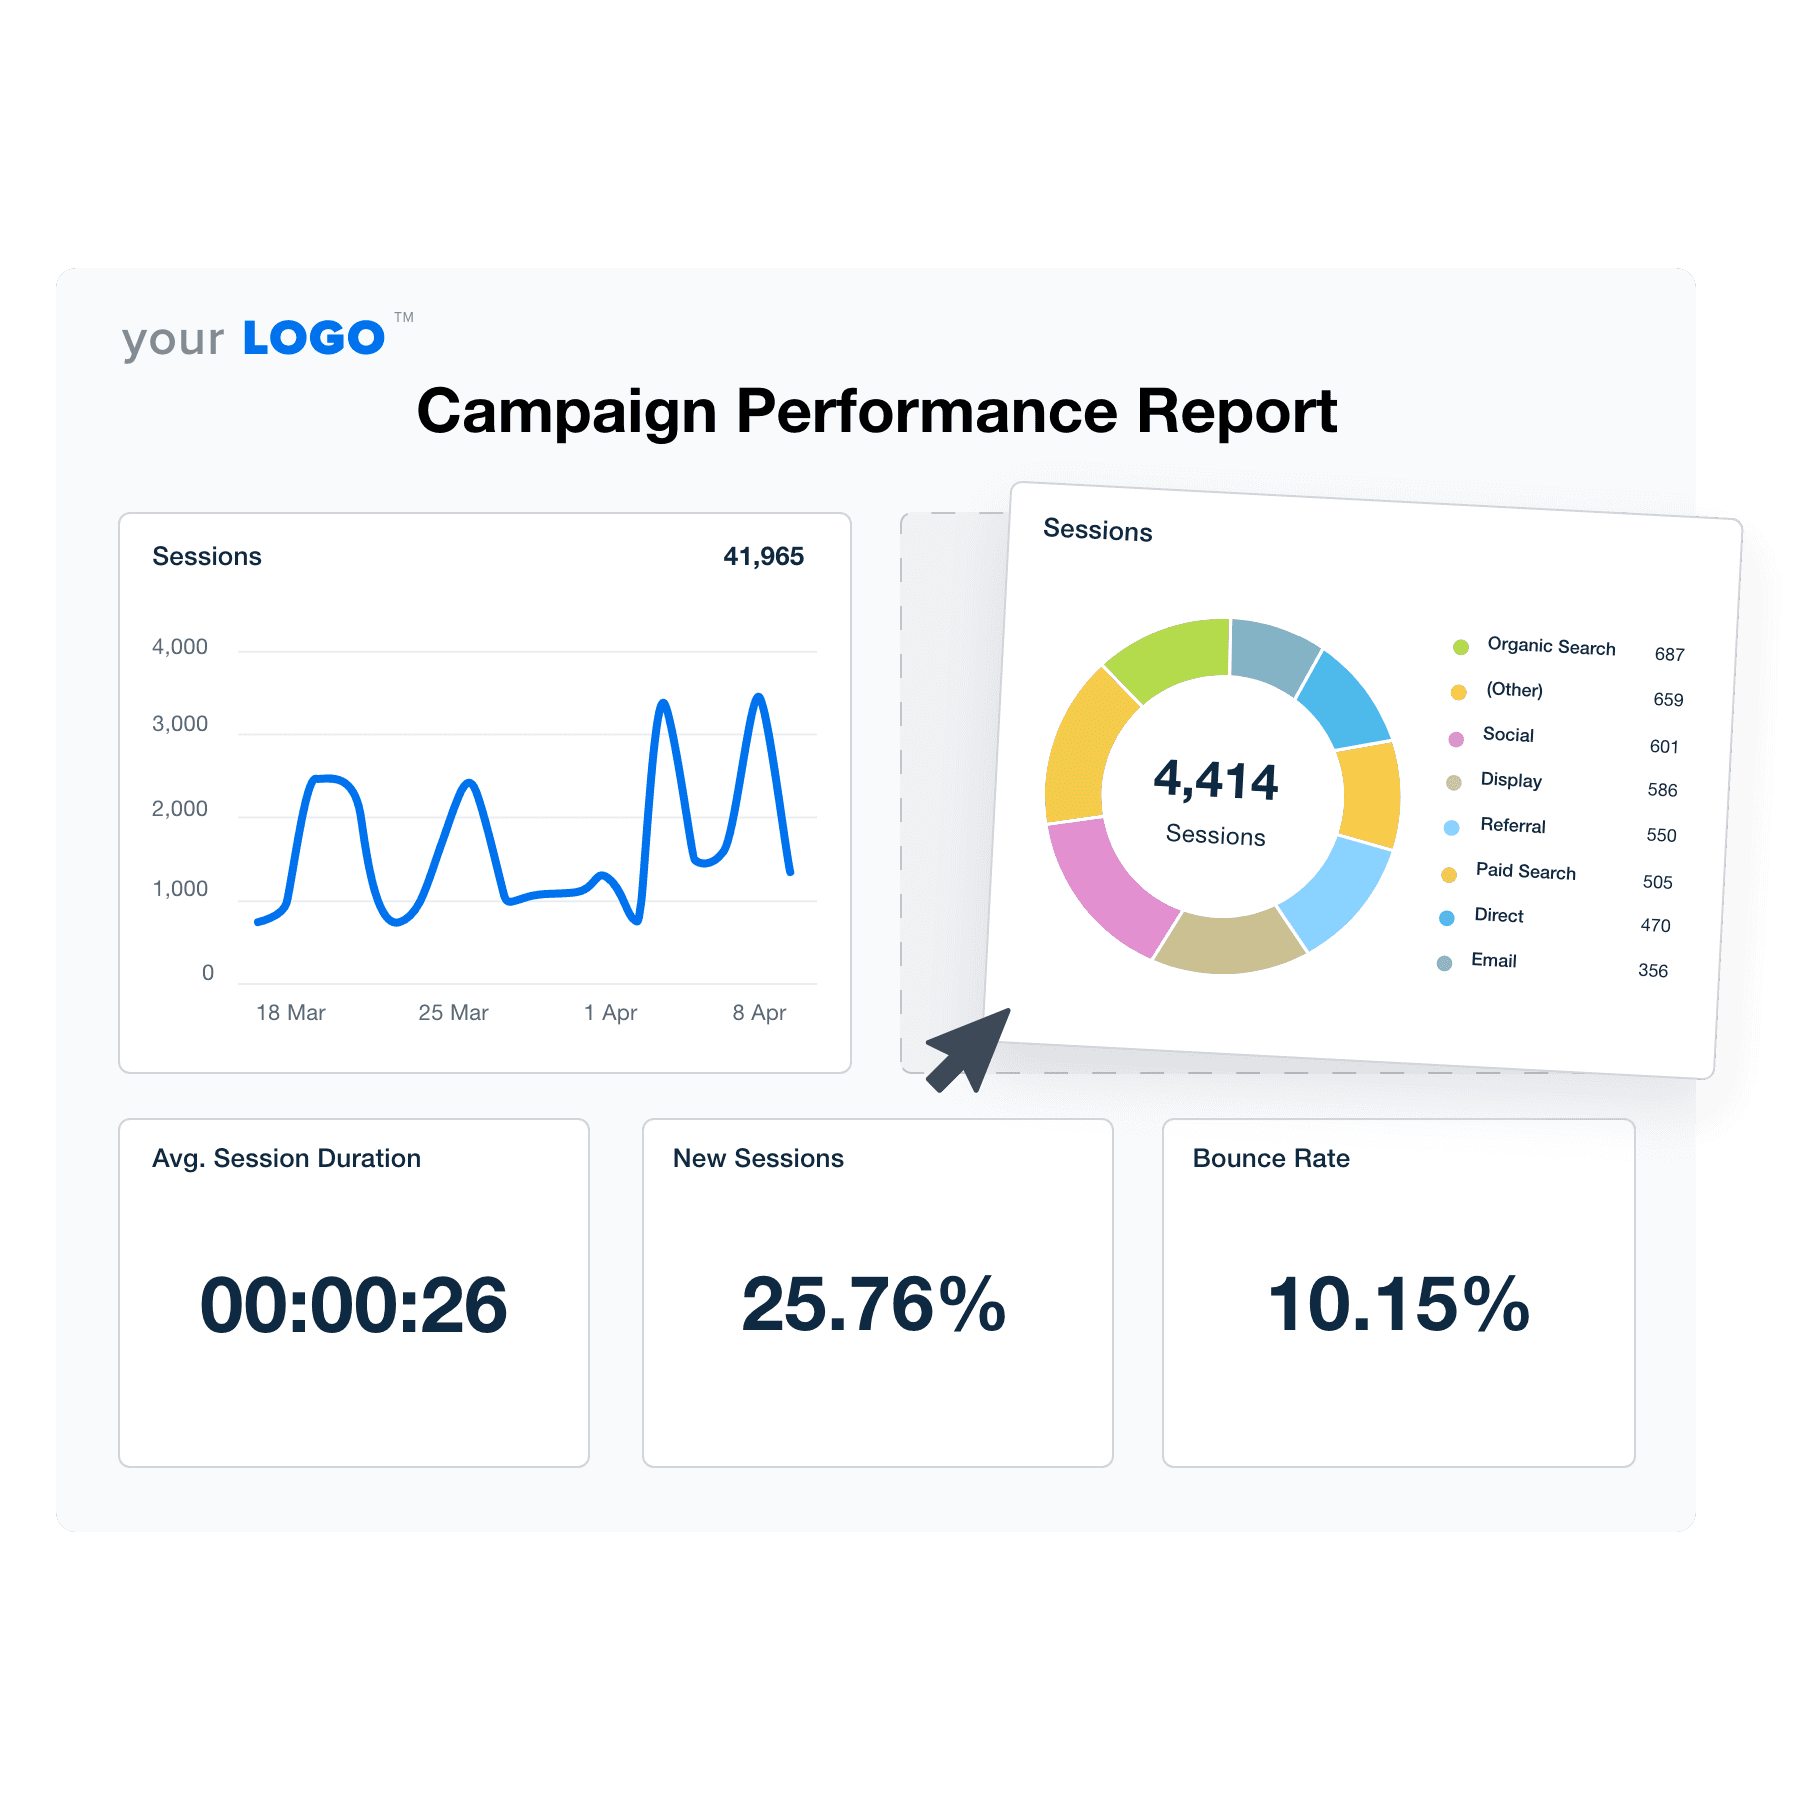
A Google Analytics traffic overview identifies the volume and sources of website traffic (e.g., organic search, paid search, direct visits, and referrals). In a nutshell, this data highlights how users find your client’s website and which channels drive the most engagement.
In addition, this section includes SEO metrics like Sessions, Average Session Duration, and Bounce Rate. Use this granular data to identify top-performing content and whether any improvements are needed (e.g., creating more relevant headlines to improve organic traffic).
For effective channel analysis, pay close attention to metrics that offer insights into user behavior and interaction with content across different marketing channels, such as:
Metric | Importance | Example Use Case |
---|---|---|
Metric Sessions | Importance Critical | Example Use Case Measure user visits to evaluate channel traffic volume. |
Metric Bounce Rate | Importance High | Example Use Case Analyze visitor engagement and content effectiveness. |
Metric Events | Importance Critical | Example Use Case Track interactions like clicks, downloads, and video plays to assess user actions. |
Metric Session Duration | Importance Important | Example Use Case Evaluate how long users stay engaged with content to gauge interest and content quality. |
Each metric provides specific insights that help in understanding user engagement patterns, effectiveness of the content, and overall channel performance. It’s also a way to demonstrate how website activity contributes to client goals, like increased brand awareness or conversions.
5. SEO Rankings
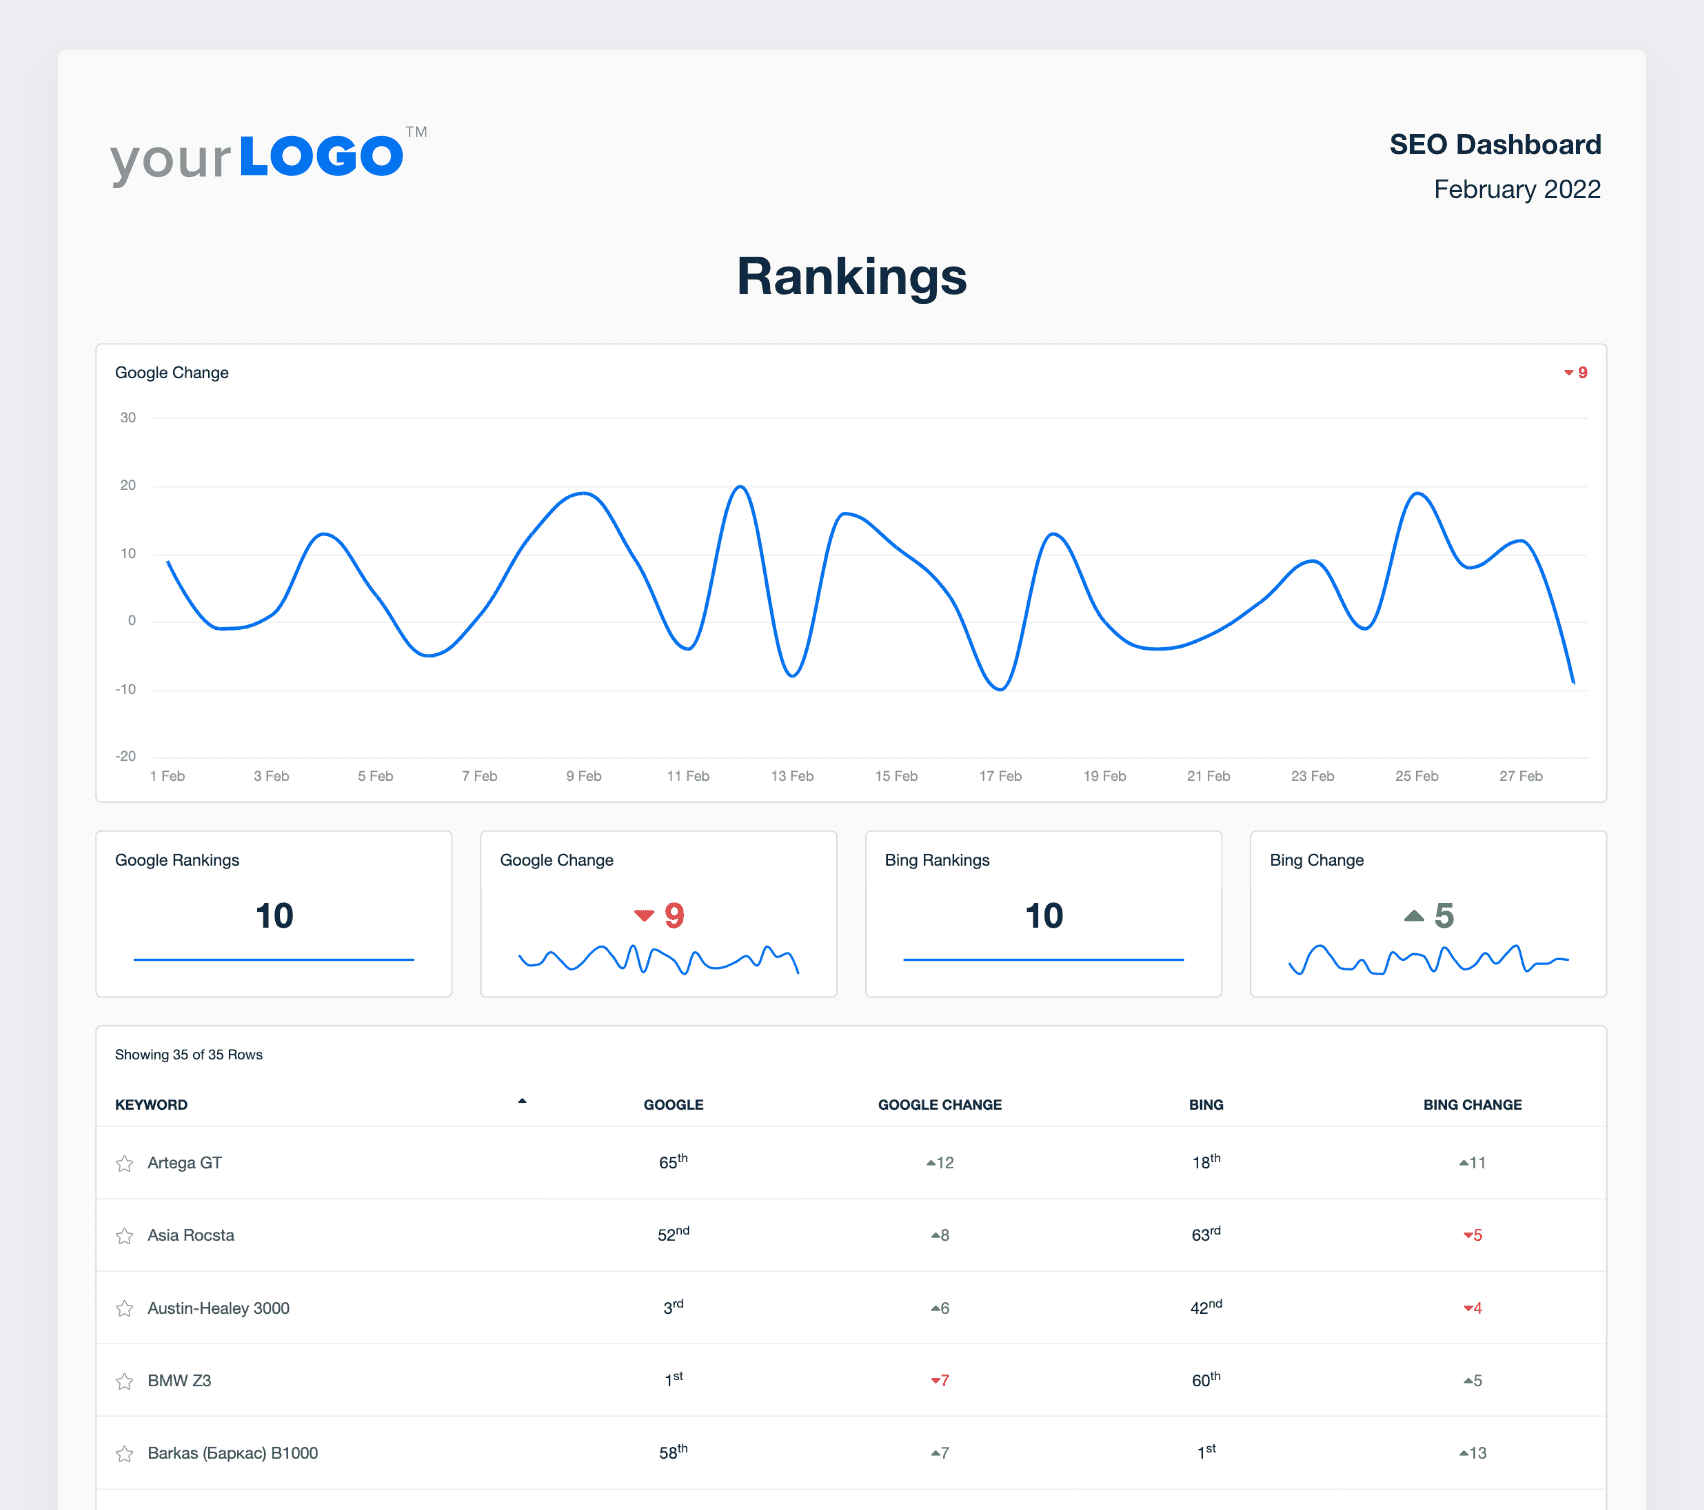
To prove the effectiveness of SEO strategies, incorporate ranking data into your client’s marketing report. It shows how your agency’s efforts are contributing to organic search visibility and increased website traffic.
In this SEO report section, include trends in search rankings, current positions, and any notable changes. Also, report on these essential metrics across multiple search engines (like Google and Bing).
Each keyword ranking metric offers valuable insights into how well keywords are performing in search engines, helping to guide SEO strategies and improve organic search visibility and traffic.
Metric | Importance | Example Use Case |
---|---|---|
Metric Average Rank | Importance Critical | Example Use Case Track the mean position of keywords to gauge overall SEO health and effectiveness. |
Metric Position Changes | Importance High | Example Use Case Monitor fluctuations in rankings to understand SEO volatility and react to algorithm changes. |
If there are any dips or anomalies in search rankings, brainstorm possible reasons and explore ways to improve SEO performance. For example, this may mean researching new keywords, exploring content marketing ideas (e.g., a relevant blog post series), or defining a new target audience.
To extract even more SEO insights, add data from Google Search Console to measure the impressions, clicks, and CTR for each ranked keyword.
Automated Client Reports. Ready in 30 Minutes or Less.
Spend Less Time Creating Reports and More Time Delivering Results
Start Your 14-Day Free Trial
6. Google Analytics – Breakdown of Social Media Channels
For a complete picture of your client's social media marketing impact, include a breakdown from Google Analytics. This analysis shows the website traffic that was generated per social media channel, demonstrating interconnectivity between various platforms.
This multi-channel approach shows that your agency considers the bigger picture when reporting on marketing campaigns.
All marketing teams should report on key metrics like the Number of Sessions per social media platform, Bounce Rates, and Goal Completions. Use these insights to analyze user behavior and determine the most viable social media platforms.
7. Email List Growth
Email List Growth measures the increase in email marketing subscribers over a specific period. It’s direct evidence of a growing customer base and the potential appeal of your client’s email content.
A thriving email list is also an opportunity to nurture leads, cultivate more brand interest, and increase conversion-oriented behavior.
This overview includes a breakdown of active, deleted, and unsubscribed users. It’s a way to assess list health and make any necessary changes (like creating more user-relevant content to reduce Unsubscribe Rate).
8. Email Campaigns
Beyond a growing mailing list, Email Campaign marketing analytics (like Open Rate, CTR, and Conversions) reveal deeper insights about audience engagement.
To uncover trends, include these key metrics in a monthly marketing report template. This gives your client’s email marketing efforts enough time to materialize, especially if users choose to engage with campaigns at a later date. Here’s an example of what these metrics look like in a marketing report template.
These marketing analytics also reveal areas for improvement. For example, a low Open Rate may mean adding catchier, shorter subject lines. On the other hand, a high Unsubscribe Rate might indicate that your client’s email marketing strategy needs a total overhaul (e.g., refining content and using segmented mailing lists).
Whatever the case, use these key metrics to improve marketing strategies and drive better results.
See the Campaign Performance Report Template in Action
Use This Professional Template To Create Client Reports in Minutes
View Template Demo
How To Create a Custom Campaign Performance Report Template To Meet Client Needs
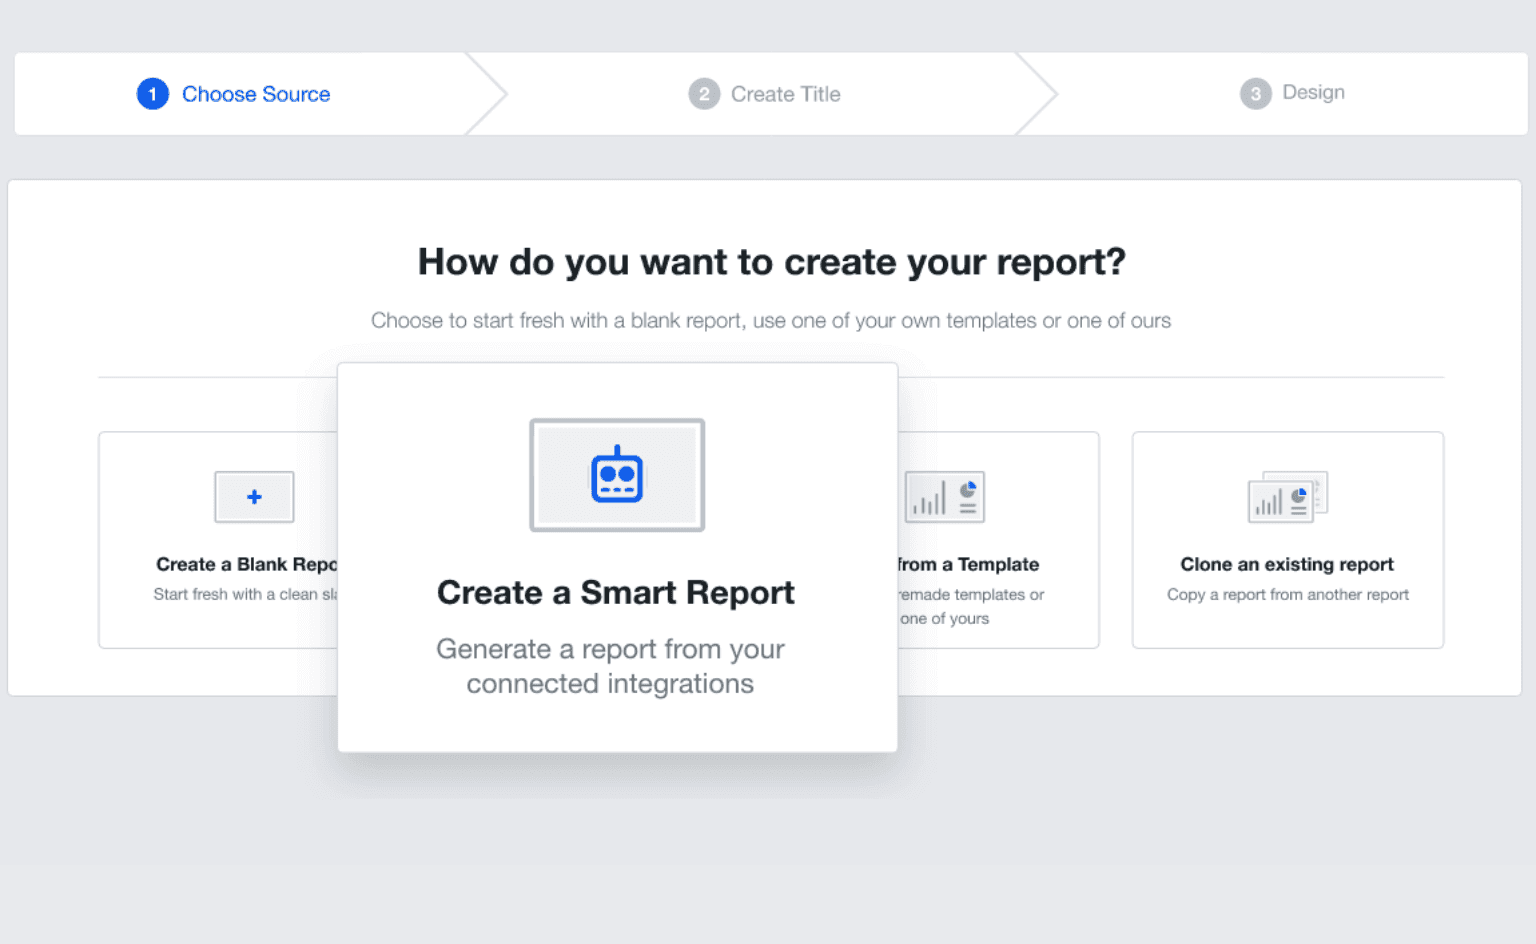
Need an extra touch of customization? Create a Smart Report in just 11 seconds! This feature automatically populates a report with the top metrics from a client’s custom integrations, which removes the hassle of building a report template from scratch.
Choose from over 80 integrations, including Google Ads, Microsoft Ads, Google Search Console, Facebook Ads, and more. To get started, log into your AgencyAnalytics account and sync your client’s marketing platforms. Then, click the ‘Create Report’ in the top right-hand corner, followed by ‘Create a Smart Report.’
It’s that simple. To customize your client’s Smart Report even further, simply drag, drop, and rearrange widgets as needed.
Does your marketing agency track metrics outside of these integrations?
Not to worry–use the Google Sheets integration to incorporate this data directly into client reports. Adding these insights is a quick and seamless process; just drag and drop widgets like before.
Aside from Smart Reports, there’s also the option to use pre-built reporting templates. Here are a few marketing report examples you’ll find in AgencyAnalytics:
General reporting templates, like:
A social media report template
A web analytics report template
A digital marketing report template
Platform-specific templates, such as:
A Facebook Ads report template
A Google Ads report template
A Google Analytics report template
Reporting on marketing KPIs has never been easier!
Automate Your Marketing Reports. Focus on What Matters.
Creating a well-crafted marketing report doesn’t have to be a painstaking process. In a few clicks, consolidate insights from social media platforms, paid advertising, and other marketing channels. Easily stream this data into marketing reports for intuitive data visualization and a professional finish.
Ensure your clients get a deeper understanding of their performance data each and every time. Use report templates to save billable time and create a replicable process. It’s the time-saving solution that every marketing team needs.
AgencyAnalytics is simply brilliant. By providing our clients with a sleek, easy-to-understand live dashboard, they are able to view their campaign performance and results any time they want. This gives them something tangible and adds value to the services we provide.
Daniel Emery
Save Time on Reports and Gain More Time for Strategy
Automate Client Reporting and Free Up Hours Every Month
Start Your 14-Day Free TrialMarketing Report Templates as Unique as Your Agency
Seamless Connectivity
All Your Reporting Tools in One Place
AgencyAnalytics automates collection across 80+ platforms. It’s a must-have for all marketing agencies to save time and maximize operational efficiency.
Invest in a centralized reporting hub and store client data in one place. Quickly access a complete overview of marketing performance, all in one place.
Reclaim Billable Hours
Automate Your Agency’s Reporting Process
AgencyAnalytics automates time-consuming reporting and eliminates manual data entry. No more laborious data collection–just a reporting solution that does the heavy lifting for you.
Win back billable hours, help clients meet their marketing goals, and strengthen your agency’s operations.
Your Success Toolkit
11-Second Smart Reports
For agencies, time is literally money. No need to waste it on manual report creation–use the handy Smart Report feature and get the job done in just 11 seconds.
Watch as your client’s marketing metrics automatically populate into a professional, custom report. Provide clients with data-driven insights without the headache of manual reporting.
Your Agency, Front and Center
Custom Branding on Every Report
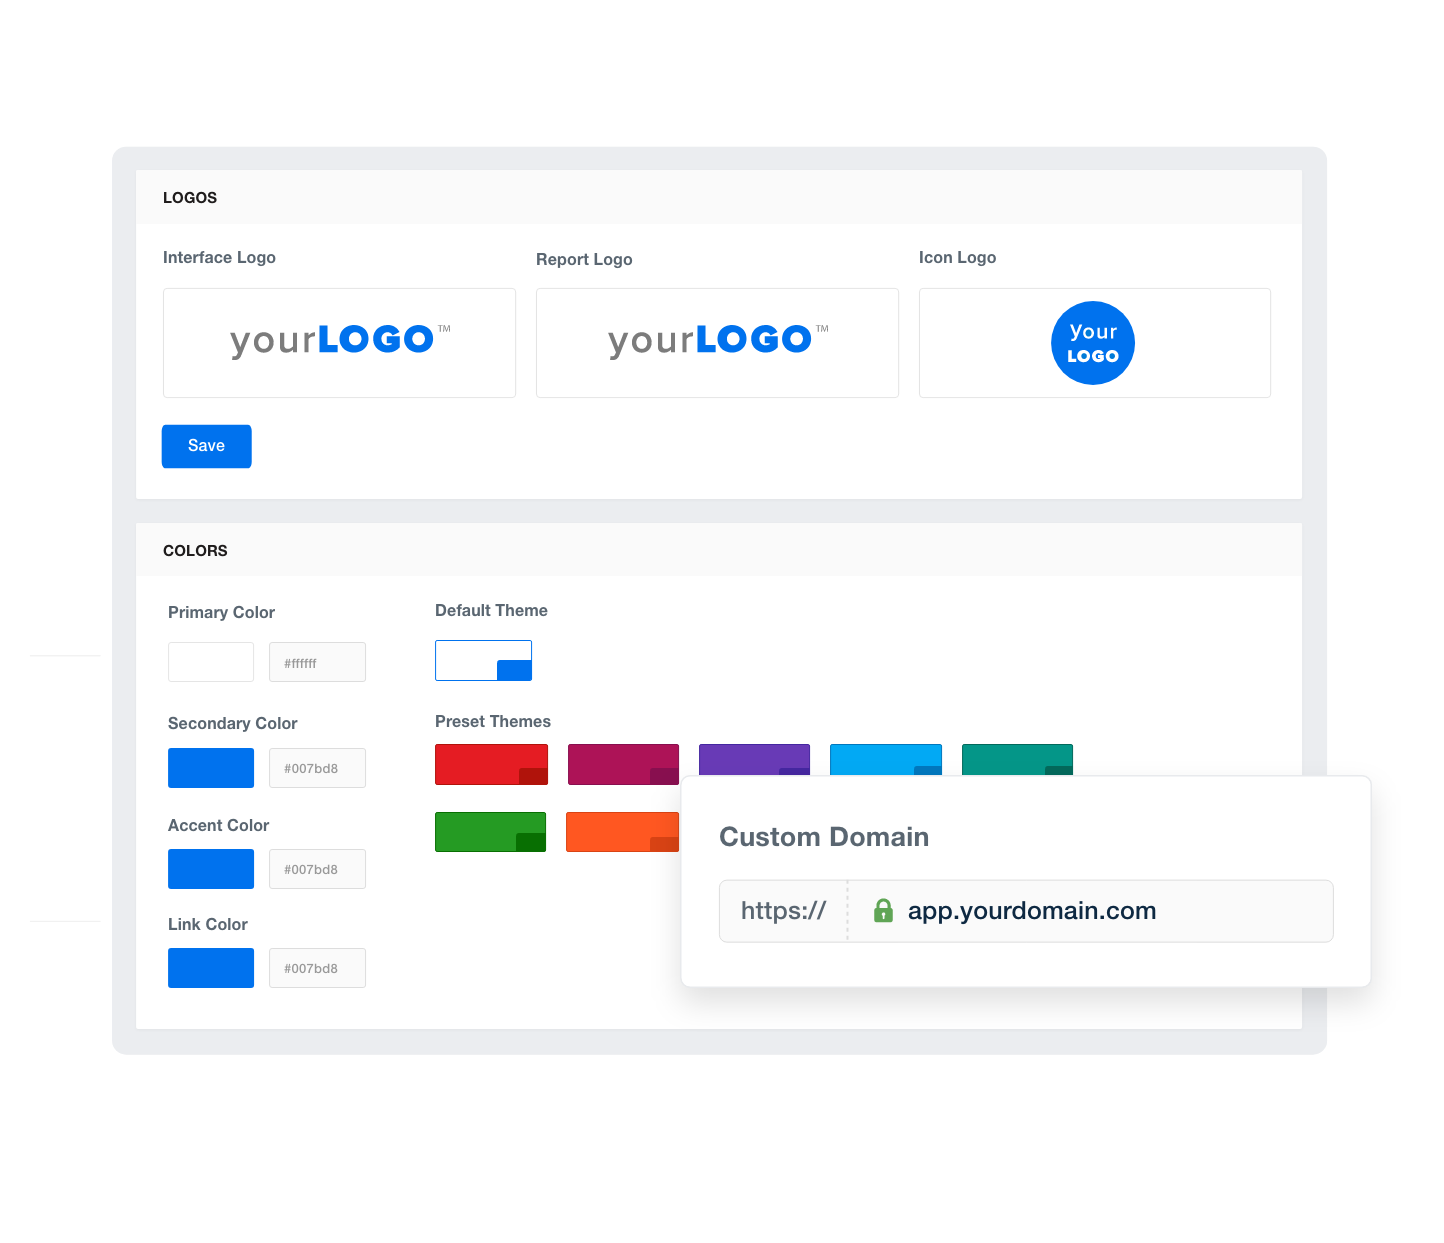
Build trust, recognition, and loyalty through white-labeled reports. Take things up a notch by adding your agency’s logo and brand colors.
Go a step further by adding a personalized cover page to each report. Solidify your identity and ensure brand recognition in every client interaction.
Always on Time
Put Campaign Performance Reporting on Autopilot
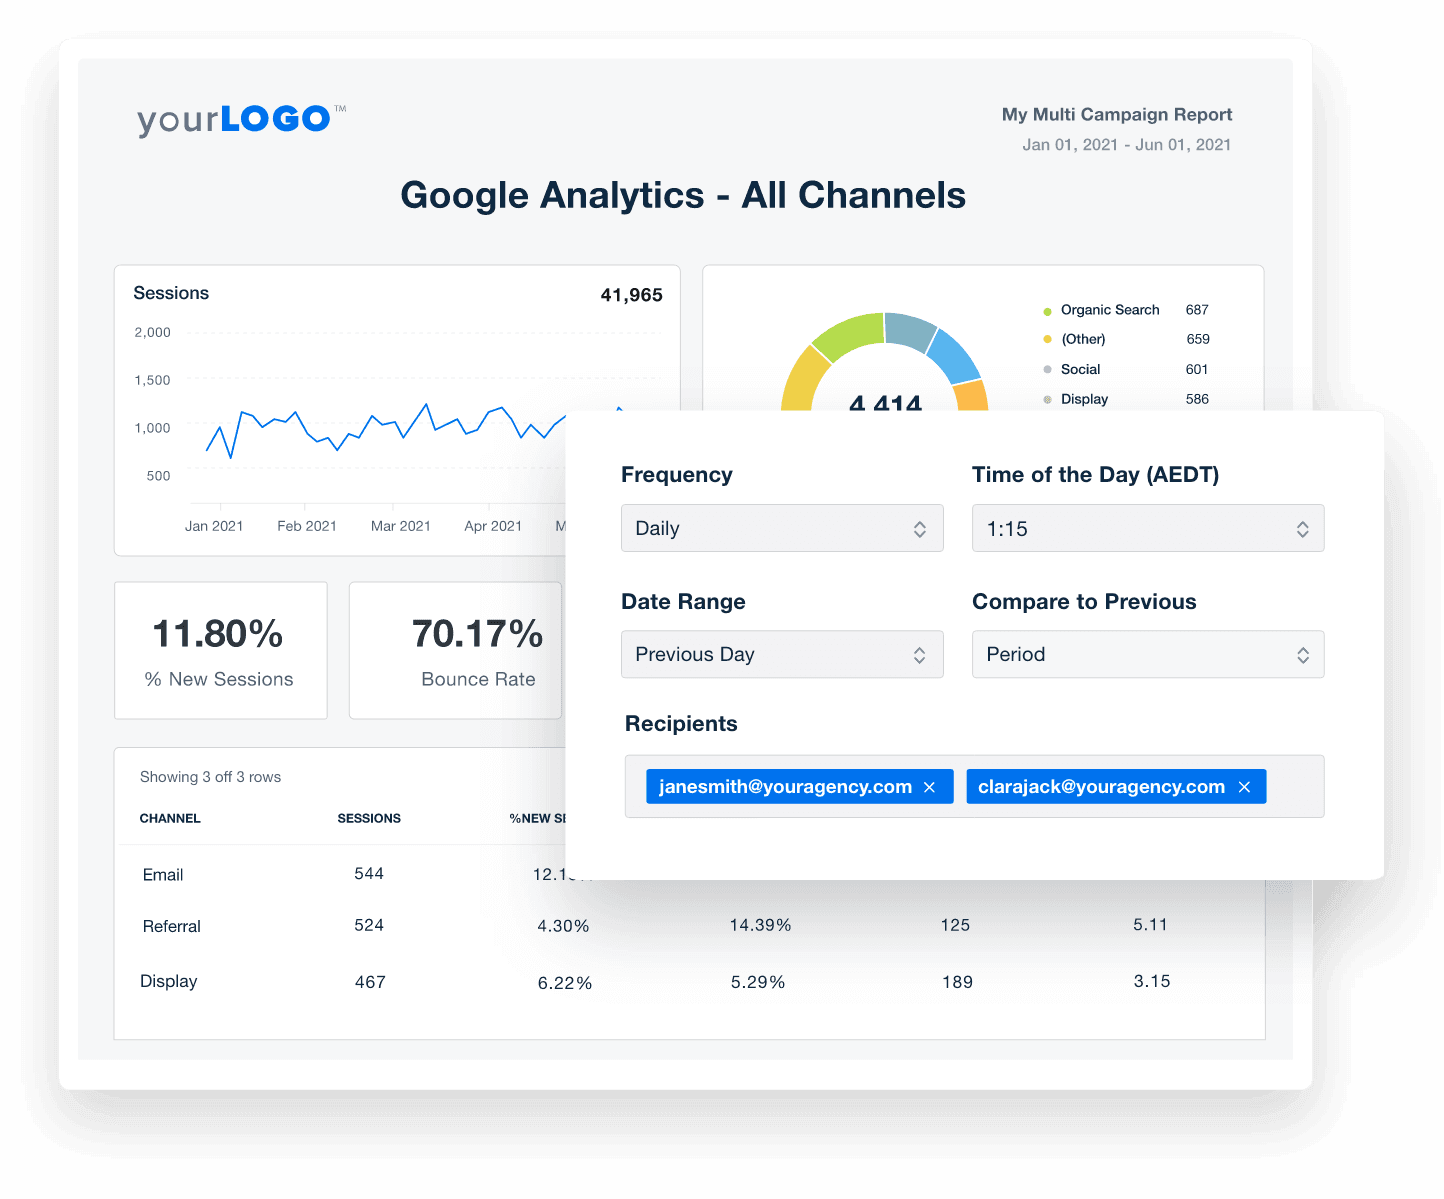
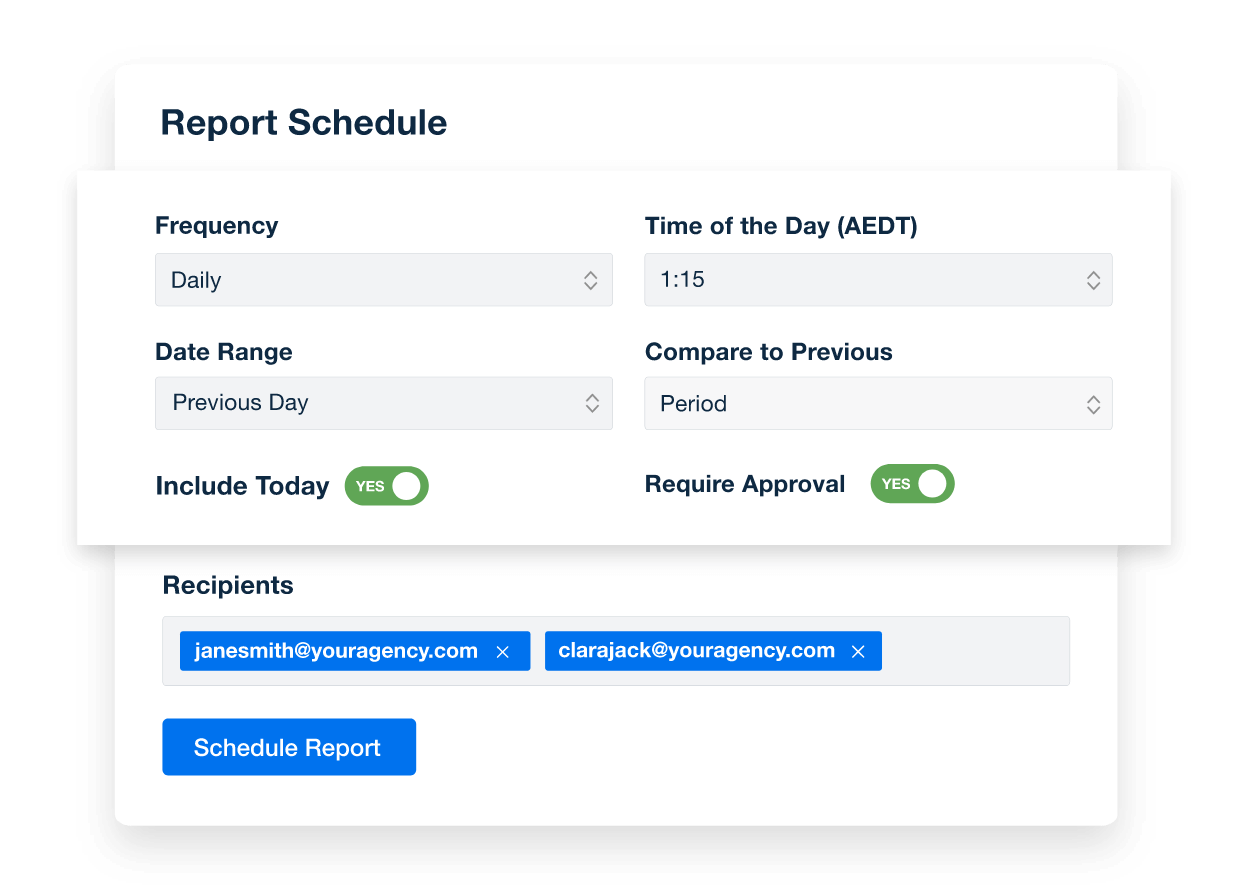
Ensure that clients receive timely updates with the report scheduling feature. Whether it’s an update or a regular monthly report, automate the entire delivery process.
This reduces the time spent on administrative work, leaving you with more time to improve client satisfaction and upsell services.
Access Swift Insights
Report Smarter. Not Harder.
Easily create automated reports with marketing analytics from 80+ platforms and counting.
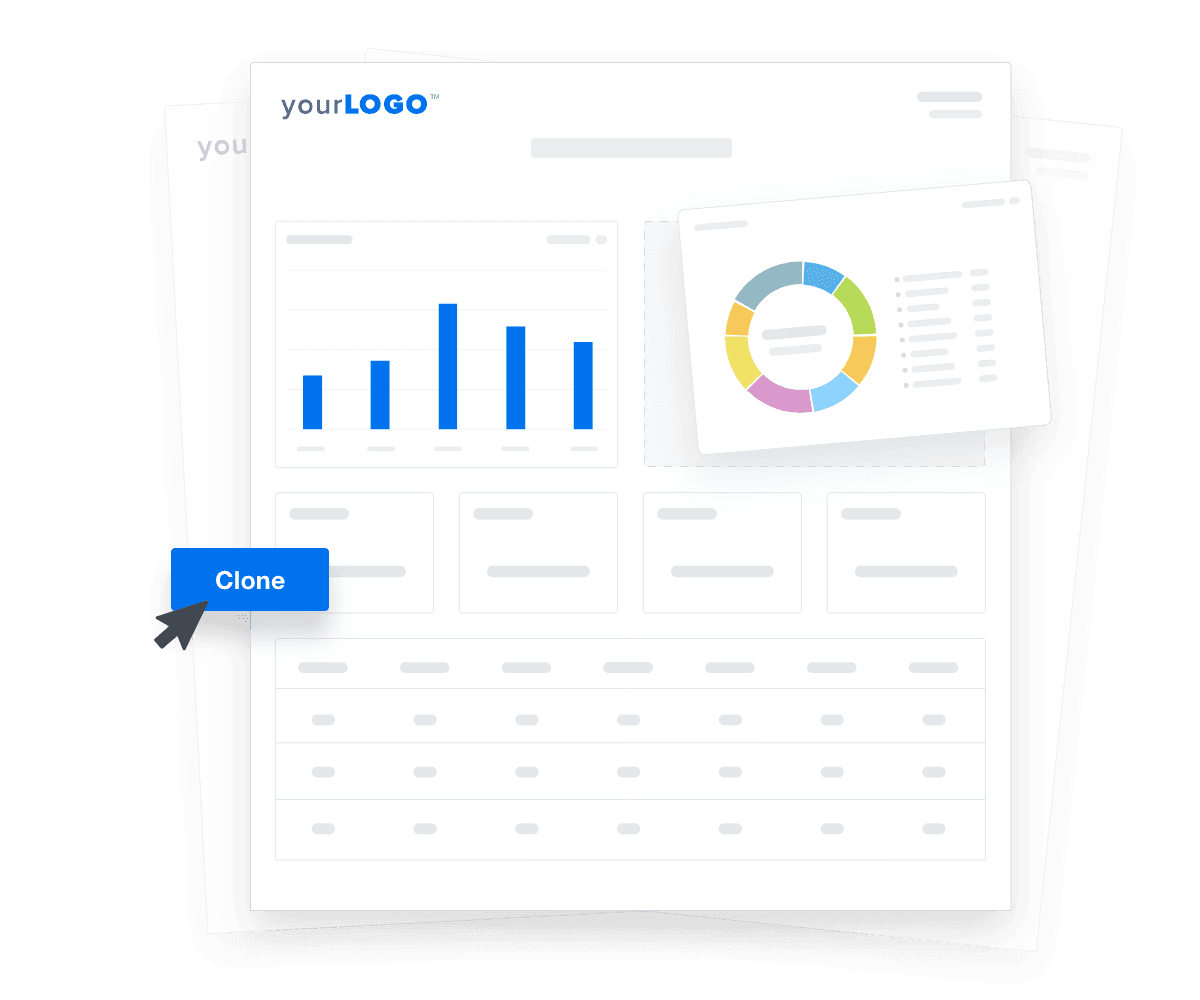
Integrate data from Google Ads, TikTok, Majestic, and more. Customize any dashboard template or marketing report to suit your client’s needs. Replicate templates to speed up client onboarding and enhance the reporting experience.
Winning back that time allows the team to focus less on doing admin tasks, and focus on client campaigns. Saving this time has been massive for us, as no one is wasting all those hours on reporting anymore.
Joshua George / Founder
Get Started for Free
Try AgencyAnalytics risk-free for 14 days. No credit card required.