Table of Contents
QUICK SUMMARY:
Benchmark reporting is the process of comparing metrics against industry standards. It’s used to provide context, identify areas of strength or underperformance, and guide decisions. This article explores the importance of benchmark reporting, how to create an effective report, and the most common mistakes to avoid. It also shares the importance of using an all-in-one tool like AgencyAnalytics, which is useful for consolidating campaign metrics and first-party benchmarking data across 150,000+ campaigns.
You’ve just delivered a strong client report. Click-through rates are up, cost per conversion is down, and campaign performance is trending in the right direction. Then comes the question:
"But… how does this compare to our competitors?"
It’s a tough question to answer. Improvement is great, but how does it stack up to the wider market? Are your clients leading the pack or just keeping pace with everyone else?
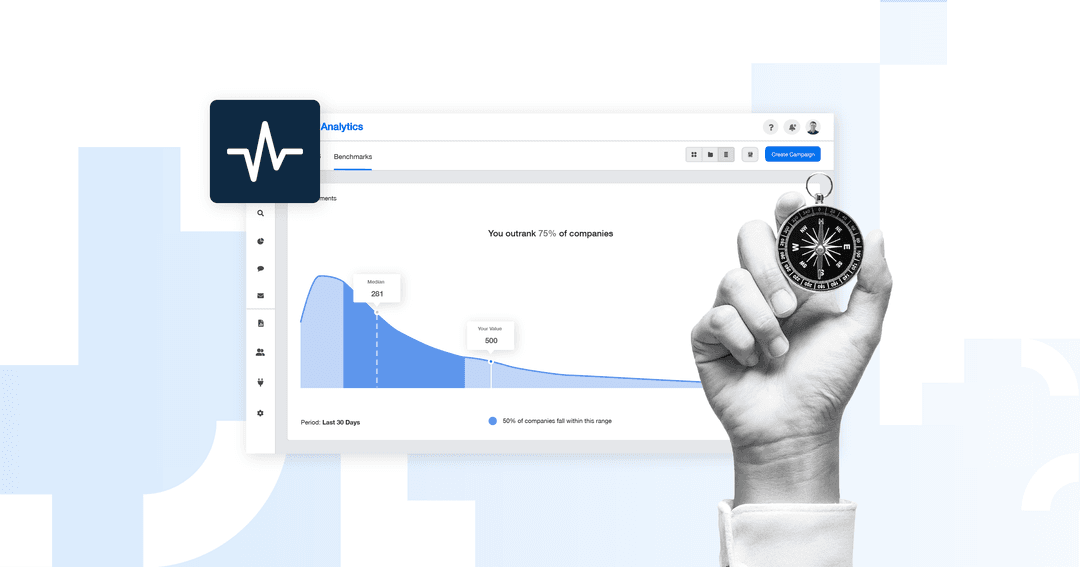
That’s where benchmark reporting comes in. It provides that additional context, showing how clients compare to others in the same space and highlighting any areas for improvement. That way, your recommendations are rooted in data–both at the campaign and macro levels.
This guide covers what benchmark reporting is, how to build reports that drive smarter decisions, and the best tools to streamline the process. We’ll also explore the most common benchmarking mistakes and how to avoid them.
What Is Benchmark Reporting?
Benchmark reporting is the process of comparing metrics against predefined standards to evaluate success and guide future strategies. These standards—or benchmarks—are usually based on collated industry averages, past performance, or internal goals.
Simply put, benchmark reporting is used to determine gaps, highlight wins, and justify recommendations. This gives clients a more holistic view of their marketing performance.
What is a Benchmark Report?
So, what’s the best way to package these insights? A dedicated benchmark report.
It’s a structured document that visually compares performance metrics to relevant benchmarks—for example, showing a client’s CTRs alongside general channel averages or more specific industry-based standards.
Essentially, a great benchmark report should answer questions like:
Is my client above or below the industry average for key metrics like CTR, CPC, or ROAS?
Which campaigns or channels are underdelivering, and which are outperforming expectations?
Where should we focus next to drive better results?
The goal is to give clients a clear sense of where they stand and what to do next.
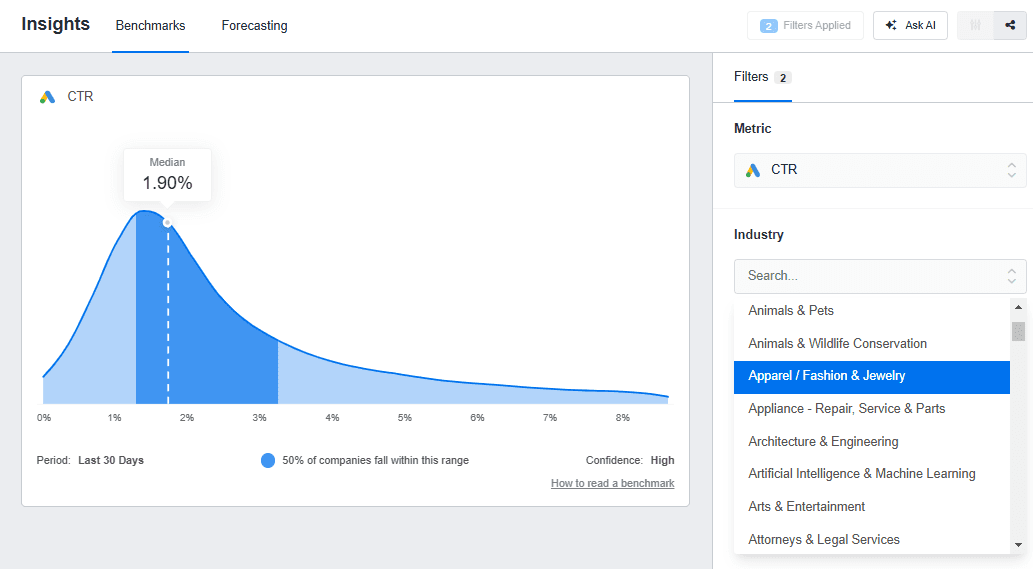
For more context, let’s say your agency manages Google Ads for a client in the Apparel & Fashion industry. It’s the end of the month, and you’ve delivered this report using benchmarks from the AgencyAnalytics platform.
Metric | Client Performance | Industry Average |
|---|---|---|
Click-Through Rate (CTR) | 1.20% | 1.90% |
Cost Per Click (CPC) | $1.85 | $0.57 |
Conversion Rate | 0.70% | 1.90% |
On paper, this client’s campaign did generate clicks and conversions. Upon further assessment, though, their campaign performance is underwhelming compared to industry standards. More specifically, their CTR and conversion rate fall short, while CPC is more than triple the average.
These gaps indicate potential issues with ad relevance, targeting, or landing page experience—insights that wouldn’t be as clear without a benchmark reference.
Why Benchmark Reporting Is Essential for Business
Benchmark reporting helps clients understand how their performance compares across the broader market. It adds valuable context, highlights competitive advantages or gaps, and supports smarter strategic planning. Here’s why it’s worth investing in.
Proves Value to Clients
When it’s time to renew a contract, benchmark reporting provides more persuasive evidence than a list of metrics.
Consider the following scenario: Say you’ve shared a report that shows a $12.50 cost per lead. On its own, that number is just that… a number. With additional details like, “The industry average in your vertical is $18,” suddenly, that $12.50 becomes a win. It shows you’re generating leads more efficiently than most, which is concrete proof of value.
This type of data makes it significantly easier to justify pricing, reinforce your value proposition, and strengthen client retention.
Invest in a platform that offers reliable first-party benchmarks sourced from 150,000+ campaigns. See what AgencyAnalytics has to offer–try it free for 14 days.
Ensures Clients Make Smarter Decisions
Clients often stress over short-term dips in performance.
A small drop in engagement or a spike in CPC could trigger knee-jerk decisions, like slashing ad spend or pausing campaigns. Not ideal.
In these cases, use benchmark reporting to educate clients on:
Seasonal trends (e.g., higher CPCs during holiday rushes)
Market shifts (e.g., platform algorithm updates affecting engagement rates)
Competitor activity (e.g., industry-wide spikes in ad spend)
With the right context, clients are less likely to panic or react impulsively. Instead, they’ll have enough information to make informed, data-driven decisions.
Helps Set Data-Driven Goals
Instead of setting arbitrary targets, use benchmarks to align your client’s KPIs with how similar businesses are performing.
Wondering how it works in a real-life context? Let’s say a SaaS client has a 22% email open rate. If the industry average is 25%, aiming for 40% isn’t just unrealistic; it sets your team up to miss the mark. A target like 27% makes more sense and still pushes performance in the right direction.
Benchmarks also shift perspective. Your client might also say, “Only 22% of people opened this? That seems low.” Once you’ve shared the industry average of 25%, though, that number doesn’t seem so far off. It shows them what’s actually possible based on market trends and real-life context.
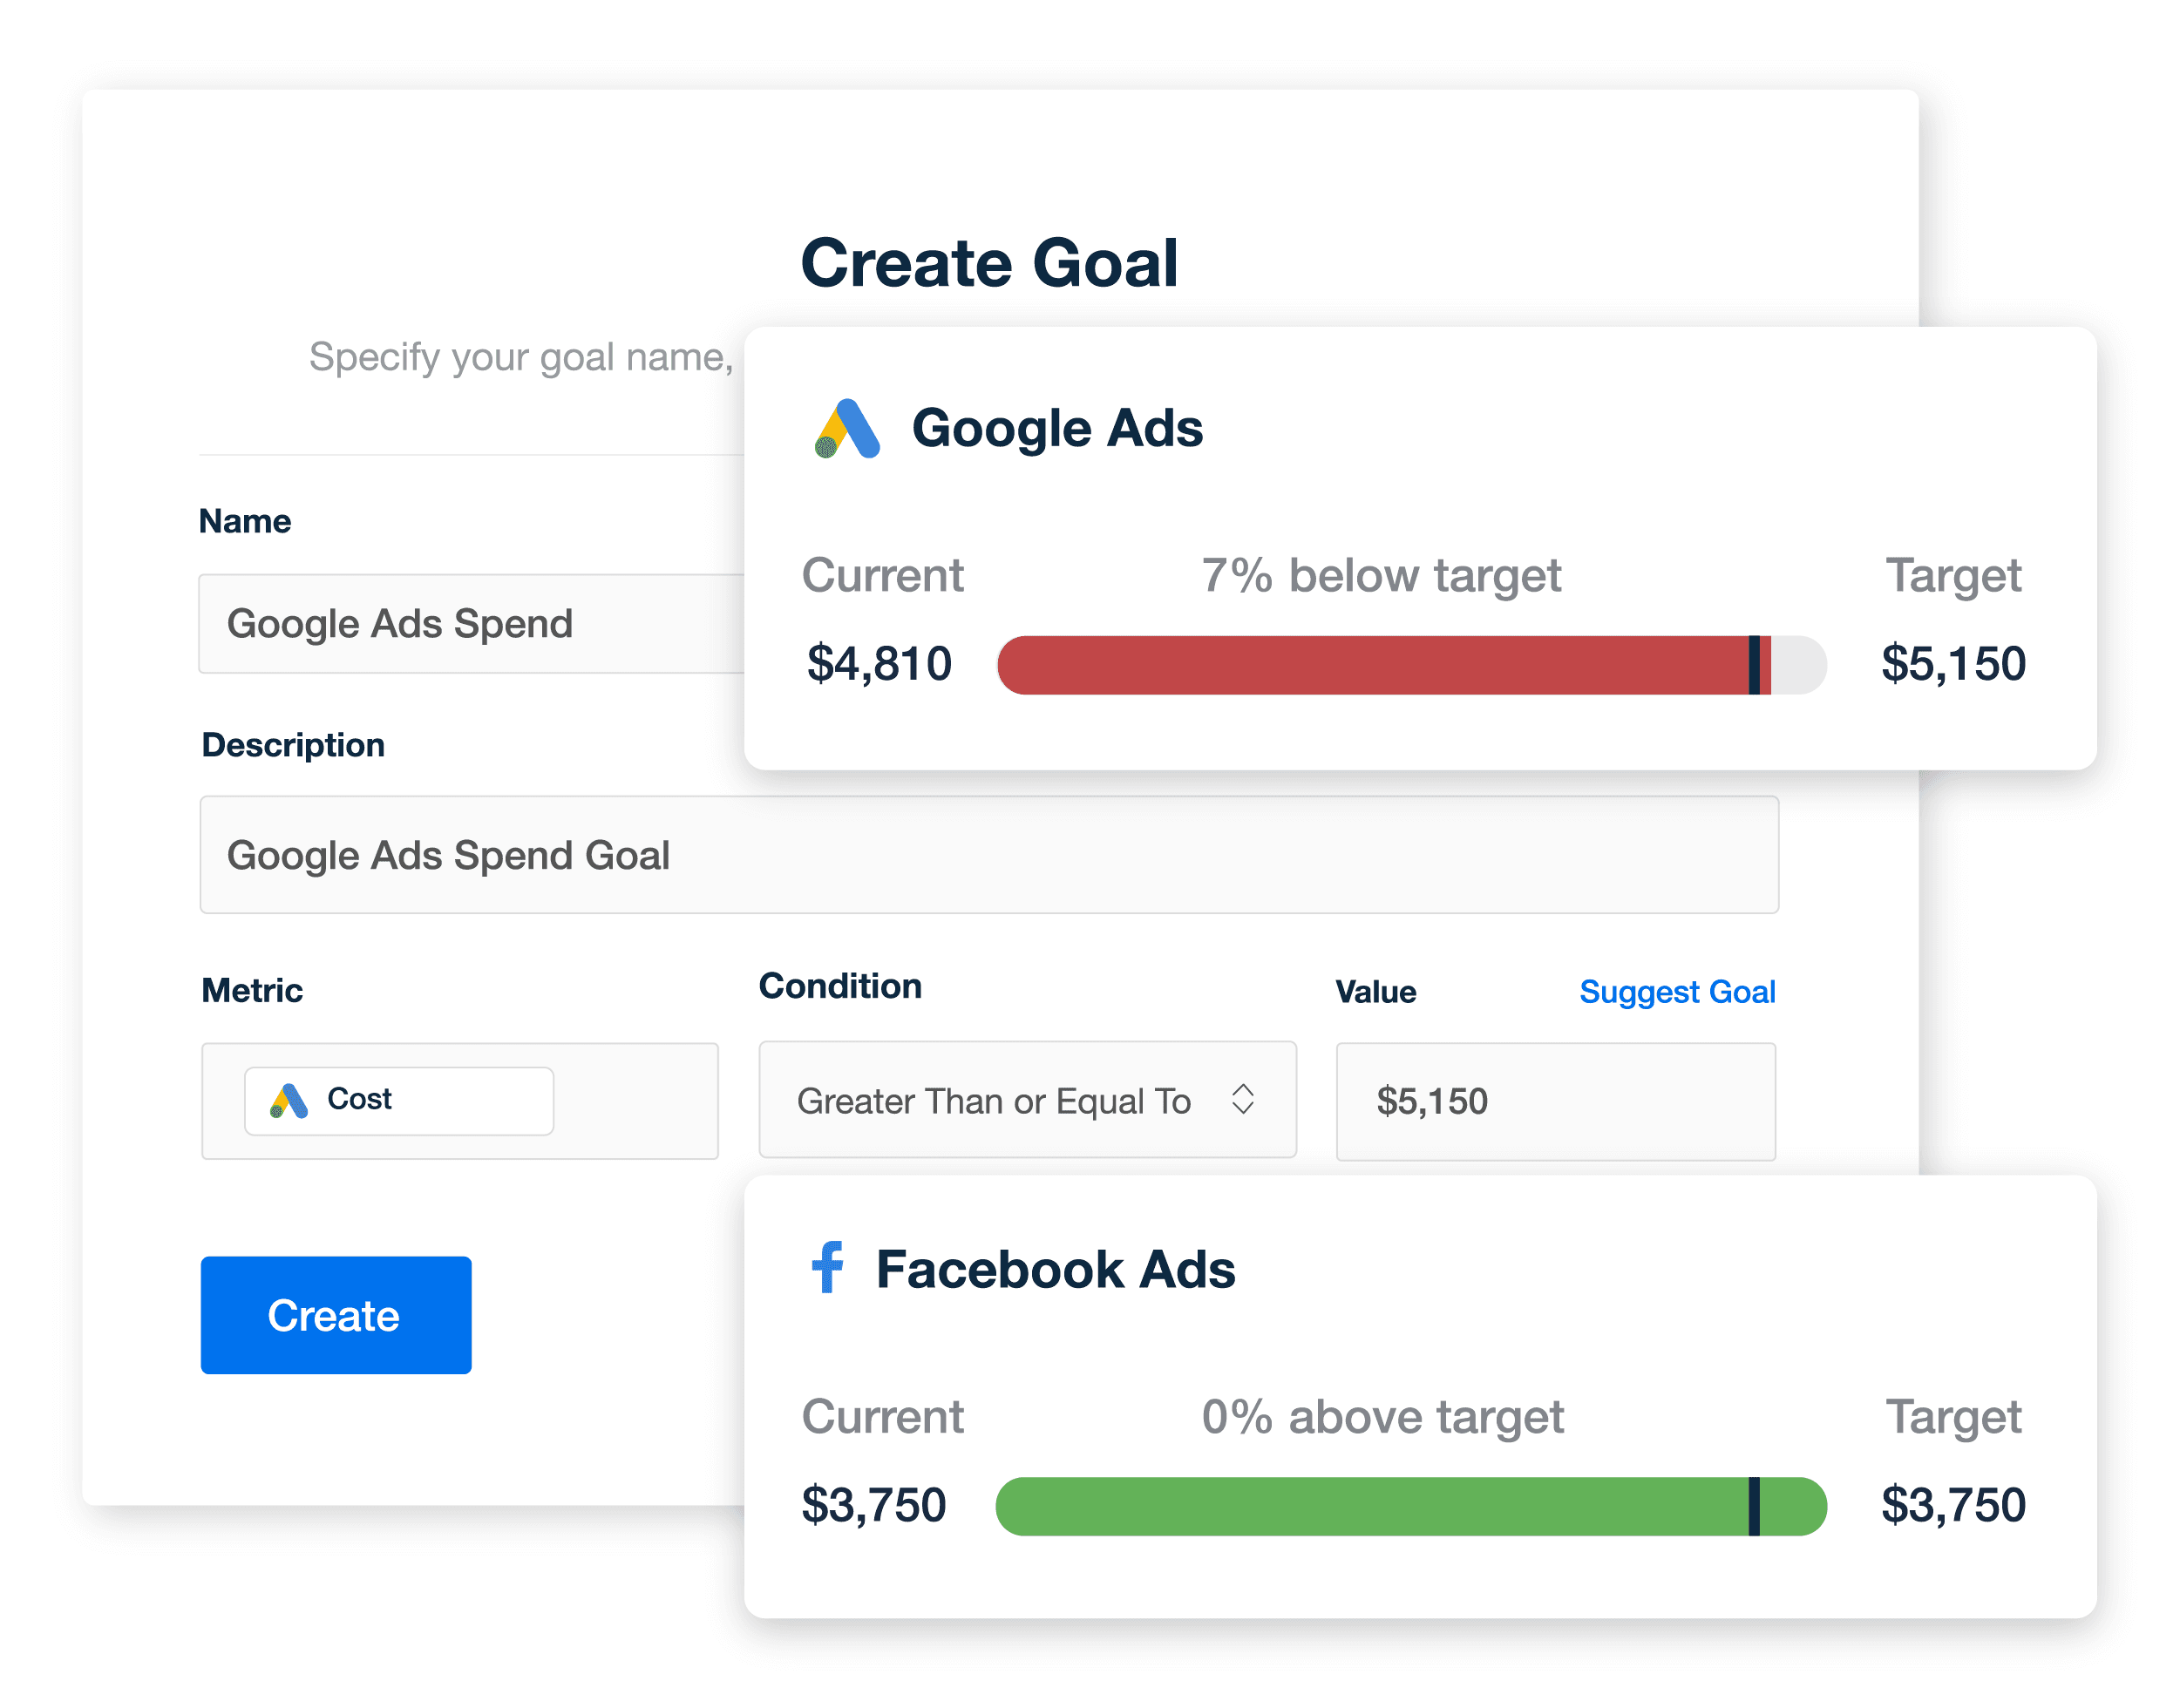
Use marketing benchmarking tools to create actionable goals for your clients. Quickly monitor real-time progress and ensure things are running smoothly–try AgencyAnalytics, free for 14 days.
Identifies Strengths and Weaknesses
Benchmarking highlights which campaigns are pulling their weight and which ones need attention.
For example, say a client’s Facebook Ads campaign shows a 1.5% conversion rate against a 2.8% industry average. On the other hand, their Google Ads efforts are actually outperforming benchmarks, with above-average CTRs and conversions.
In these situations, it may be worthwhile to shift budget and optimization efforts toward stronger channels. This ensures that time and resources are invested where they’ll deliver the highest return.
How To Write a Benchmark Report
A benchmark report is more than a pile of metrics. More importantly, it’s a way to tell a story—one that celebrates wins, uncovers weaknesses, and is backed by data-driven comparison.
Here’s a step-by-step guide to writing one that adds clarity, context, and strategic direction.
1. Identifying Key Metrics
To get started, define the metrics that matter to your client most. Ensure that they’re directly tied to measurable business outcomes, like lead volume, revenue, customer acquisition cost, or return on ad spend.
At our agency, we believe that metrics are only useful if they drive decision-making. As a result, we focus on identifying actionable metrics that can be used to inform and improve marketing efforts. To do this, we start by taking a close look at goals and objectives. Then, we identify the key performance indicators (KPIs) that will help us measure progress towards those goals.
Guy Hudson, Founder, Bespoke Marketing Plans
It’s also helpful to narrow in on specific marketing channels. Consider where most of the client’s budget is going, what stage of the funnel they’re optimizing for, and which platforms are likely to drive the most meaningful results.
This will increase the chances that benchmark comparisons are focused and relevant from the start.
2. Data Collection & Comparison
Next, consolidate your client’s data in one location. This makes it easier to analyze performance across multiple sources, spot trends, and identify inconsistencies.
It’s a good idea to use a platform that allows seamless integration with multiple marketing channels, includes built-in industry benchmarks, and offers quick data insights (e.g., AI-generated overviews and summaries).
Having all key metrics centralized speeds up the entire reporting process, ensuring you don’t have to scramble to pull numbers manually.
3. Analyzing & Interpreting Data
Once your client’s data is organized, it's time to examine benchmark comparisons and what the numbers actually mean.
Start by identifying what’s outperforming, what’s underdelivering, and where performance is holding steady. It’s also a good idea to consider related metrics and how they tie into the bigger picture.
For reference, here’s a useful methodology to keep in mind.
What To Look For | Why It Matters | What To Do |
|---|---|---|
Flag Top-Performing Metrics That Exceed Benchmarks | Consistently above-average metrics signal what’s working better than the norm. | Use these wins to guide budget allocation, inform creative strategy, and scale success to other channels. |
Watch for Sudden Shifts or Gradual Trends | A slow decline in key metrics like CTR or conversion rate may indicate deeper performance issues, such as ad fatigue. | Monitor week-over-week changes and take action before minor dips become larger problems. |
Look for Consistent Underperformance | Ongoing low performance against benchmarks often points to strategic or structural issues. | Review targeting, creative, or landing pages to identify what’s holding the campaign back. |
Whether you're scaling what works or troubleshooting what doesn’t, use these benchmark reporting practices to provide tangible value.
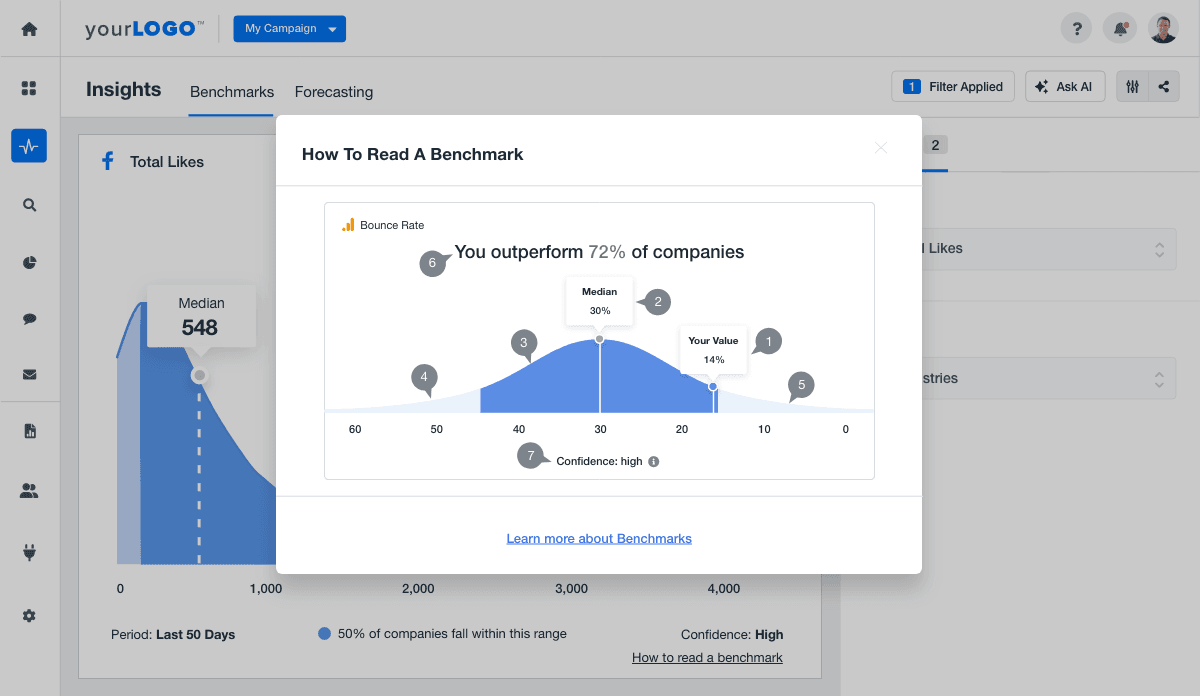
Not sure what benchmarking data means? Reference clear explanations and know exactly what to communicate to clients. Explore the Marketing Performance Insights suite in AgencyAnalytics, free for 14 days.
Best Tools for Benchmark Reporting
Let’s be real–manually gathering benchmark data is time-consuming and painstaking.
The right marketing agency tools automate data collection, provide industry comparisons, and empower your agency to generate reports faster.
Here’s a breakdown of the best tools to consider, along with their use cases.
1. Google Analytics
Google Analytics offers benchmarking features to evaluate your client’s website performance in a broader context. It’s great for comparing traffic sources, user behavior, and conversion rates against industry averages pulled from similar businesses.
That said, pulling data into reports often requires manual setup, which could get time-consuming when you’re juggling multiple clients. For best results, integrate Google Analytics with a dedicated reporting platform that automates benchmarking and streamlines report creation.
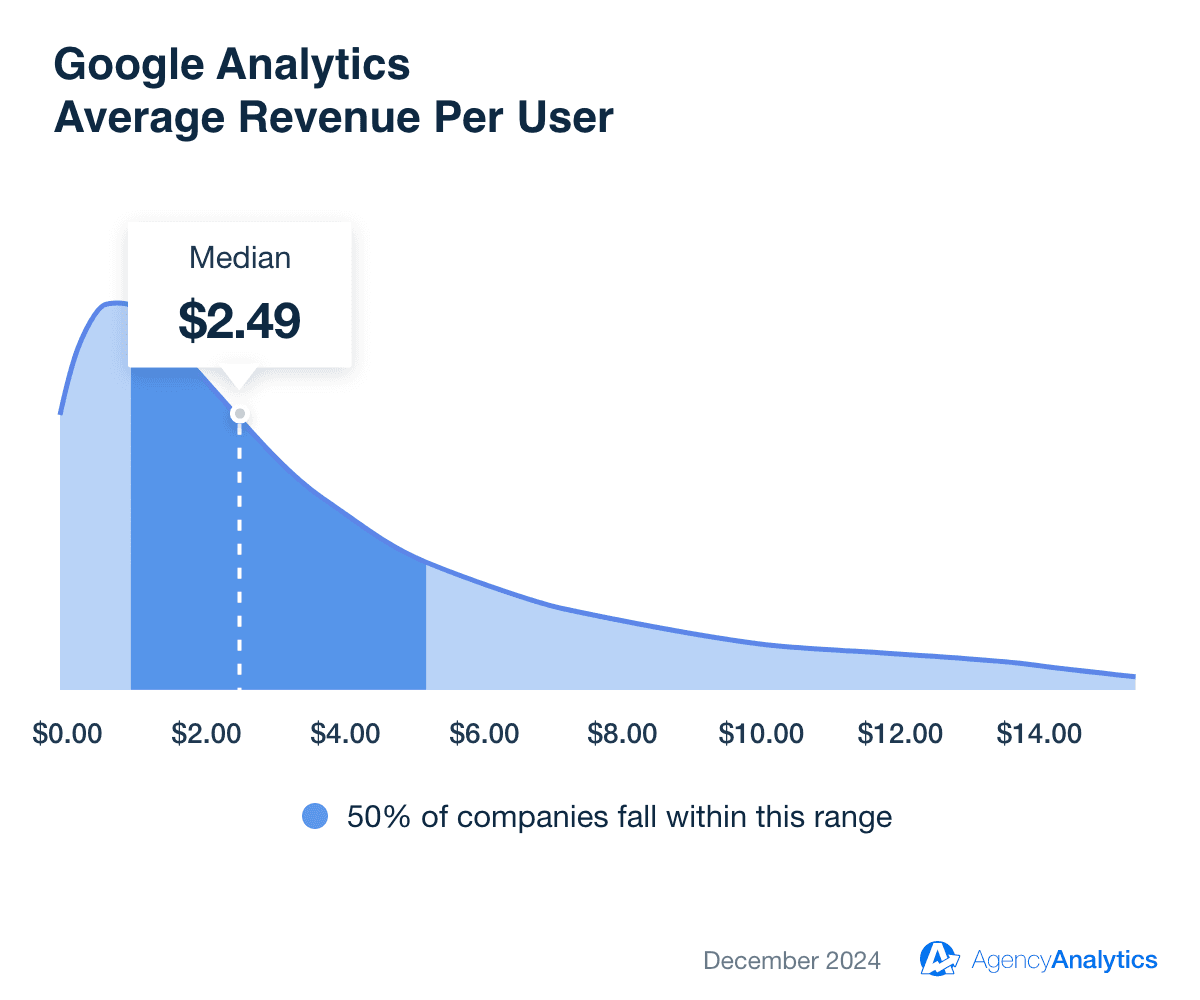
View Google Analytics benchmarks across 150,000+ client campaigns, access pre-built report templates, and even monitor forecasting trends. See what AgencyAnalytics has to offer–sign up for a free 14-day trial today.
2. Google Sheets
Google Sheets is a flexible, free option for tracking and organizing benchmark data. It works well for creating data visualizations, comparing multiple data points, and tracking performance trends over time.
While it’s great for customizing your own reporting setup, it requires manual entry and regular upkeep. And since there are no built-in industry benchmarks, you'll need to source that data separately.
Still, it may be a preferred option for monitoring internal benchmarks or other company data (e.g., custom KPIs that aren’t tied to industry standards). In these scenarios, use a reporting tool that allows data importation from Google Sheets, so you’ll have everything in one place.
3. HubSpot
HubSpot offers built-in benchmarking for email marketing, sales, and CRM performance. It’s a great tool for comparing metrics like page views, bounce rates, and sales funnel metrics (like contact conversion rates) against industry benchmarks.
Some features are only available on higher-tier plans, and benchmarking is mainly focused on email and sales (not PPC or SEO). So if you’re managing multi-channel campaigns, HubSpot works best as part of a broader reporting stack rather than a standalone benchmark solution.
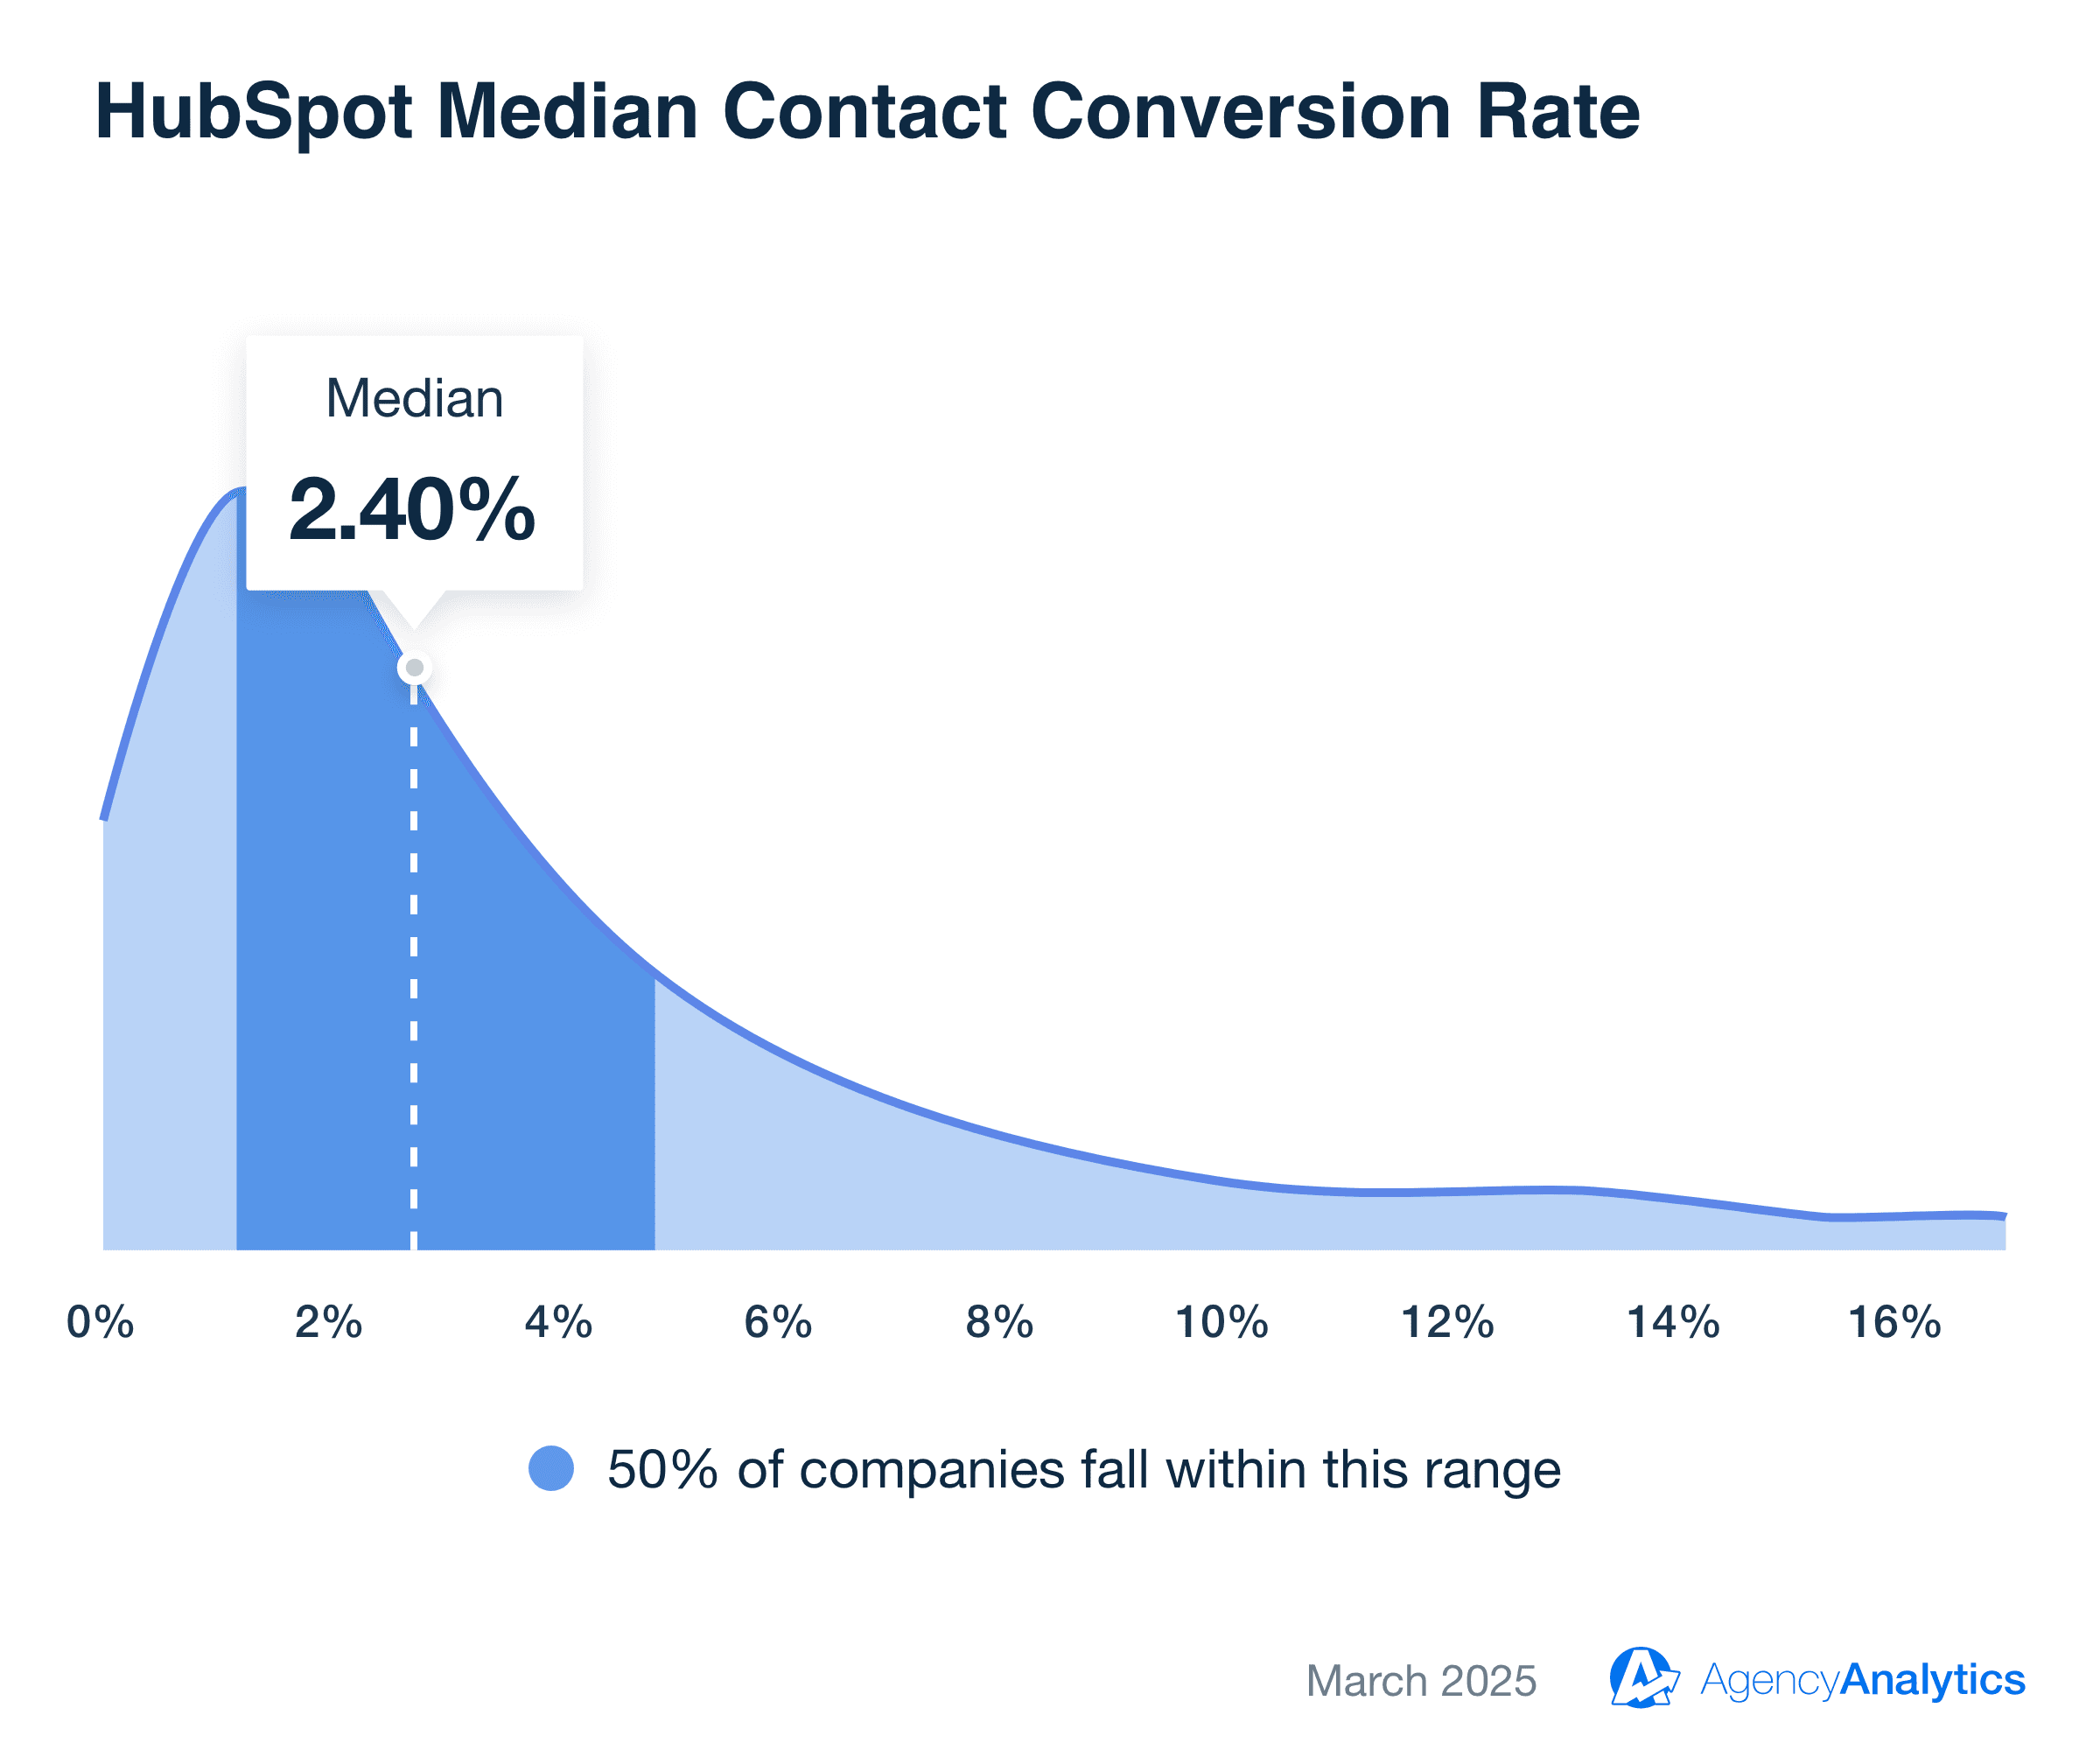
Keep an eye on key HubSpot benchmarks including contact conversion rate, lead count, and more. See exactly how your client stacks up to their peers–try AgencyAnalytics, free for 14 days.
4. AgencyAnalytics
Looking for an all-in-one reporting platform with built-in, agency-specific benchmarks? AgencyAnalytics has got you covered.
Unlike other tools, AgencyAnalytics leverages first-party data from 150,000+ campaigns run by over 7,000 agencies. That means every benchmark is based on real numbers from businesses just like yours—not watered-down data from unrelated organizations or platforms.
More specifically, here’s exactly what the Marketing Performance Insights suite offers:
Multi-Channel Benchmarking: Access benchmarks across 80+ marketing channels, including Google Ads, Facebook, LinkedIn, and more—all from a single interface.
Industry-Specific Insights: Need granular details? View benchmarks specific to your client’s industry. Whether you're reporting for a client in SaaS or roofing, get relevant data that reflects the realities of that specific vertical. This makes your reporting more accurate and actionable.
Forecasting Insights: Predict future campaign performance using historical trends, industry medians, and current pacing. Visualize whether a campaign is on track, ahead, or falling behind.
Centralized Reporting: Bring benchmark data and campaign insights together in one place, including organic search metrics, PPC performance, social media stats, email engagement, or sales results.
With AgencyAnalytics, there’s no need to jump between platforms, juggle spreadsheets, or rely on third-party tools. The best part? Both benchmark and performance data live in one unified, fully customizable campaign performance dashboard, giving you a complete overview of every campaign.
Common Mistakes To Avoid
Benchmark reporting is powerful, but only if done correctly. Otherwise, it could lead to incorrect comparisons, bad decision-making, or confused clients.
Here are the biggest mistakes to avoid when creating these reports.
Mistake #1: Ignoring Context
Benchmarks should support the story, not be the whole story.
Consider a retail client’s conversion-driven campaign. A higher-than-average Google Ads CTR might initially seem like a win. However, if those clicks aren’t leading to sales, it could point to issues like unqualified traffic. On the flip side, a high CPC might raise eyebrows, until you realize it’s driving high-value conversions. And in that case, the added cost is worth it.
The takeaway? Always explain what the numbers mean in context, so clients stay focused on outcomes, not just surface-level stats.
Mistake #2: Treating Benchmarks as Hard Targets
Benchmarks are reference points and shouldn’t be viewed as fixed goals.
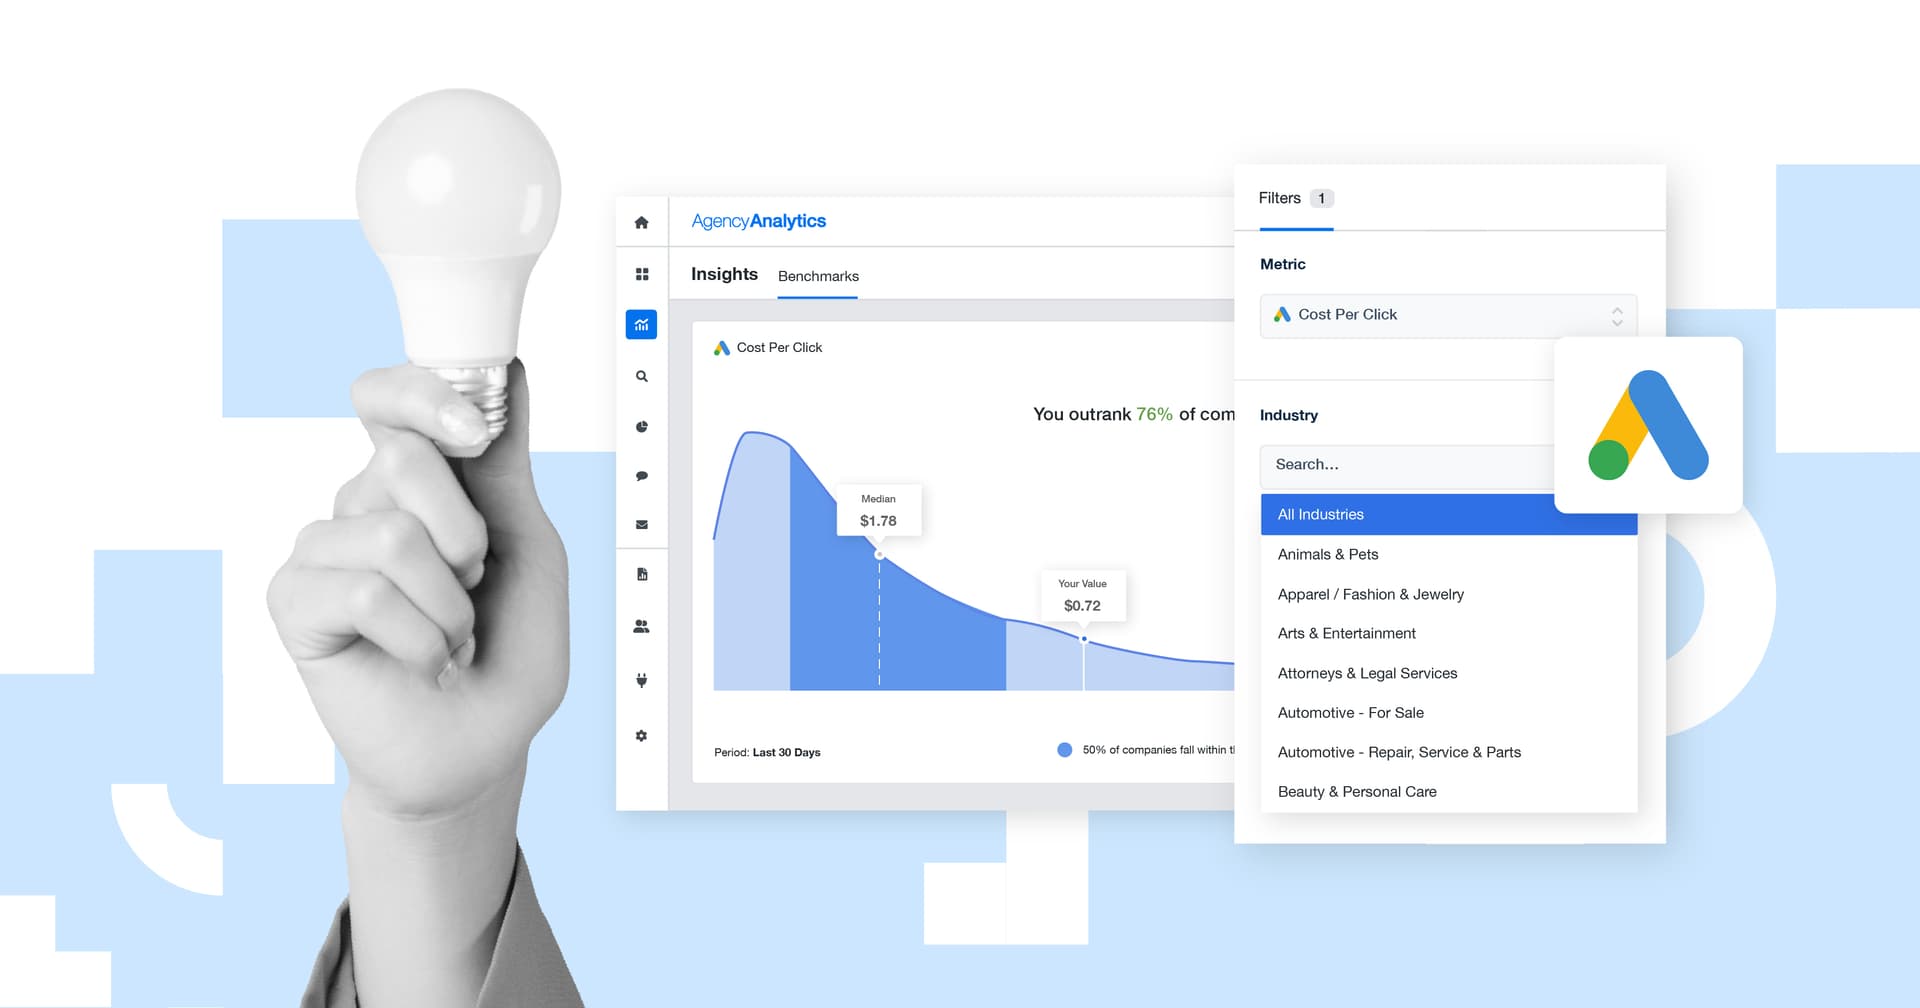
Take LinkedIn Ads, for example. The median cost per click (CPC) in the Software & Applications industry is $8.04, according to AgencyAnalytics data.
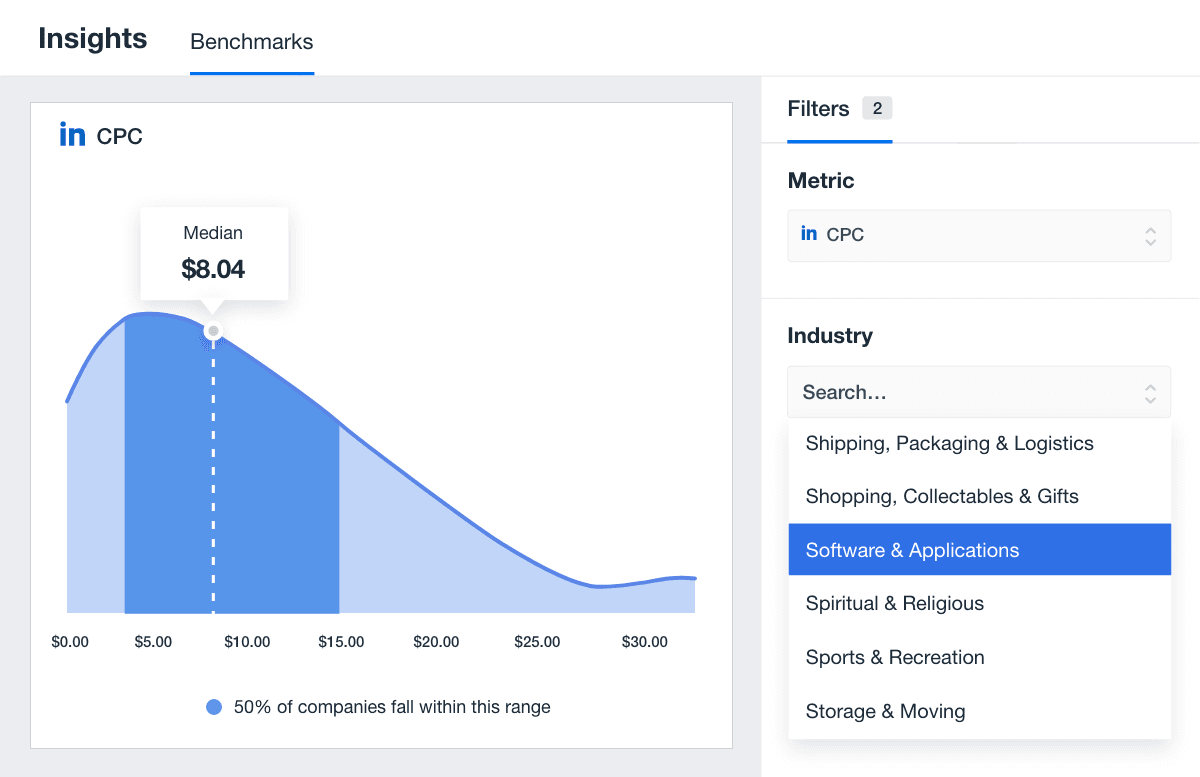
Say your client runs campaigns in a highly technical B2B space and has a marginally higher CPC of $9.02. If those clicks lead to high-value conversions above the industry average, that’s a win.
Trying to force the metric up just to hit the “average” could compromise targeting or inflate costs without adding real value.
Mistake #3: Using Outdated Benchmarks
Benchmarks lose their value if they don’t reflect the current market.
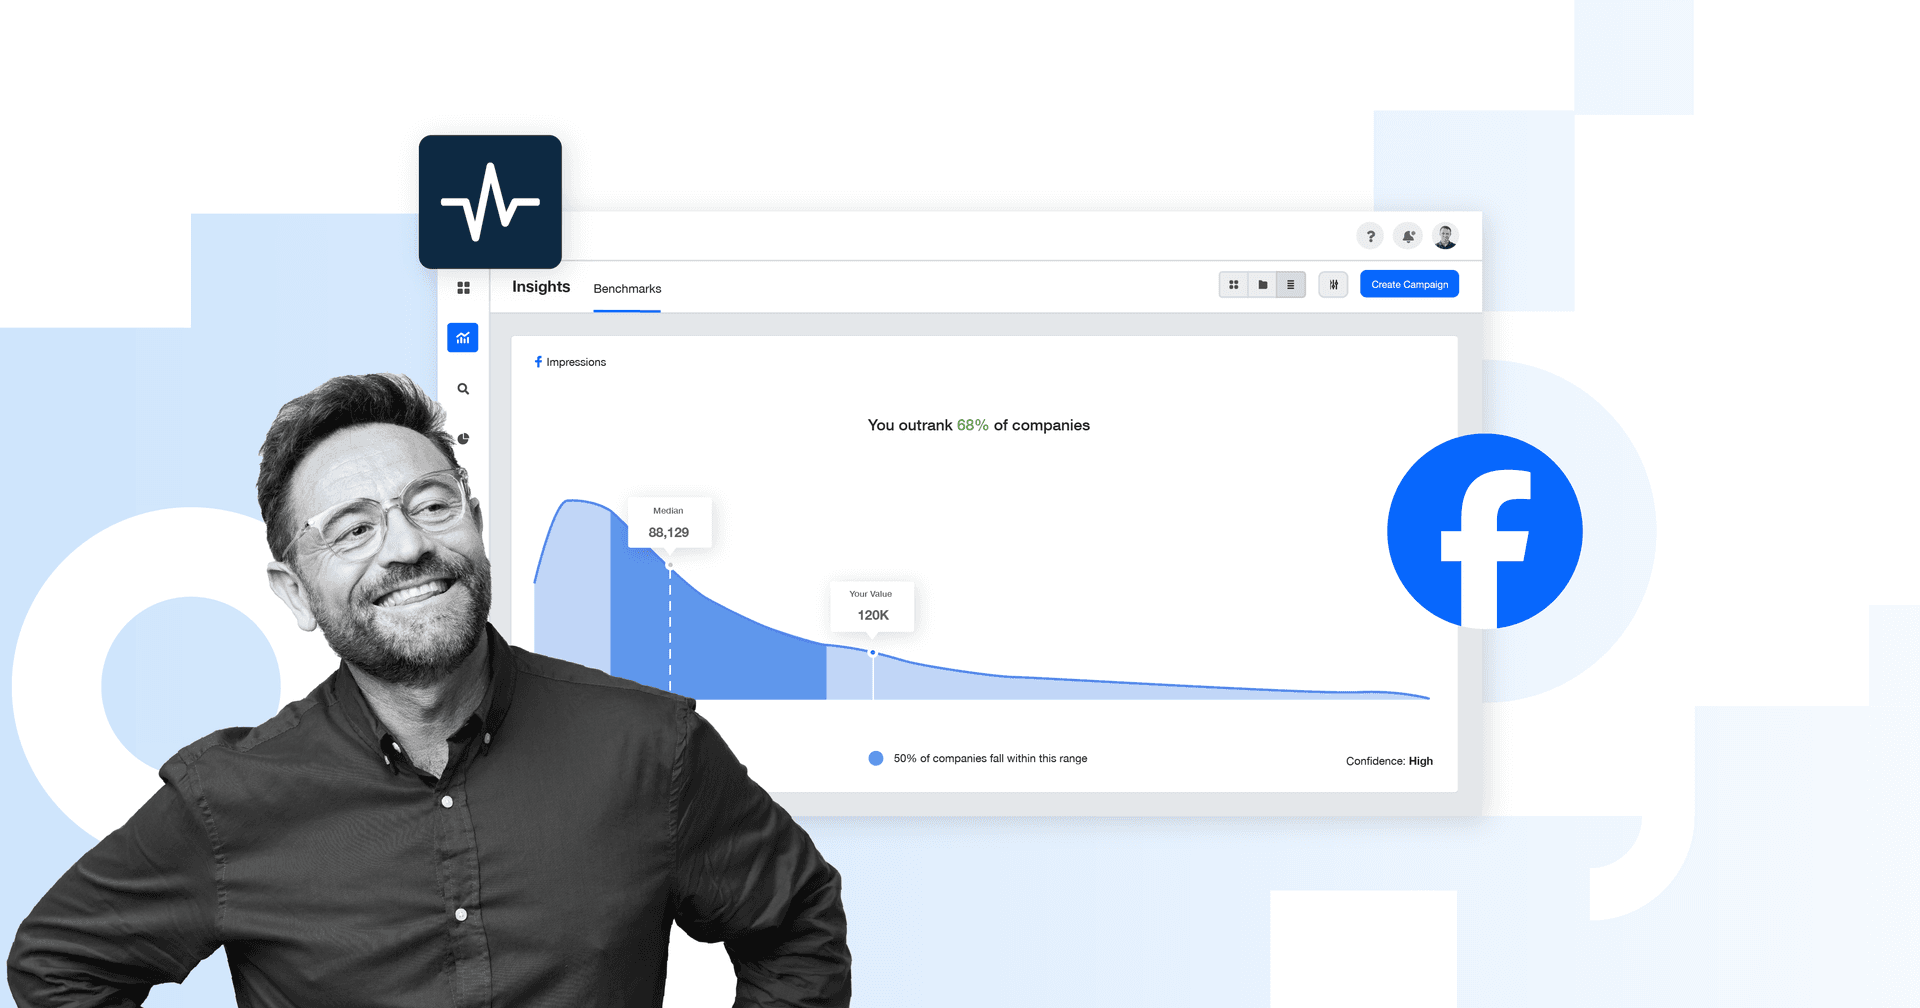
External factors–like platform algorithms change, user behavior shifts, and seasonality–all impact results. Just consider a Facebook Ads CTR benchmark from six months ago. It probably won’t hold up during an ad surge in Q4, an unusually slow summer period, or a major post-algorithm update.
To avoid using stale data, be sure to:
Refresh benchmark data monthly or quarterly, especially if the campaign is scaling or within a competitive niche.
Keep industry seasonality in mind (e.g., June CTRs in retail may look very different from December).
Use tools like AgencyAnalytics that automatically update benchmarks from live campaign data across thousands of agencies, so you're always working from current insights.
Conclusion & Final Thoughts
As we’ve covered, benchmark reporting gives data meaning–it shows whether performance is actually strong or just looks good on paper. More importantly, it helps your agency explain what’s happening and why it matters.
To get it right, use benchmarks that match your client’s platform, industry, and goals. Keep the data current, focus on the metrics that move the needle, and make sure your insights lead to clear next steps.
Piecing together numbers across multiple platforms, though? No need for excessive manual work–invest in one reporting tool that does it all.
AgencyAnalytics has simplified the process of reviewing and analyzing data from various sources. The response from our clients has been overwhelmingly positive, as they appreciate the convenience of having their Google Analytics data, rankings, and other insights in one user-friendly interface. This eliminates the hassle of logging into multiple platforms and navigating through complex interfaces.
Alexa Rees, SEO Manager, seoplus+
Access in-platform benchmarking data, share predictive insights, and streamline reporting workflows. Try AgencyAnalytics today–it’s free for 14 days.
FAQs About Benchmark Reporting
Still got questions about benchmark reporting? Here are some common FAQs and their answers.
A benchmark provides context by comparing a client’s metrics to industry standards. It highlights whether performance is above or below average and identifies areas for improvement. Benchmarks are used to support recommendations with data, rather than assumptions.
Begin by selecting the most relevant metrics for the client’s goals. Compare those metrics against industry or historical benchmarks to uncover gaps and strengths. Then interpret the data in context and outline next steps. The report should guide decision-making based on measurable differences.
Key metrics depend on the client’s marketing channels and objectives. Common examples include click-through rate (CTR), cost per click (CPC), conversion rate, and return on ad spend (ROAS). Effective benchmark reporting focuses on metrics that drive outcomes and inform strategy.
Reporting summarizes a client’s performance data, while benchmarking adds context by comparing those results to relevant standards. Benchmarking helps assess whether performance is strong, weak, or average within the client’s industry or marketing channel.

Written by
Faryal Khan is a multidisciplinary creative with 10+ years of experience in marketing and communications. Drawing on her background in statistics and psychology, she fuses storytelling with data to craft narratives that both inform and inspire.
Read more posts by Faryal KhanSee how 7,000+ marketing agencies help clients win
Free 14-day trial. No credit card required.


