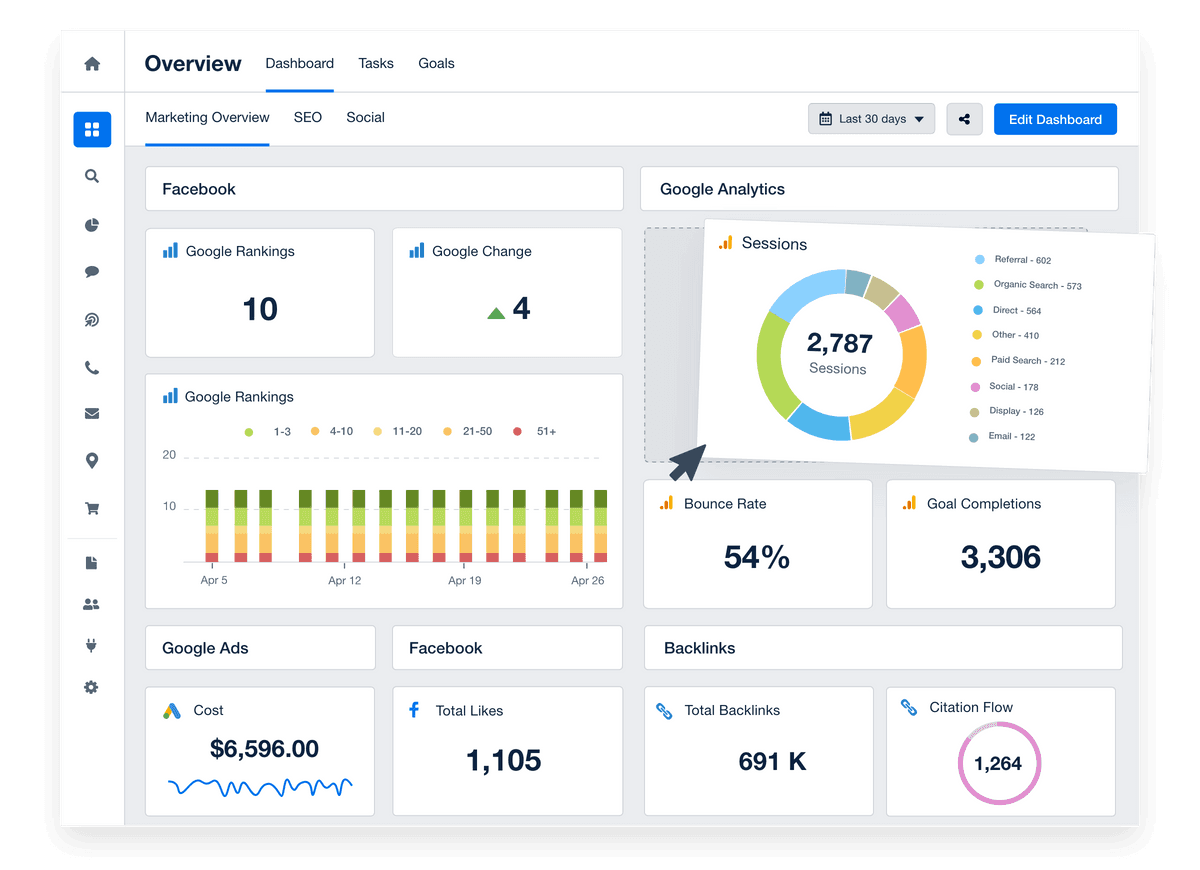
Use Presentation Mode To Present Client Data
Design Impactful Client Presentations in Minutes
Transform your client's data into sleek, professional slide decks that are ready to present in just minutes using AgencyAnalytics' report builder. Create engaging slides that distill complex data and highlight crucial trends and performance insights.
Just click "Present" to activate your dynamic report presentation. With the capability for quick updates, your presentations always maintain accuracy, relevance, and impact.

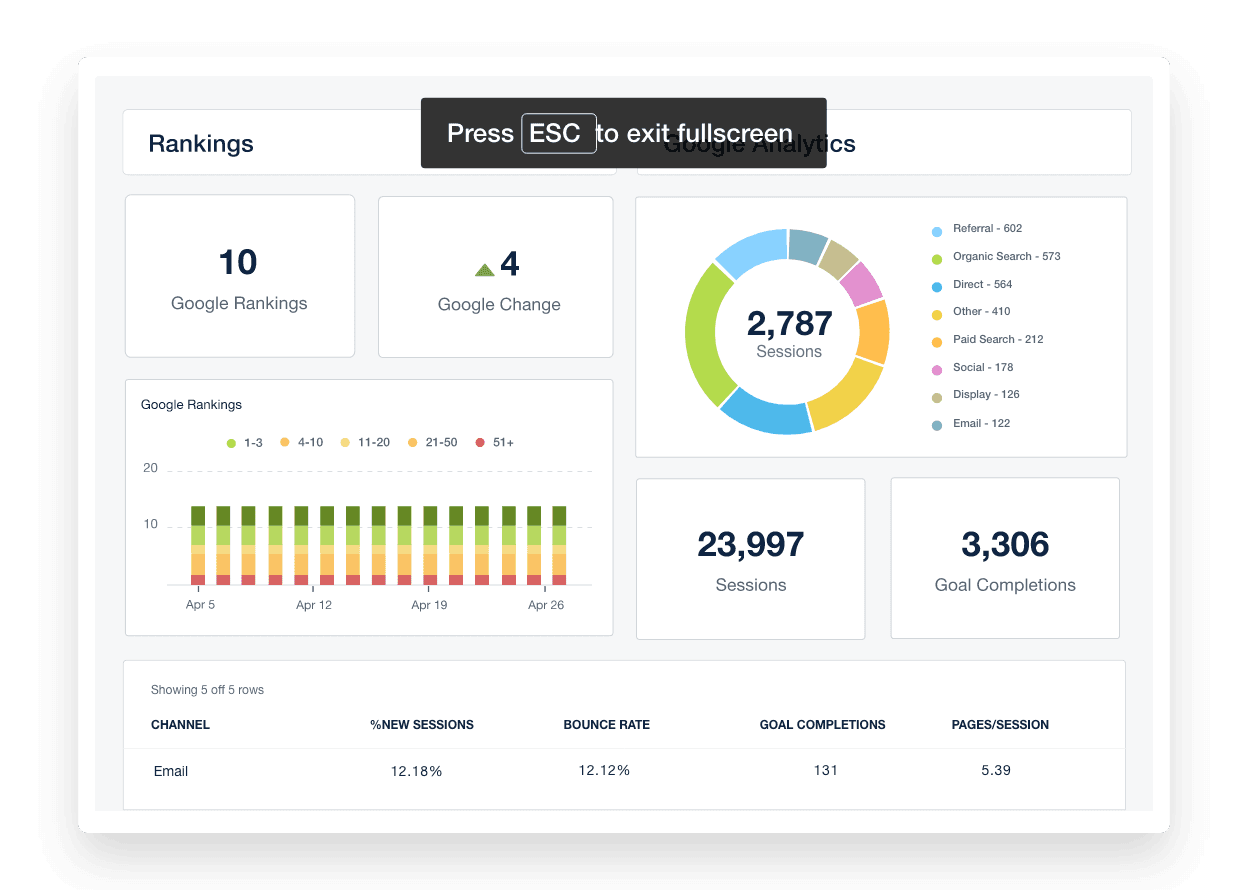
Elevate Your Data Presentations to Full-Screen Glory
Keep clients focused on the metrics that matter. Presentation Mode removes clutter so you display dashboards full screen, highlight key results, and guide strategic conversations without toggling or tab overload. Whether in a meeting or screen share, deliver a polished, data-driven experience every time.
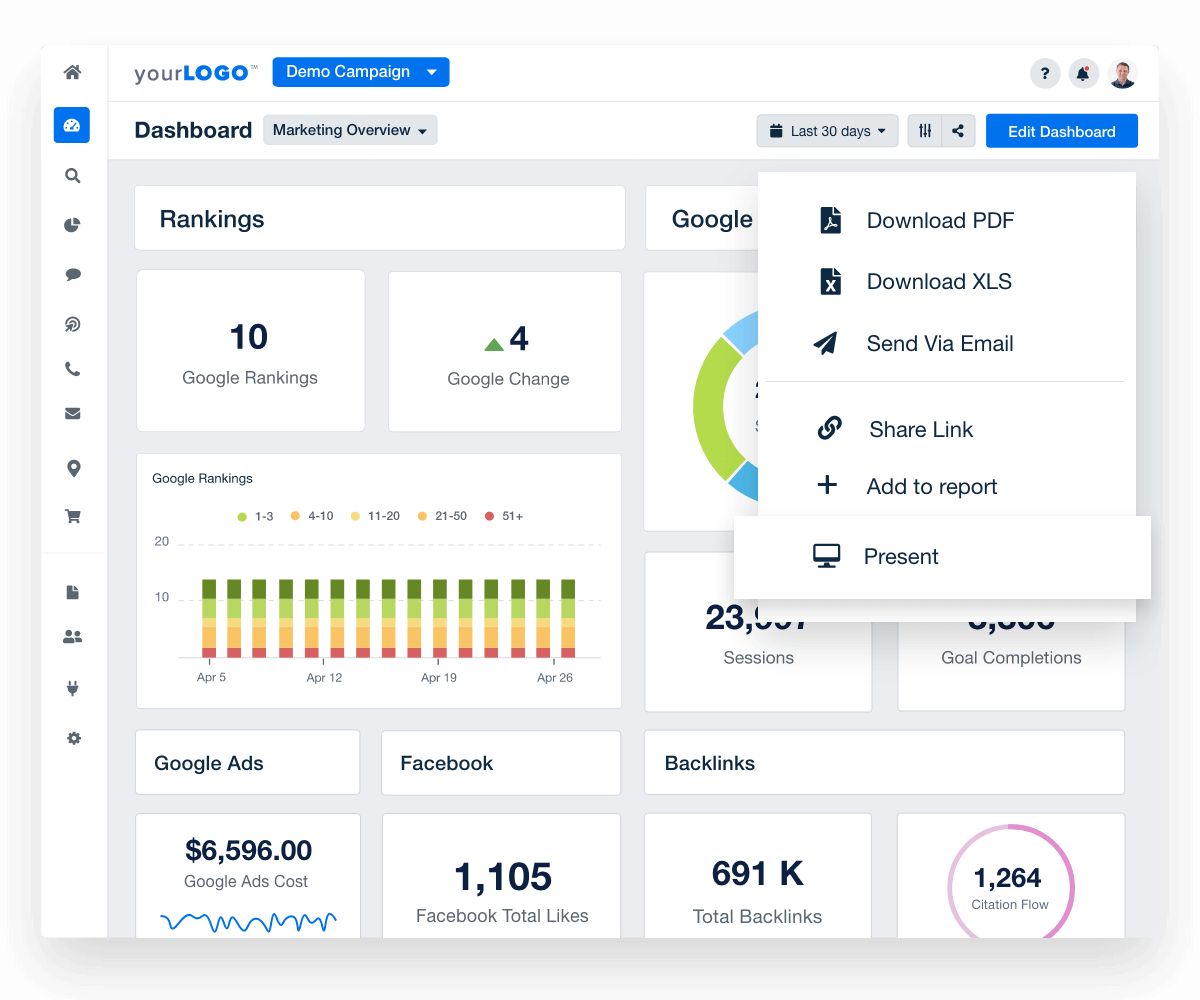
Highlight Performance Where It Matters Most
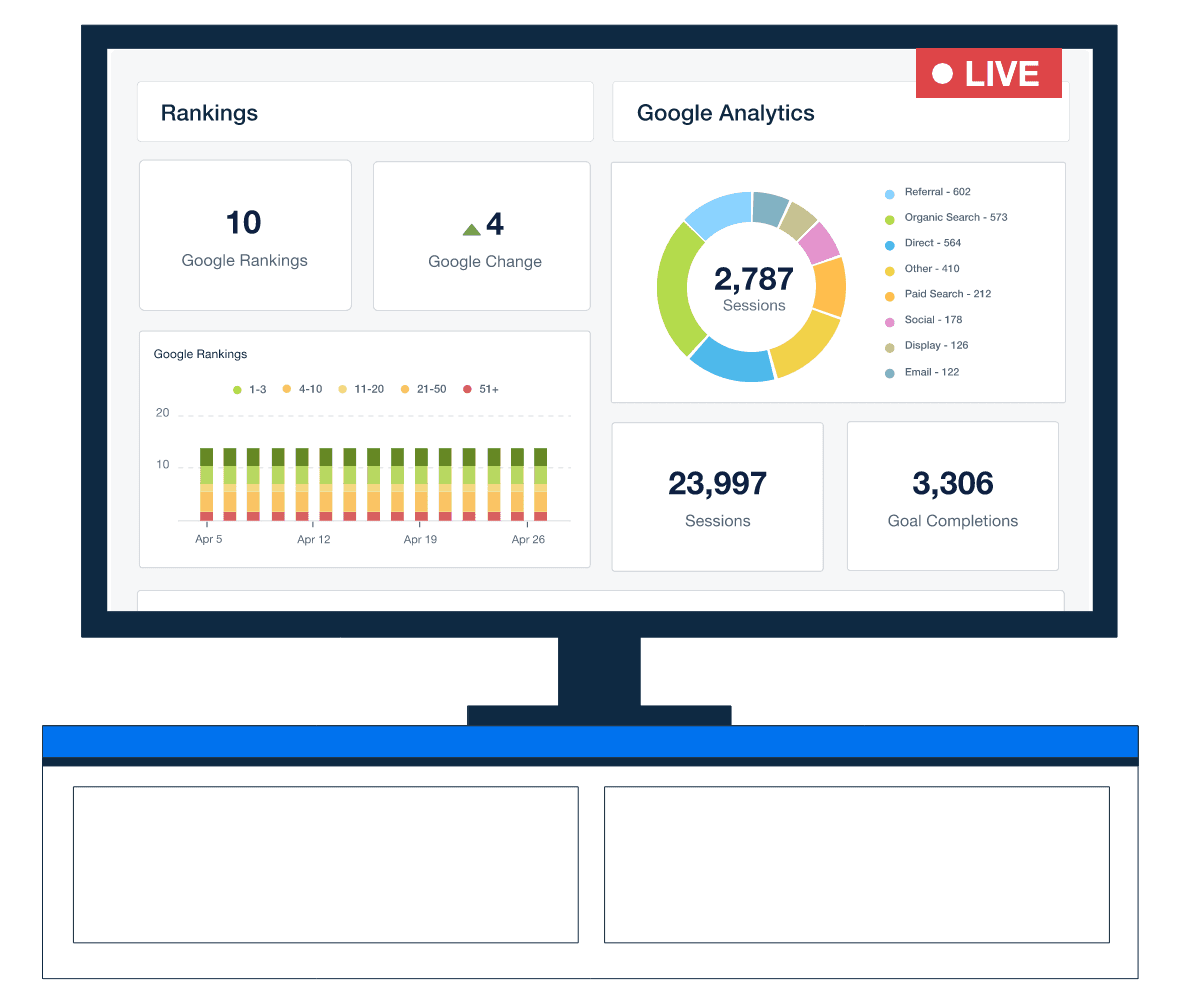
Use Presentation Mode to display live dashboards on office monitors or during client meetings. Whether you're sharing KPIs with your team or walking a client through results, this full-screen view keeps everyone focused on the metrics that matter—without distractions.
Professional, real-time reporting shows clients exactly where campaigns stand and reinforces your agency’s value with every conversation.

Claire Aldridge, Digital Marketing Specialist
Victory Digital
Unlock precise, actionable insights in just a few clicks.
Centralize Data from 80+ Marketing Platforms
Skip the platform-hopping. Pull all your client metrics into one place with 80+ data connectors. AgencyAnalytics makes it easy to build unified dashboards that simplify performance tracking, surface key insights, and save your team hours every week.
Create Scheduled Reports and Live Dashboards
Automatically deliver client-ready reports on a set schedule—daily, weekly, or monthly—or give clients access to live dashboards for on-demand updates.
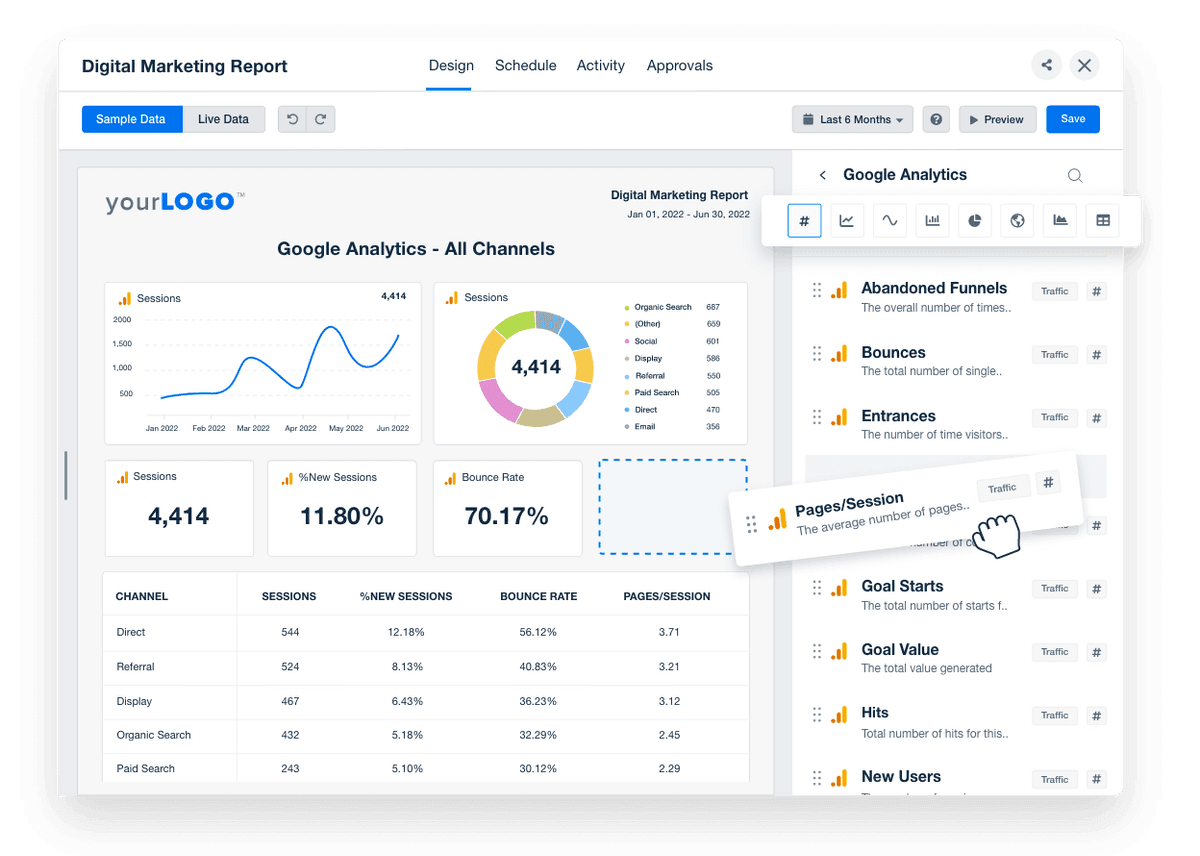
Easily customize each report or dashboard with your agency’s branding, choose the metrics that matter, and tailor the format to each client’s needs. With custom user permissions, white label options, and drag-and-drop widgets, your team spends less time formatting and more time analyzing results.
Trusted by Over 7,000 Agencies. Rated 4.7 Stars on G2
AgencyAnalytics is built for marketing agencies that take branding seriously. With fully customizable reports and dashboards—logos, colors, domains, and more—your agency delivers a polished, professional experience every time.
The 4.7-star rating on G2 reflects what thousands of agencies already know: white label reporting isn’t just about aesthetics, it’s about trust. Branded reports reinforce your expertise, strengthen client relationships, and keep your agency front and center.
Automated Client Reports. Ready in 30 Minutes or Less.
Get Started for Free

