LinkedIn Reporting Tool & Analytics Dashboard

Bring LinkedIn data into focus
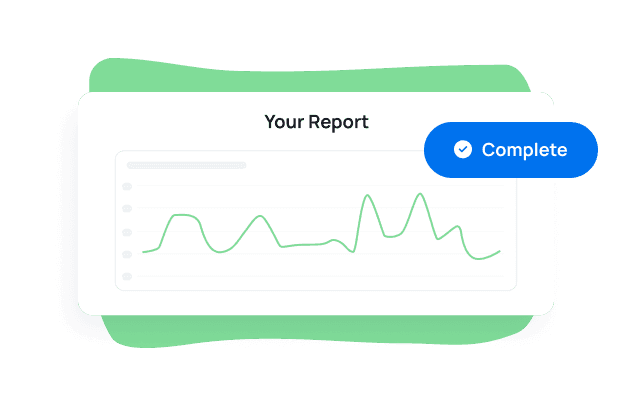
Go beyond basic profile stats. The LinkedIn reporting tool transforms raw performance data into clear, client-friendly reports and dashboards that reveal how your content strategy drives engagement, growth, and real business results.
Track Influence
Show clients how their LinkedIn company page & content marketing plan has increased their profile visibility
Industry Insights
Make it easier to highlight LinkedIn page performance, provide actionable insights, and identify trends
Monitor Engagement
Track engagement rate including post views, comments, likes, and shares to evaluate post performance
Real-time Updates
Pull key metrics into your LinkedIn analytics tool automatically to stay up-to-the-minute with important data across client accounts
Track Follower Growth
Demonstrate the effectiveness of your agency's services. Report on LinkedIn performance metrics that move the needle and grow your client's follower base. Use the LinkedIn dashboard to provide actionable growth analytics for you and results-focused charts and graphs for your clients.
With a customizable LinkedIn dashboard and LinkedIn analytics report template, show clients exactly when, where, and how you've improved their company's LinkedIn audience network. That way, they'll understand the true impact of their marketing campaigns.
Easily combine data across multiple platforms to show the complete picture of your client's social media performance.

Explore All Available LinkedIn Metrics
- Clicks
- Comments
- Date
- Followers
- Followers Net
- Impressions
- Likes
- Organic Followers Gain
- Organic Followers Lost
- Paid Followers Gain
- Posts
- Shares
- Social Actions

Measure What Matters Most
Monitor Engagement & Prove Content Impact
Demonstrate exactly how LinkedIn members have engaged with your client's LinkedIn feed over time. Use the LinkedIn analytics dashboard to analyze LinkedIn post performance and social actions by type, with separate visualizations for shares, likes, and comments. Toggle with a range of graphs and choose the most intuitive, easy-to-digest format. It's all up to you.
Compare engagement by day to find opportunities for further improvements to your agency's LinkedIn content strategy. Clearly present any upticks in engagement performance metrics, which demonstrates progress and shows traction. Reiterate the value of your agency's services through comprehensive reporting.

Turn Reach Into Results
Understand Impressions, Clicks & Visibility
Give clients a crystal-clear view of their LinkedIn presence. Understand–in granular detail–how far your client's reach and social influence extend across their own network. Demonstrating a far campaign reach shows that their LinkedIn marketing efforts are gaining traction and visibility. It's a must-have for driving brand recognition and setting the foundation for tangible results.
Convert those performance metrics into stunning visuals that demonstrate total impressions and clicks over time with engaging, full-color graphs. Compare your client's LinkedIn growth against previous periods to further demonstrate their progress.

Know The Audience, Refine The Strategy
Gather Valuable Industry Insights
While boosting total followers is a strong performance indicator, it’s equally important to attract the right followers.
The best content starts with the right audience. Gain a deeper understanding of the individuals that make up each client's LinkedIn audience by analyzing demographic data. Break down follower demographics by geographic location, seniority level, company size, job function, and industry. Demonstrate to clients that you're reaching their target market.

Optimize Growth With Precision
Track Paid vs. Organic Followers
Easily display how new followers are gained—organically or through paid efforts.
Determine the exact breakdown of paid versus organic followers for each client's acquisition profile to better plan for future workflow and social media strategies. Include beautiful graphs and charts in your client's social media reports to help clients understand their paid-to-organic acquisition ratio.

Save Time, Stay Informed
Keep Clients Updated in Real Time
We understand that it's a pain to switch between multiple accounts. With just one login, analyze engagement rates across multiple LinkedIn or other social media and marketing platforms. Work more efficiently by always being up-to-speed on client accounts, then use the time saved to provide valuable insights on the client's campaign performance.
Use scheduled reporting to send professional, branded updates daily, weekly, or monthly—so you’re always one step ahead.

Share the Complete Story
Combine Organic & Paid LinkedIn Performance
Deliver the full picture of your clients’ LinkedIn marketing efforts by combining organic LinkedIn metrics with LinkedIn Ads data in one unified dashboard.
Analyze how paid campaigns boost organic engagement, track ad spend, conversions, and impressions, and uncover actionable insights that connect both sides of LinkedIn performance.

Work Smarter With AI Insights
Instantly Generate Actionable LinkedIn Intelligence
Spend less time interpreting data and more time optimizing strategy. With AI-powered analytics, surface engagement trends, audience patterns, and content opportunities automatically.
Ask AI highlights top-performing posts, identifies declines in engagement rate, and uncovers ranking opportunities—so you can deliver smarter recommendations backed by data.

Built for Marketing Agencies
Trusted by 7,000+ Agencies Worldwide
Join thousands of agencies using AgencyAnalytics to simplify LinkedIn reporting and scale client communication.
From boutique teams to enterprise agencies, marketers trust our white-label dashboards, AI-powered insights, and automated LinkedIn analytics reports to transform complex data into client-ready results—saving time while showcasing your agency’s impact.

Discover the white label reporting tool trusted by 7,000+ marketing agencies.


FAQs About LinkedIn Reporting for Agencies
Still figuring out how to simplify LinkedIn reporting? These expert answers walk agencies through tracking the right metrics, creating branded client dashboards, and automating reporting workflows at scale.
LinkedIn’s native analytics provides a limited snapshot of post performance, impressions, and follower demographics—but it’s built for individual users, not agencies.
AgencyAnalytics turns that same LinkedIn data into automated, branded dashboards designed for multi-client management. Instead of switching between multiple accounts or manually exporting data, agencies can view key LinkedIn metrics—like engagement rate, follower growth, post impressions, and click-throughs—across all clients in one dashboard.
Unlike third-party analytics tools, AgencyAnalytics integrates LinkedIn Ads data alongside organic metrics, visualizes performance in custom dashboards, and provides actionable insights that guide your agency’s strategy. The result: less data collection, more client impact.
Setup takes just minutes. Connect your clients’ LinkedIn company pages once, and data syncs automatically across dashboards and reports—no need to export CSV files or toggle between multiple social media platforms.
Quickly customize dashboards with drag-and-drop widgets, custom metrics, and branded visuals. Add follower demographics, engagement trends, or post performance metrics with a few clicks, then schedule automated LinkedIn reports to keep clients updated.
Agencies use this seamless setup to focus on insights—not data collection—and create a reporting workflow that scales effortlessly as you add more clients.
Track post views, impressions, clicks, engagement rate (likes, comments, shares), follower growth, and demographic details such as industry and job function. These metrics reveal audience reach and engagement trends—and help refine targeting and content strategy.
Yes. Agencies set up scheduled reports or live LinkedIn dashboards that refresh with current data—impressions, engagement, and follower stats. Reports update automatically, removing the need for manual exports in order to keep clients informed with the latest results.
Agencies white label LinkedIn reports on select AgencyAnalytics plans by adding custom logos, brand colors, and a client portal URL. With white‑label branding, each report reflects the agency’s identity and enhances credibility in client presentations.
To build a custom LinkedIn report, agencies start with the LinkedIn report template. They choose target metrics, arrange them using visual widgets, pull in data from LinkedIn alongside over 85 platform data connectors. Then, layer on custom commentary, automated goal tracking, and advanced data visualizations. The result is a polished, strategy-aligned report tailored to each client's needs.
Agencies use standardized, reusable dashboard templates for LinkedIn reporting. Templates are easily duplicated per client, automatically pulling up-to-date LinkedIn analytics for each client account. This streamlines setup, keeps reporting consistent, and enables scalable delivery across dozens or even hundreds of client profiles.
This LinkedIn analytics tool gives agencies real‑time visibility into LinkedIn performance while supporting multiple social media platforms from the same interface. Marketing teams use it to track LinkedIn presence, audience insights and follower growth alongside other channels—making social media management simpler and more efficient.
By pulling rich LinkedIn native analytics and analytics data such as post engagement, impressions, clicks, follower demographics and paid vs organic follower gain, agencies gain detailed insights into how LinkedIn content is performing. These details support a refined LinkedIn strategy and allow social media managers to highlight key performance metrics and make data‑driven recommendations for content creation and audience targeting.
Yes. AgencyAnalytics supports native analytics for organic LinkedIn performance and integrates with the LinkedIn Ads module to bring ad spend, conversions and campaign demographic data into the same view. This unified reporting gives a full picture of both organic and paid social media efforts, so agencies easily compare performance across content and paid campaigns in one streamlined social media analytics tool.
Agencies access historical data across the LinkedIn account—follower trends over time, post engagement across months, ads performance—and use advanced analytics features such as custom widgets, demographic analysis and content‑performance trends. This capability enables social media marketers to provide in‑depth insights, compare performance over time, and deliver the right LinkedIn insights to clients who expect meaningful, long‑term measurement.
Agencies use the LinkedIn analytics tool to generate customizable reports tailored to each client’s objectives. With drag‑and‑drop dashboards, white‑label branding, and support for client logins, the tool simplifies client reporting across multiple customers. Whether your agency tracks a single LinkedIn account or manages dozens, you build repeatable templates, customize widgets for key performance metrics, and automate export scheduling—making reporting efficient, consistent and scalable.
It’s simple and efficient. Once your client’s LinkedIn account is connected, you pull all the data—engagement, followers, reach, and post performance—into a professional dashboard using drag-and-drop widgets. Then, easily generate customizable reports or live dashboards in just a few clicks, giving your clients clear access to key metrics across multiple marketing channels.
An automated LinkedIn reporting tool saves agencies hours of manual work. It pulls real-time data directly from LinkedIn and delivers a holistic view of campaign effectiveness across LinkedIn, LinkedIn Ads, and other marketing channels. Track audience growth, engagement, and content performance—then present those insights in client-ready dashboards that are easy to interpret. The LinkedIn analytics & reporting tool simplifies complex data into customizable reports built for strategic decisions.
Native LinkedIn tools offer in-app analytics, but they’re not built for multi-client reporting. With AgencyAnalytics, you access all your data across accounts in one place, create white-label reports, and schedule automated exports—without jumping between dashboards. Unlike third-party tools or native views, you get a holistic view across platforms, deeper insights, and features like custom widgets, multi-channel dashboards, and advanced features for reporting at scale.
It takes under 30 minutes to build a LinkedIn report using prebuilt templates, drag-and-drop widgets, and automated data pulls. After initial setup, the reporting tool refreshes the data on schedule—freeing your team from manual reporting and letting them focus on strategy.
More integrations
Everything your agency needs
Automated Reports
White Label Dashboard
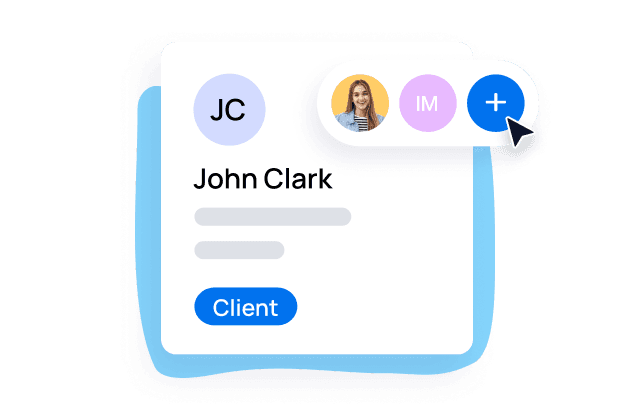
Client & Staff Access
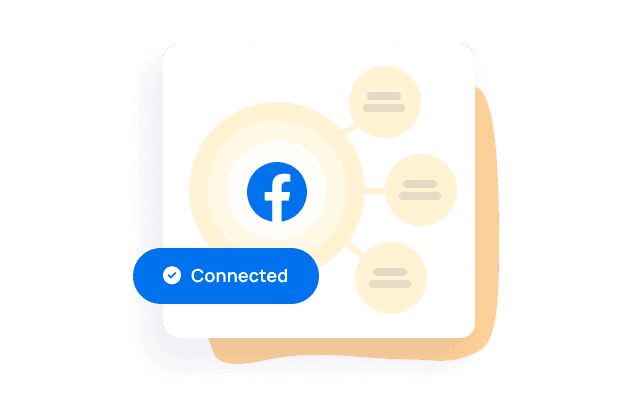
Connect Your Data
AI Powered
