Continuous Data
Analyzing User Engagement
Track session duration and scroll depth to refine content strategies.
Optimizing Ad Performance
Monitor click-through rates and bid adjustments to maximize ad efficiency.
Improving Conversion Rates
Evaluate form completion time and checkout duration to reduce friction.
Showcasing Client ROI
Highlight revenue trends and performance shifts in reports to prove campaign value.
Why Continuous Data Is Important
Tracking metrics with Continuous Data provides a deeper understanding of user behavior and campaign performance. Unlike Discrete Data, which is limited to whole numbers, Continuous data can be decimal points, variables, and intervals, making it more precise.
Since it captures values like time, revenue, and engagement, it reveals trends that help marketers refine strategies based on precise measurements and real user interactions. By incorporating quantitative data into data collection efforts, marketers gain valuable insights that support data-driven decisions and improve campaign effectiveness.
Continuous Data reveals performance nuances within an infinite range, helping pinpoint inefficiencies, optimize user experiences, and improve key marketing touchpoints through statistical analysis. Whether adjusting ad spend, refining website UX, or analyzing revenue trends, leveraging continuous variables ensures informed decision-making based on deeper insights rather than broad assumptions.
Stop Wasting Time on Manual Reports... Get Insights Faster With AgencyAnalytics
How Continuous Data Relates To Other KPIs
Continuous Data plays a vital role in effectively analyzing data, offering precise measurements that influence key marketing KPIs. Metrics like Time on Site, Bounce Rate, and Conversion Rate rely on Continuous Data values to track engagement trends.
Advertising metrics such as Cost per Click (CPC) and Return on Ad Spend (ROAS) fluctuate within a continuous spectrum, requiring deeper insights through statistical analysis. By tracking numerical data over time intervals, marketers gain insights into campaign performance, helping refine ad spend and targeting.
Revenue-focused KPIs, including Customer Lifetime Value (CLV) and Average Order Value (AOV), depend on analyzing Continuous Data to create more accurate predictions. These insights support informed decision-making in pricing strategies, retention efforts, and financial markets, ensuring data-driven decisions that drive growth.
KPIs are common metrics the client and our agency agree are valuable. This allows us to have beneficial conversations and move their business in the direction they want. We’re not wasting time or resources on anything the client doesn’t understand.
How To Visualize Continuous Data
Visualizing Continuous Data helps marketing agencies quickly identify trends, patterns, and opportunities for optimization, while also simplifying complex concepts for clients during presentations. Line charts are one of the most effective tools, for example, showing how Conversion Rates from a paid ad campaign evolve daily or weekly. Heatmaps are another way to provide quick insights, for example, showing how metrics like Time on Site might be influenced by changes to UX. Tools like AgencyAnalytics instantly generate white labeled data visualizations that make it easy for agencies to demonstrate ROI and simplify findings in the Continuous Data.
When is a Good Time To Use Continuous Data?
Continuous Data is ideal for tracking trends over time, such as session duration, revenue trends, or engagement rates. When analyzing quantitative data with an infinite number of possible values, like Conversion Rates or Customer Lifetime Value, Continuous Data provides key insights using line graphs, bar charts, and scatter plots for informed decision-making.
What is a Bad Time To Use Continuous Data?
Avoid using Continuous Data when exact counts are needed, such as number of purchases or total email signups. In cases where numbers with separate values provide clearer insights, such as tracking unique customers or completed transactions, analyzing Discrete Data may be more effective.
Why Continuous Data Matters to Clients
For clients, Continuous Data provides a clearer picture of performance beyond basic totals. Continuous variables like Session Duration, revenue trends, and Engagement Rates reveal how interactions change over time, offering key insights into audience behavior. Tracking these shifts helps businesses assess marketing effectiveness with precise measurements rather than isolated numbers.
Monitoring Continuous Data over time helps clients identify trends early, such as drops in Conversion Rates or Time on Site, which may signal friction in the user journey. Historical data also reveals seasonal shifts or performance dips before they impact revenue. Visual tools like scatter plots, bar charts, and line graphs make trend analysis easier, while combining continuous metrics (e.g., customer spend trends) with Discrete Data (e.g., total sales) provides a well-rounded performance evaluation.
Why Continuous Data Matters to Agencies
For agencies, Continuous Data is essential for fine-tuning performance strategies. Metrics like Cost per Click (CPC), Session Duration, and Ad Engagement Rates offer dynamic insights into how user interactions evolve over time. Tracking these continuous variables enables agencies to monitor real-time trends, identify patterns, and make quick, data-driven adjustments.
Agencies use quantitative data to test and refine marketing strategies, and compare different values across audiences, devices, and platforms. If a campaign’s CPC rises or Bounce Rate spikes, immediate optimizations can be made by adjusting ad targeting, messaging, or landing page design. This analytical approach ensures that marketing dollars are spent effectively, improving ROI.
Beyond short-term optimizations, agencies leverage Continuous Data analysis to set benchmarks and forecast future trends. By analyzing historical data points and comparing examples of Discrete (e.g., total leads) vs Continuous Data (e.g., lead quality over time), agencies back-calculate the correct number of Conversions needed to hit revenue targets. This strategic use of numerical data helps agencies provide key insights that drive long-term client success.

Automated Client Reports. Ready in 30 Minutes or Less.
Best Practices When Analyzing and Reporting on Continuous Data
Conducting a comprehensive analysis of Continuous Data allows marketing professionals to refine their strategies, ensure accurate performance tracking, and optimize campaign performance effectively.
Ensure Data Accuracy
To create data-driven insights, verify that Continuous Data is collected consistently. Use standardized methods to reduce errors, ensuring discrete values and Continuous Data remain reliable. Cross-check data types for accuracy and validate possible values before reporting.
Analyze Over Time
Tracking Continuous Data across a timeline provides insights into patterns, trends, and fluctuations. It allows for a more granular understanding and offers an infinite number of potential values that help optimize marketing strategies effectively.
Compare Across Channels
Understanding Discrete or Continuous Data across marketing channels ensures performance consistency. Tracking different values from multiple sources should be standardized to ensure consistent performance measurement across social media, paid advertising, and organic search channels.
Interpret Trends and Anomalies
Detecting shifts in performance requires identifying both expected trends and unexpected anomalies. Continuous Data reveals fluctuations that may indicate opportunities or concerns, distinguishing between normal variance and significant outliers.
Visualize Continuous Data Performance
Graphical representations highlight trends within Continuous Data. Visualizing Continuous Data helps marketers interpret performance across different values with decimal points for precise insights.
Align Continuous Data to Client Goals
Align continuous data analysis with client objectives by linking metrics to specific goals, demonstrating how performance improvements impact their bottom line. This approach ensures reporting stays relevant, actionable, and aligned with the client’s strategic priorities.
KPIs are important to clients because they want to understand how much they are spending, what they are spending it on and most importantly, what is the return on their spend. They also want to be able to measure the progress of the marketing campaigns month over month.
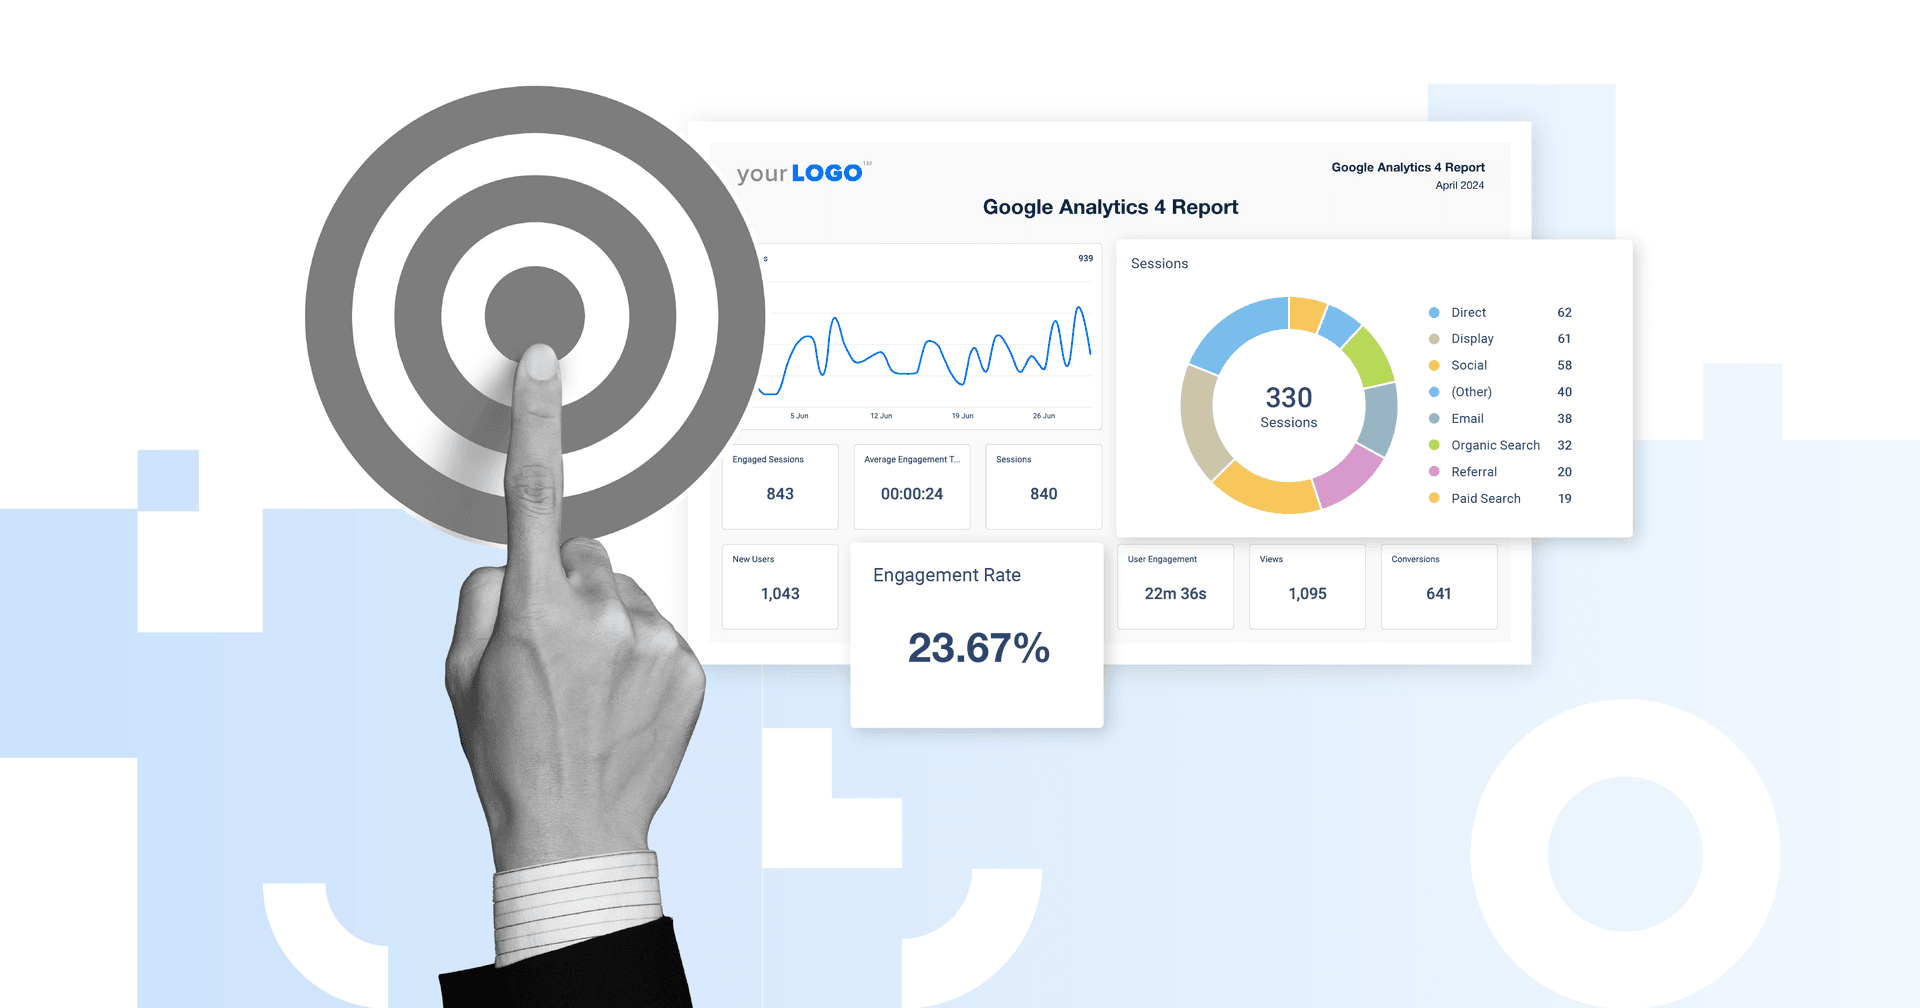
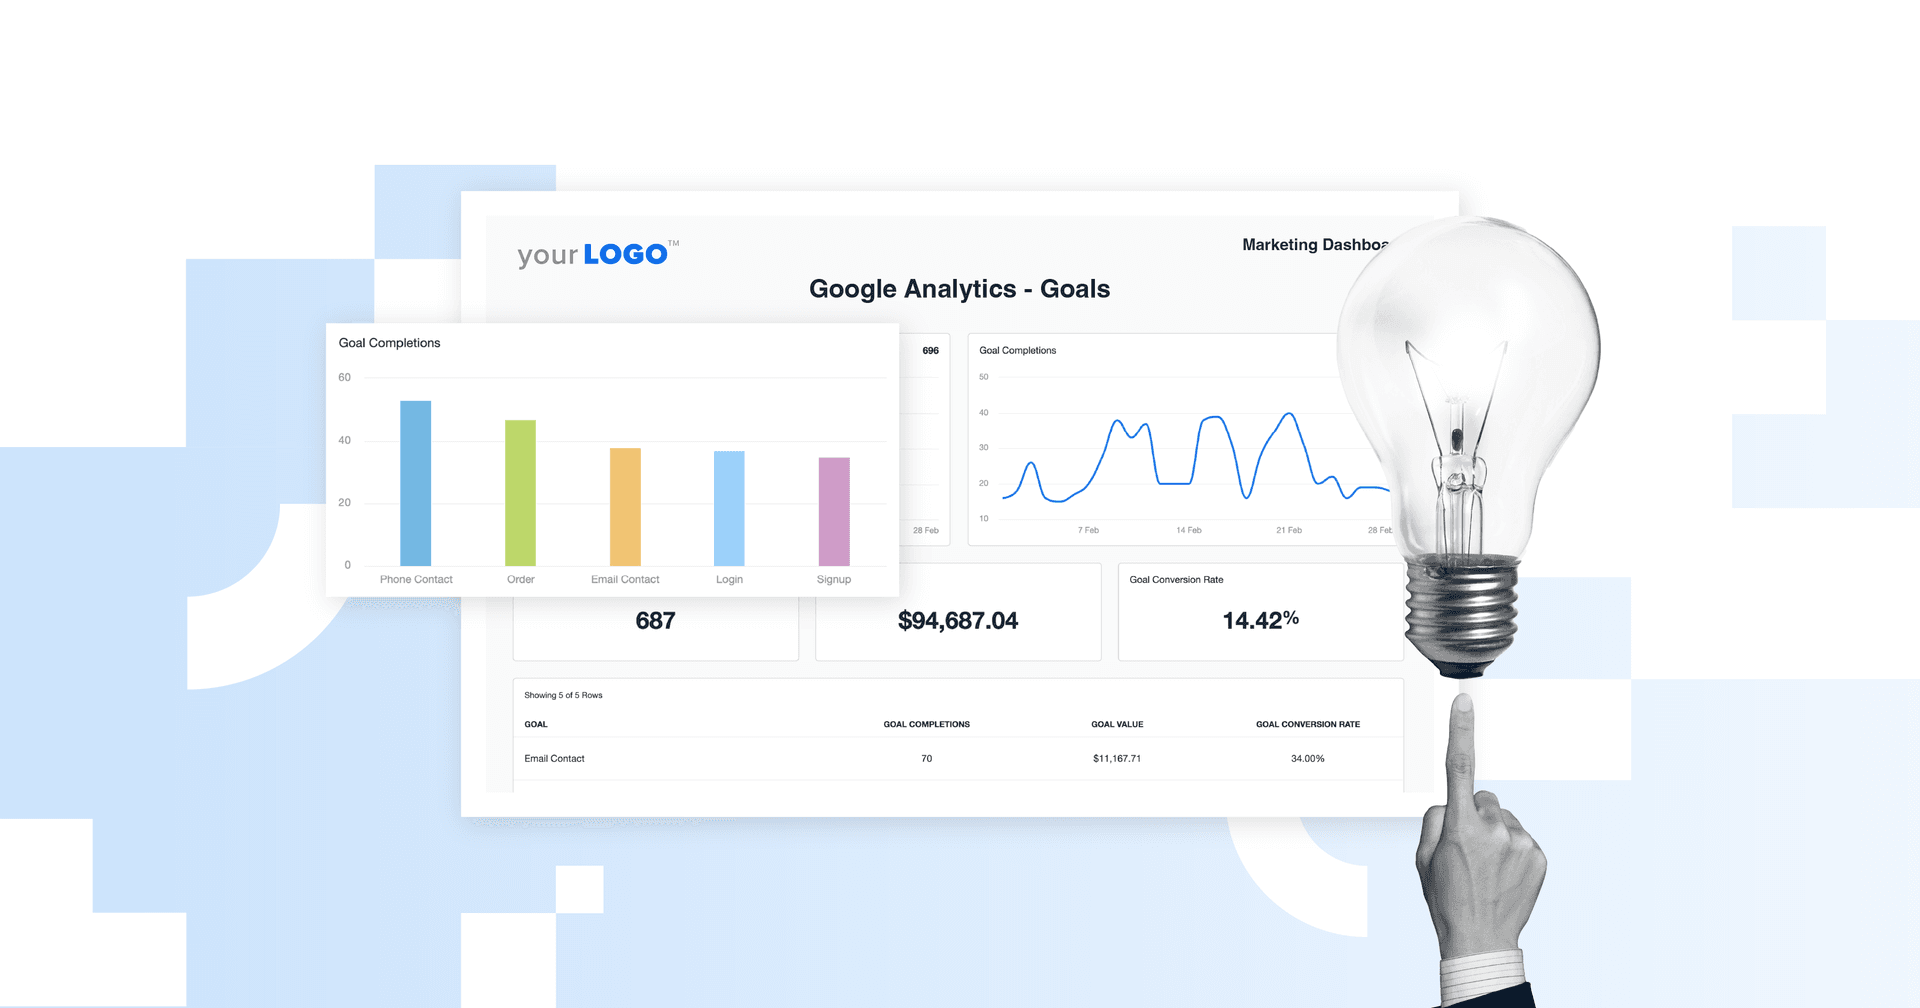
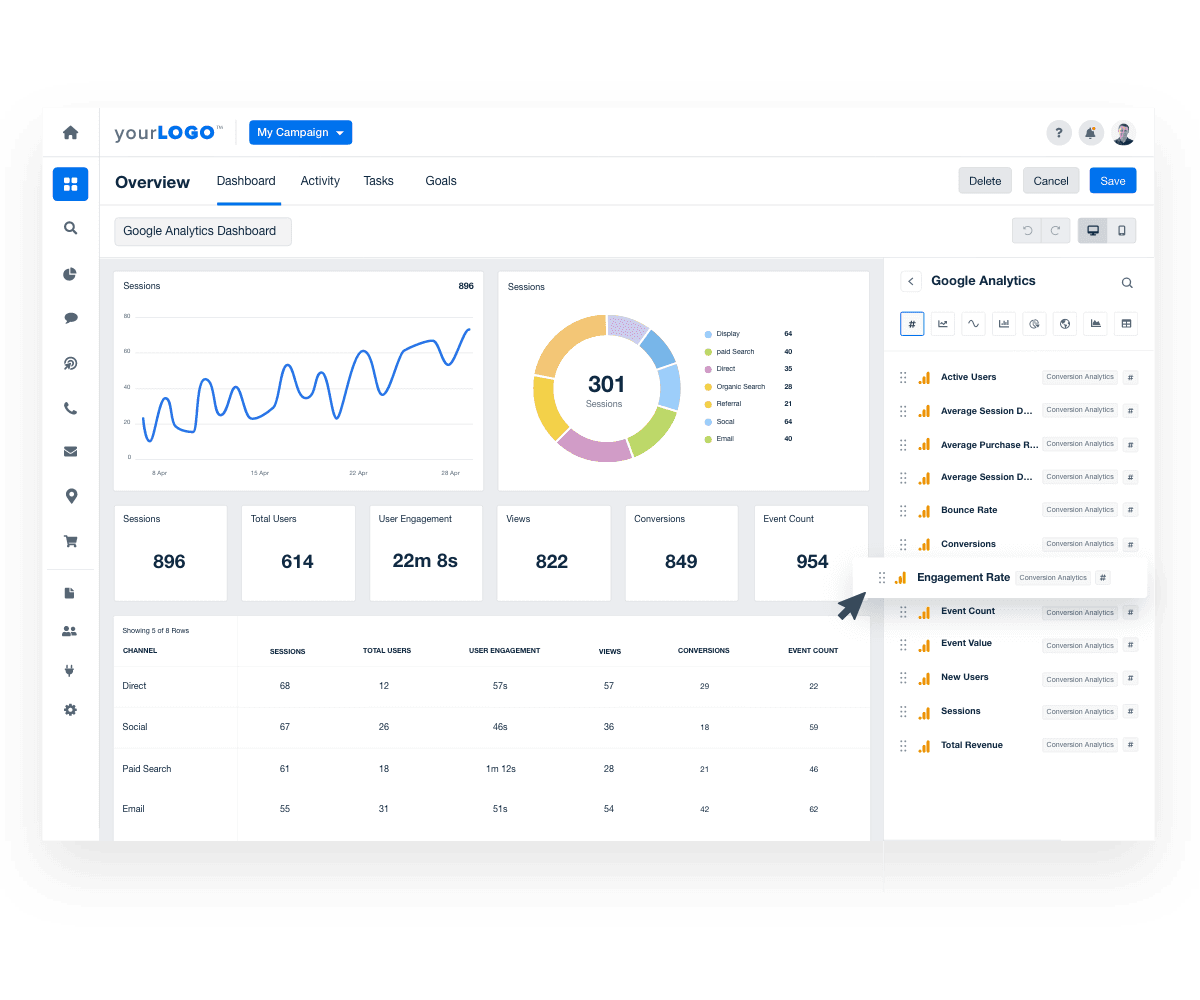
Google Analytics 4 Dashboard Example
How To Use Continuous Data To Improve Marketing Insights
Optimize Customer Segmentation
By integrating qualitative and quantitative data, marketers refine audience segmentation beyond Discrete variables, uncovering behavioral patterns that drive Engagement and Conversion.
Improve A/B Testing Accuracy
Instead of relying only on two values, such as clicks vs. no clicks, incorporating continuous metrics, like Dwell Time, allows for more precise performance evaluation.
Identify Conversion Bottlenecks
Use Continuous Data like Session Duration and Scroll Depth to find friction points, improving conversions more effectively than relying only on Discrete Data like Clicks.
Related Blog Posts
See how 7,000+ marketing agencies help clients win
Free 14-day trial. No credit card required.


