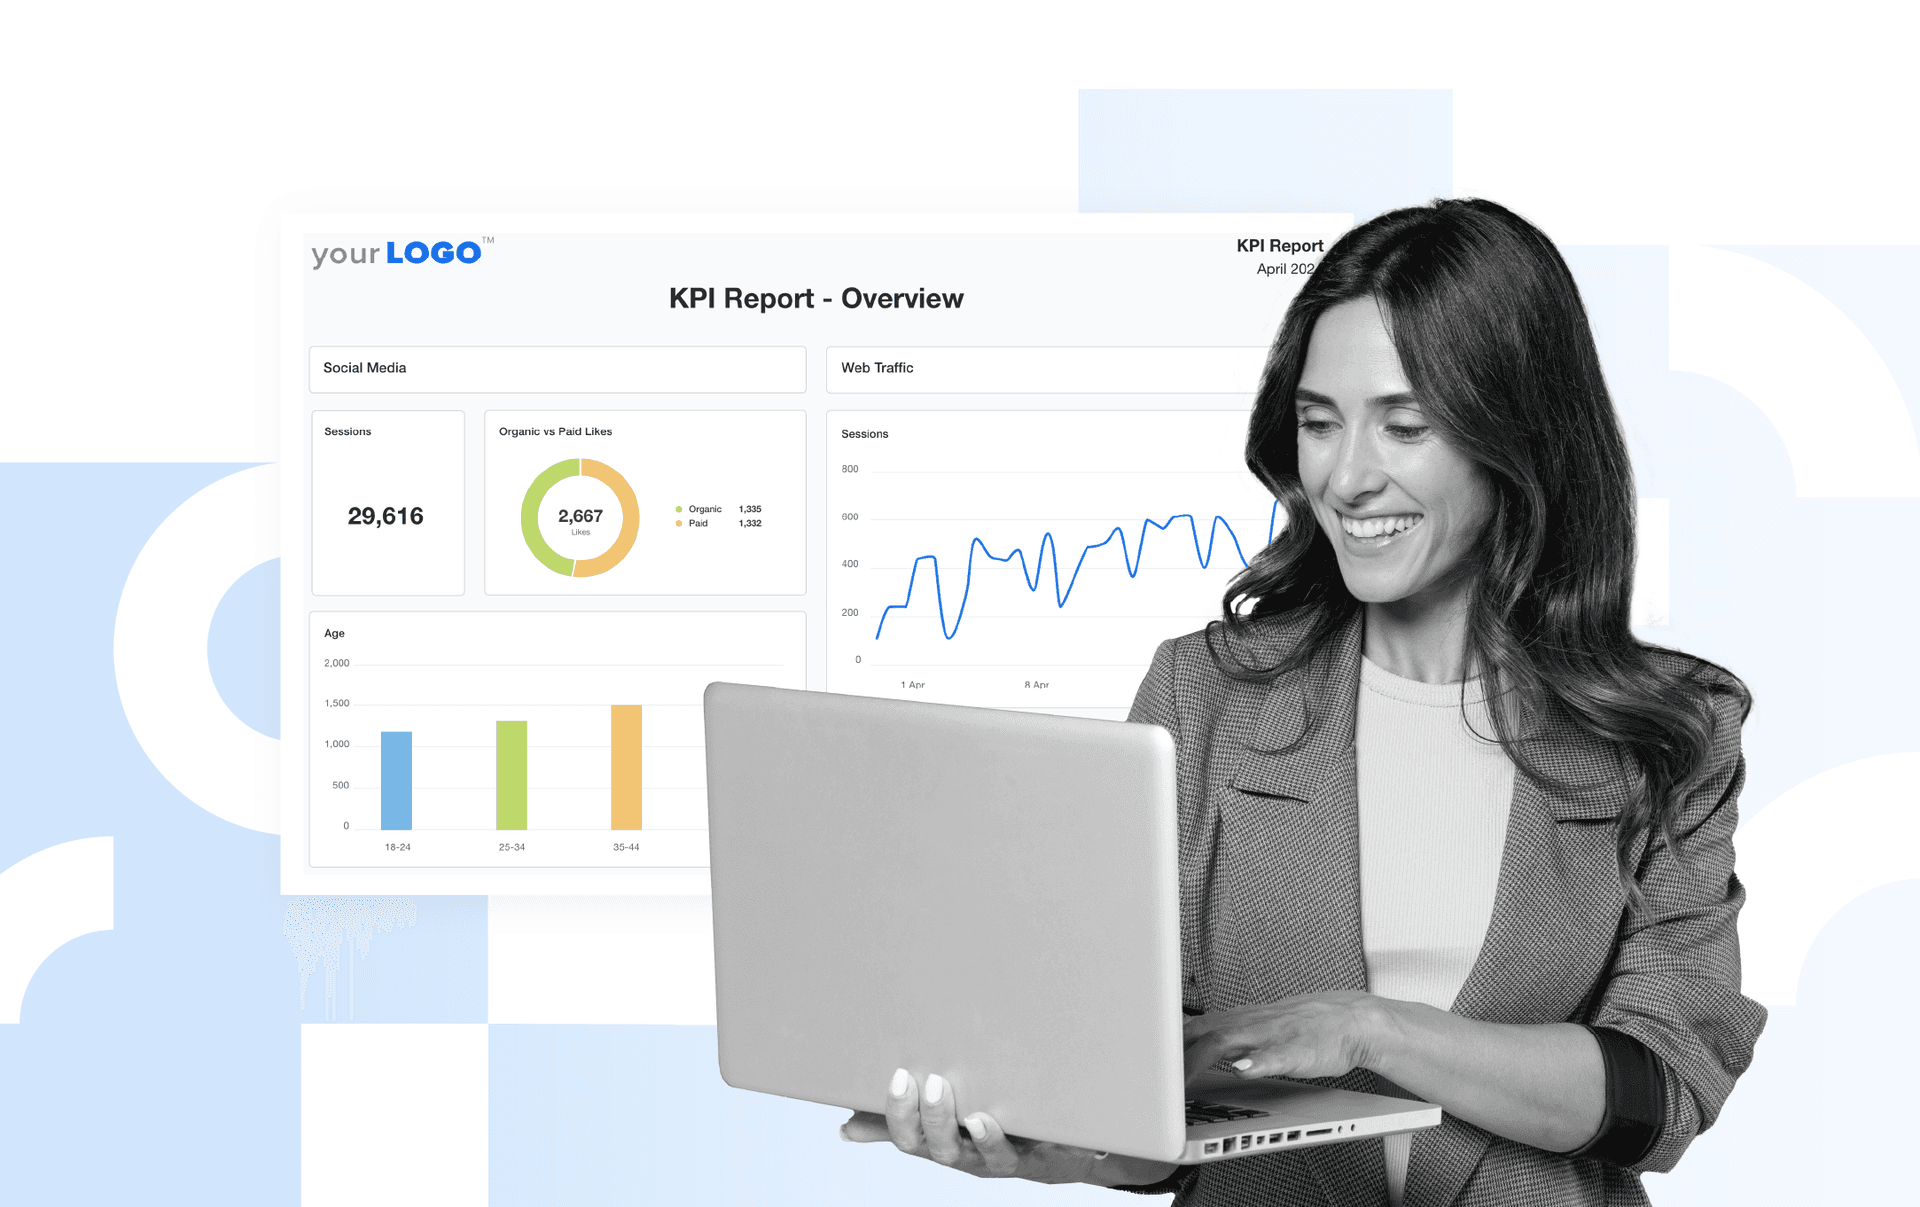
Cost of Goods Sold
Profit Margin Insight
Evaluate profitability by subtracting COGS from revenue.
Inventory Management
Assess inventory efficiency by tracking production and purchasing costs.
Price Setting
Guide pricing strategies by determining the minimum viable purchase price for profitability.
Client Reporting Value
Demonstrate operational efficiency and profit margins to clients.
Why Cost of Goods Sold Is Important
Cost of Goods Sold measures the direct costs incurred to produce or purchase goods sold, including raw materials, direct labor, and factory overhead. It shows up on a company’s income statement and affects gross profit by subtracting these costs from sales revenue. Getting COGS right helps businesses set accurate prices and maintain healthy profit margins.
Tracking Cost of Goods Sold helps identify if production costs, storage costs, sales costs, or variable costs (like shipping costs) are eating into profits. Agencies that monitor this metric help clients spot trends, like rising distribution costs or excess inventory purchased, which may impact business expenses. Evaluating COGS in each accounting period also supports better decisions on inventory turnover and reduces income tax liability.
Accurate COGS reporting shows clients that operating costs are under control and highlights areas where profitability can improve—making agencies a key partner in driving smarter financial strategies.

Stop Wasting Time on Reports. Get Marketing Insights in Minutes With AgencyAnalytics.
How Cost of Goods Sold Relates To Other KPIs
Cost of Goods Sold connects directly to a business’s Gross Profit Margin by showing how much profit is left after covering the exact Cost of Goods Sold. It also affects Net Income on income statements, giving a clear picture of overall profitability.
Inventory Turnover depends on accurate COGS. A higher turnover shows that inventory sold quickly, meaning raw materials and production costs were well-managed. A lower turnover could mean excess ending inventory, driving up storage costs and other expenses.
Cost of Goods Sold also ties into Operating Expenses (or indirect expenses), like marketing costs or office supplies, helping businesses monitor production costs and overhead expenses. Monitoring these numbers ensures a good profit margin while controlling other business expenses.
Key Factors That Impact Cost of Goods Sold
Several factors influence Cost of Goods Sold. The cost of raw materials and direct labor costs are major drivers. If these direct expenses increase, the company’s gross profit takes a hit. Keeping labor and material costs under control helps maintain a healthy profit margin.
The cost accounting method used—like the weighted average cost or average cost method—affects how Cost of Goods Sold is calculated. These methods assign different values to inventory items sold, which impacts the reported costs in each accounting period. Managing overhead costs, such as factory expenses and operational costs, also keeps COGS in check.
Inventory management is key. Starting with the right beginning inventory and tracking additional inventory prevents storage costs from getting too high. A well-managed ending inventory balance sheet ensures there’s just enough inventory remaining, helping businesses avoid extra expenses and improve profitability.

KPIs are common metrics the client and our agency agree are valuable. This allows us to have beneficial conversations and move their business in the direction they want. We’re not wasting time or resources on anything the client doesn’t understand.
How To Calculate Cost of Goods Sold
To calculate COGS, the formula adds up direct expenses like beginning inventory and the costs incurred during the period—such as raw materials and direct labor costs—then subtracts the ending inventory balance. This formula ensures that only the costs directly related to the goods sold are counted.
Cost of Goods Sold Formula Example
What Is a Good Cost of Goods Sold?
A good COGS ensures a healthy profit margin by managing direct labor costs, raw materials costs, and other production expenses well. For many businesses, keeping COGS at 30-40% of sales revenue is a good benchmark, especially in retail businesses aiming to balance product pricing and profitability.
What Is a Bad Cost of Goods Sold?
A high COGS—over 50% of sales revenue—signals rising production costs or poor inventory management. This could result from excess beginning inventory, high overhead costs, or inefficient inventory accounting methods. A poor COGS ratio reduces gross profit and may threaten long-term profitability.
How To Set Cost of Goods Sold Benchmarks and Goals
When benchmarks are unclear, reviewing historical financial statements helps identify patterns in operational costs and business expenses. Calculating Cost of Goods Sold across accounting periods will highlight inefficiencies. Another strategy is using back-calculation—like setting a target gross margin and adjusting production costs and resale costs accordingly. Monitoring inventory turnover and aligning it with service companies or product-focused industries ensures better COGS control.
Why Cost of Goods Sold Matters to Clients
Cost of Goods Sold helps clients understand the direct expenses of producing or purchasing their products. Tracking this metric on financial statements clarifies production efficiency, raw materials cost, and labor costs. A well-managed COGS ensures a healthy gross profit, which boosts profitability and allows for better cash flow management. Clients rely on accurate COGS reporting to plan for tax liability and maintain sustainable pricing strategies.

Why Cost of Goods Sold Matters to Agencies
Agencies track Cost of Goods Sold to show clients how well operational costs and overhead expenses are managed, reinforcing the value they provide. Understanding COGS helps agencies align their strategies with the client’s business goals, such as reducing excess inventory or balancing variable costs. Reporting on COGS ensures that clients see the full impact of the agency’s efforts in improving profitability, inventory turnover, and maintaining a competitive edge with optimized gross margins.

Discover the All-in-One Reporting Tool Trusted by {{customer-count}}+ Marketing Agencies
Best Practices When Analyzing and Reporting on Cost of Goods Sold
Effective analysis of Cost of Goods Sold helps businesses track direct costs, manage inventory and inventory costs, and maintain profitability. These best practices ensure COGS reporting aligns with financial planning goals and supports sound decision-making.
Ensure Data Accuracy
To avoid errors when calculating total cost, use consistent inventory valuation methods and track all direct costs, such as raw material costs and labor.
Analyze Over Time
Compare COGS across multiple accounting periods to spot trends in production costs, resale cost changes, and other costs that impact the company’s profitability.
Compare Across Channels and Campaigns
For retail businesses or service companies, analyze COGS by product lines or services sold to identify which units sold contribute most to profits.
Put in Context
Use benchmarks and average price comparisons to see if current COGS levels align with industry standards and support long-term profitability.
Align To Client Goals
Use COGS analysis to support clients in reaching profitability targets by optimizing inventory levels, controlling business expenses, and setting accurate resale prices.
Visualize Performance
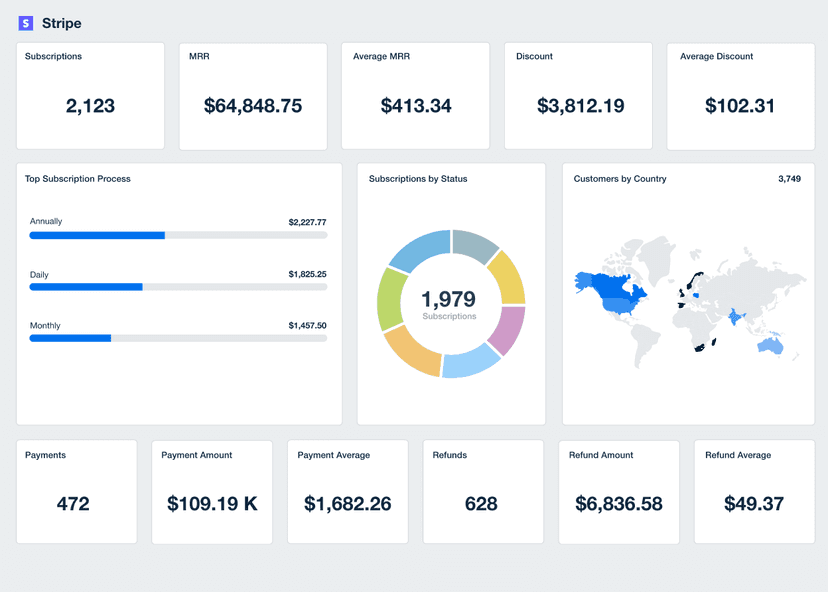
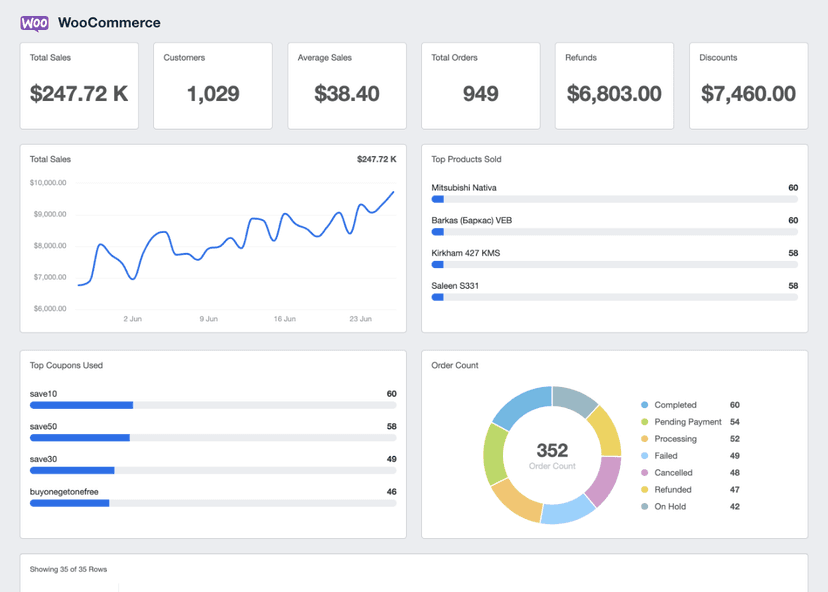
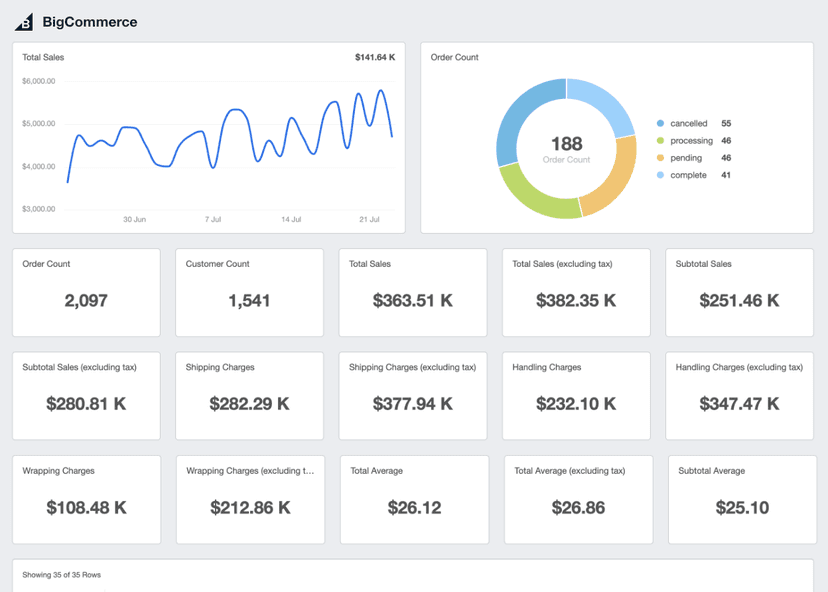
Use dashboards to display COGS alongside metrics like gross profit and inventory levels. This helps clients quickly assess whether inventory and costs are aligned with their business goals.
Professional reports help communicate the results of marketing campaigns, website performance, and other key metrics to stakeholders such as clients, management, and investors. This helps demonstrate the value of the work being done and provides a clear picture of progress towards goals and objectives.
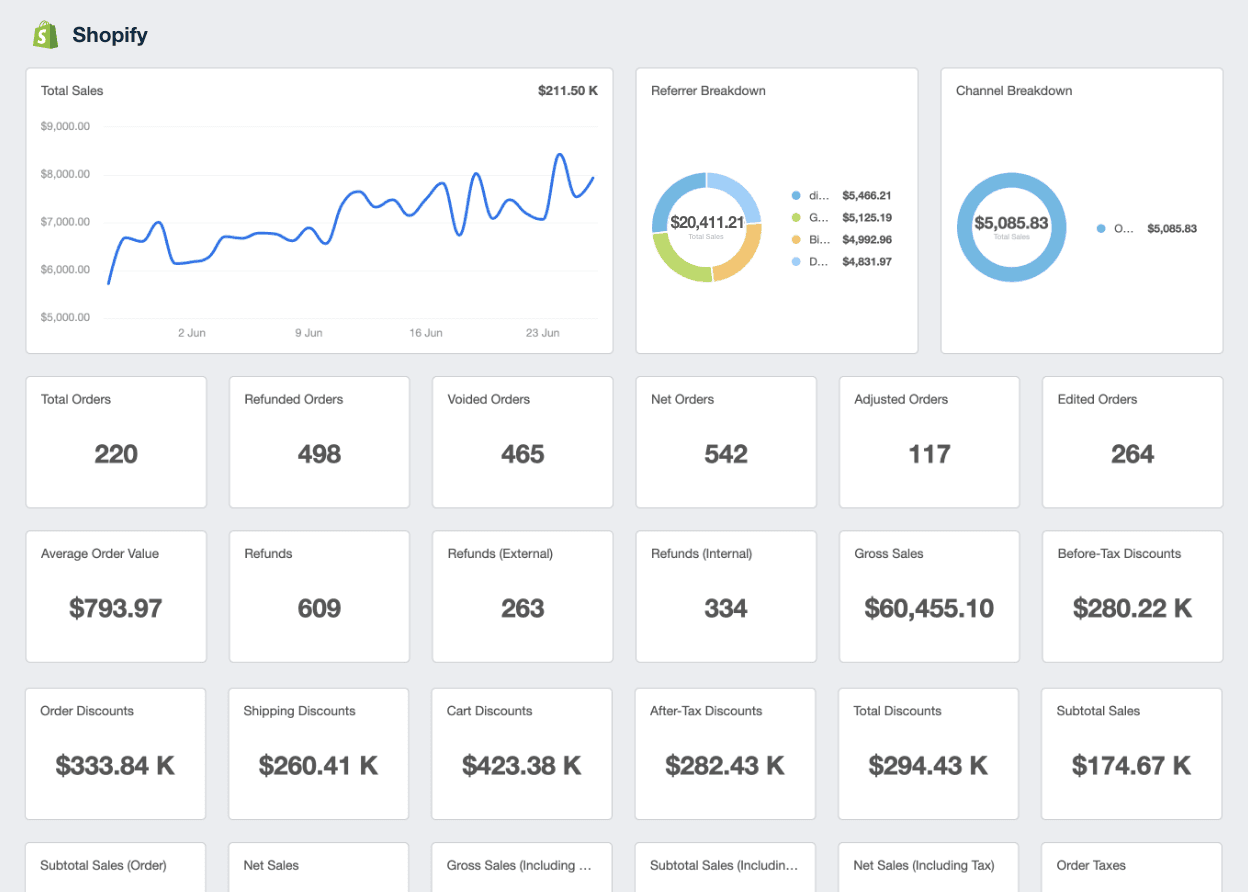
Shopify Dashboard Example
Related Integrations
How To Improve Cost of Goods Sold
Managing COGS effectively involves controlling direct costs, monitoring inventory, and aligning pricing strategies with business performance. For retail businesses, calculating costs accurately ensures that production expenses and business expenses remain balanced. These strategies help maintain profitability, reduce unnecessary costs, and improve financial reporting.
Review Direct Costs Regularly
Regular audits of raw material costs and direct labor provide better control over production expenses, keeping the total cost aligned with profit goals.
Choose the Right Inventory Valuation Method
Applying the weighted average cost or average cost method ensures accurate tracking of goods sold across periods, avoiding discrepancies in financial statements.
Align Pricing With COGS
Ensure resale prices cover direct cost and other business expenses while supporting a healthy gross profit, critical to long-term profitability in product and service-based businesses.
Related Blog Posts
See how 7,000+ marketing agencies help clients win
Free 14-day trial. No credit card required.


