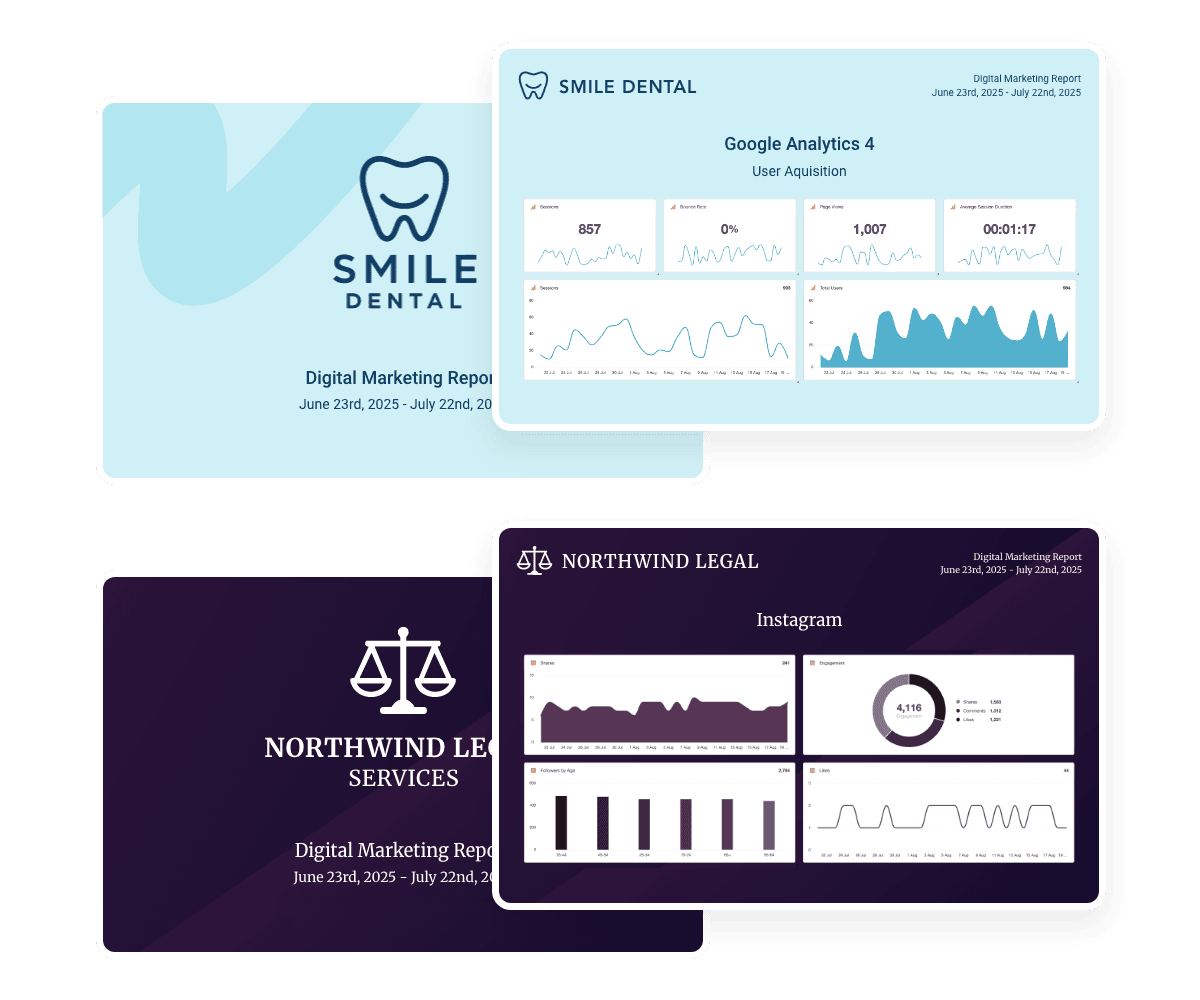
Track client performance with custom marketing dashboards
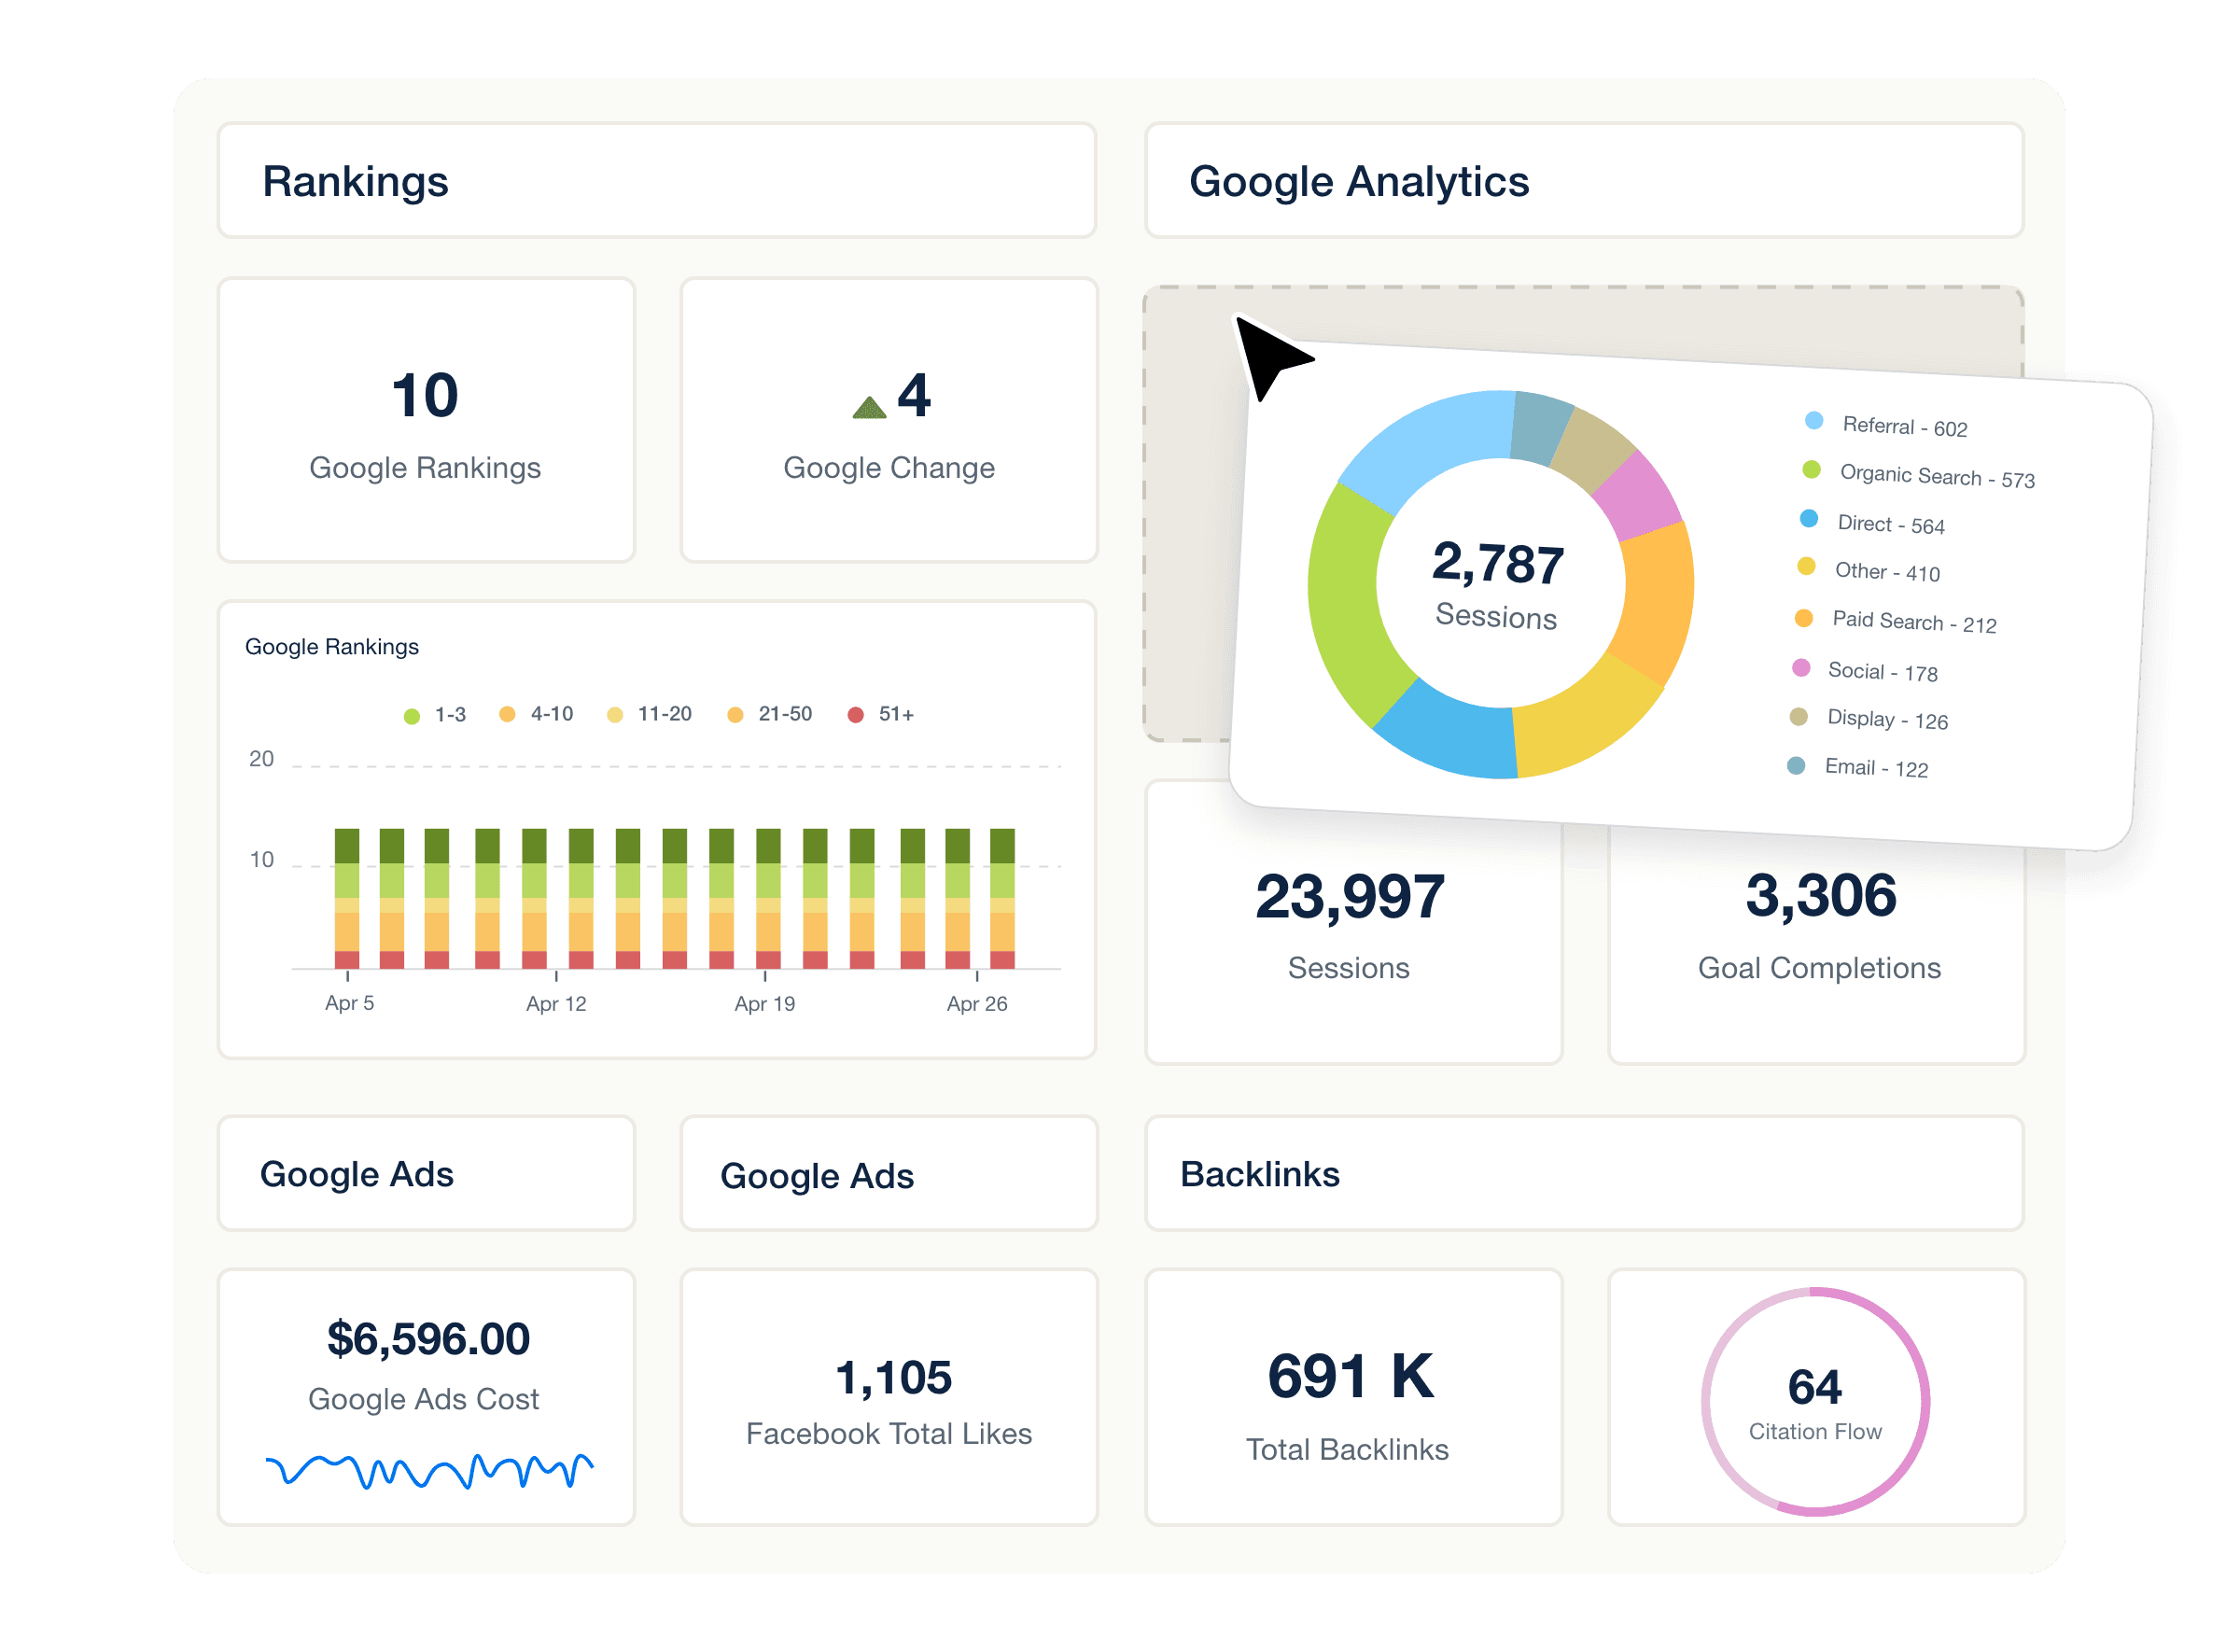
Custom marketing dashboards that align with your vision
Craft client dashboards and reports tailored to your agency’s unique approach to marketing, all without breaking a sweat. Easily personalize each marketing dashboard and report to match your clients' goals and highlight your successes.
100% Customizable
Build fully customizable client dashboards and reports with complete flexibility and control
White Labeled
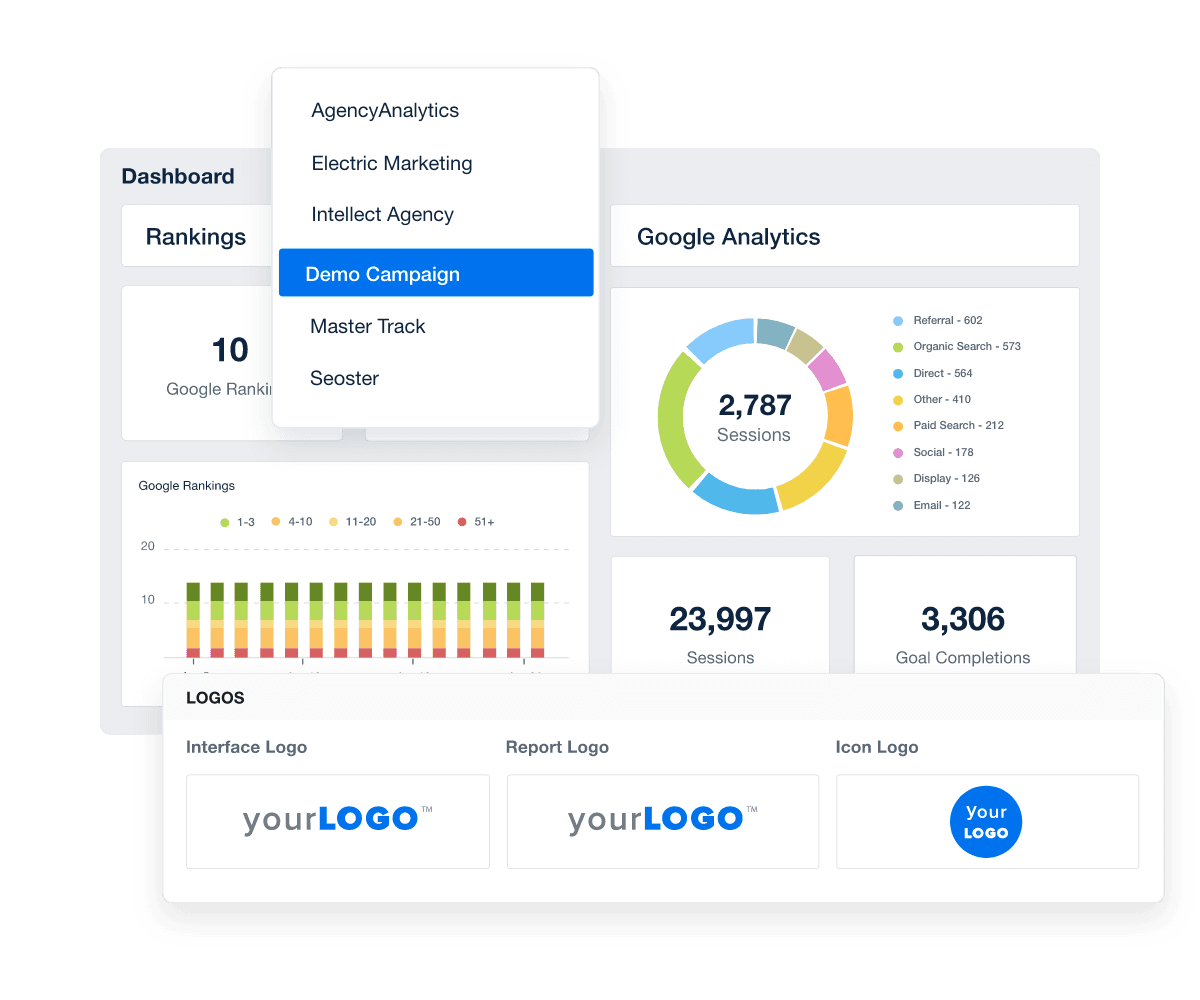
Professionally brand your dashboards and reports with your logo, colors, and even host them on your own domain
80+ Integrations
Access all your clients' marketing data under one roof with an ever-growing selection of integrations
Easy Onboarding
Leverage pre-built dashboard templates or quickly clone existing custom dashboards for new clients
Customizable Analytics Dashboards Based on Your Clients' Goals
Leverage the power of personalization with a digital marketing reporting tool that does the heavy lifting. Address clients' distinct needs using customizable widgets, a drag-and-drop report builder, and white labeling capabilities. Enhance their digital marketing dashboard experience with tailored solutions that showcase results.
Custom Analytics Dashboards with Essential Metrics
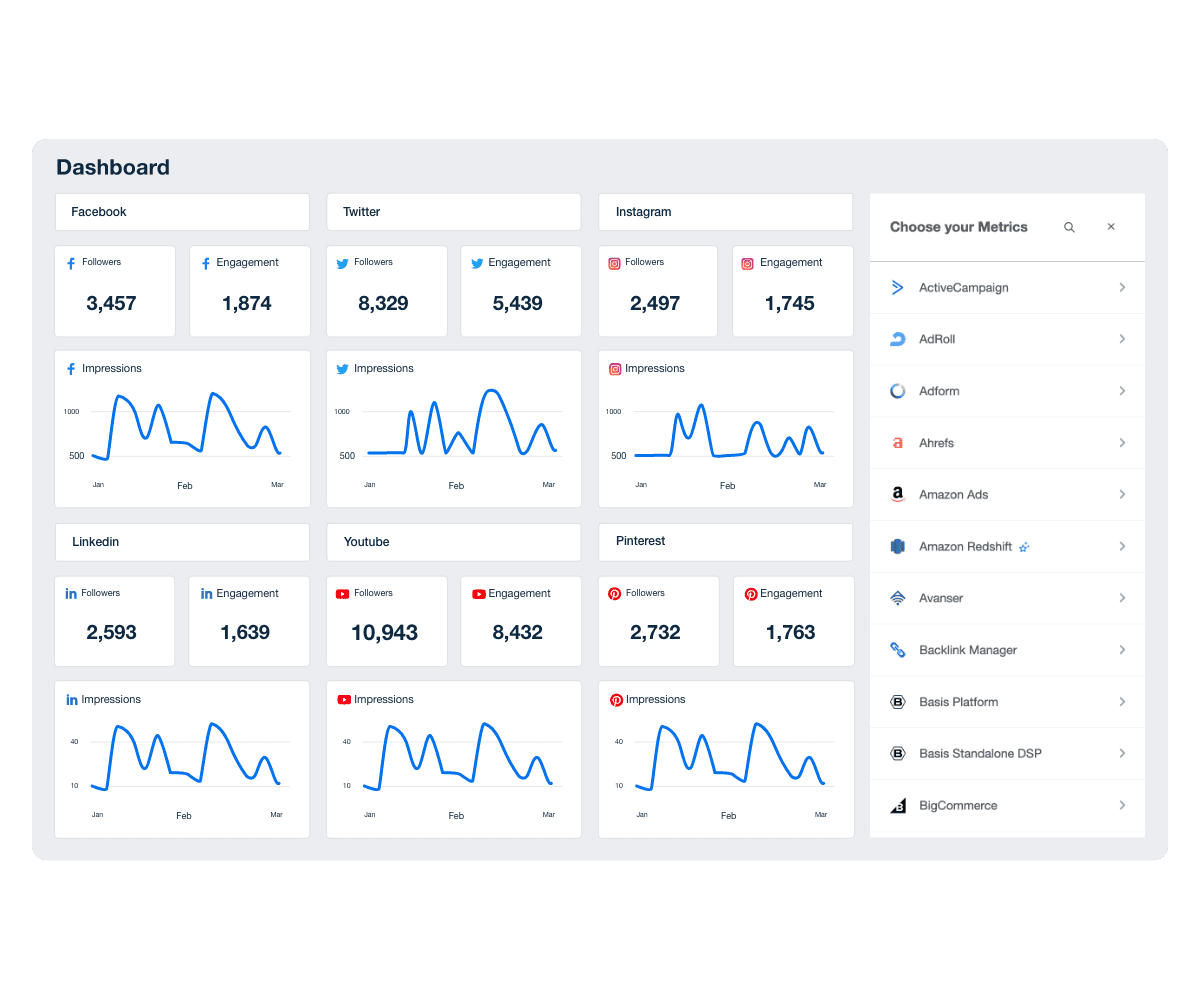
Easily select the KPIs that matter most to your clients from over 80 platform integrations, including Google Analytics, Google Ads, Social Media, SEO, and other popular digital marketing platforms. Unparalleled flexibility allows your agency to craft custom reports focused precisely on the metrics that underline your clients' success stories.
Pull data directly into a client dashboard and provide a tailored view that highlights the impact of your agency’s digital marketing efforts.
Provide Granular Insights with Custom Metrics
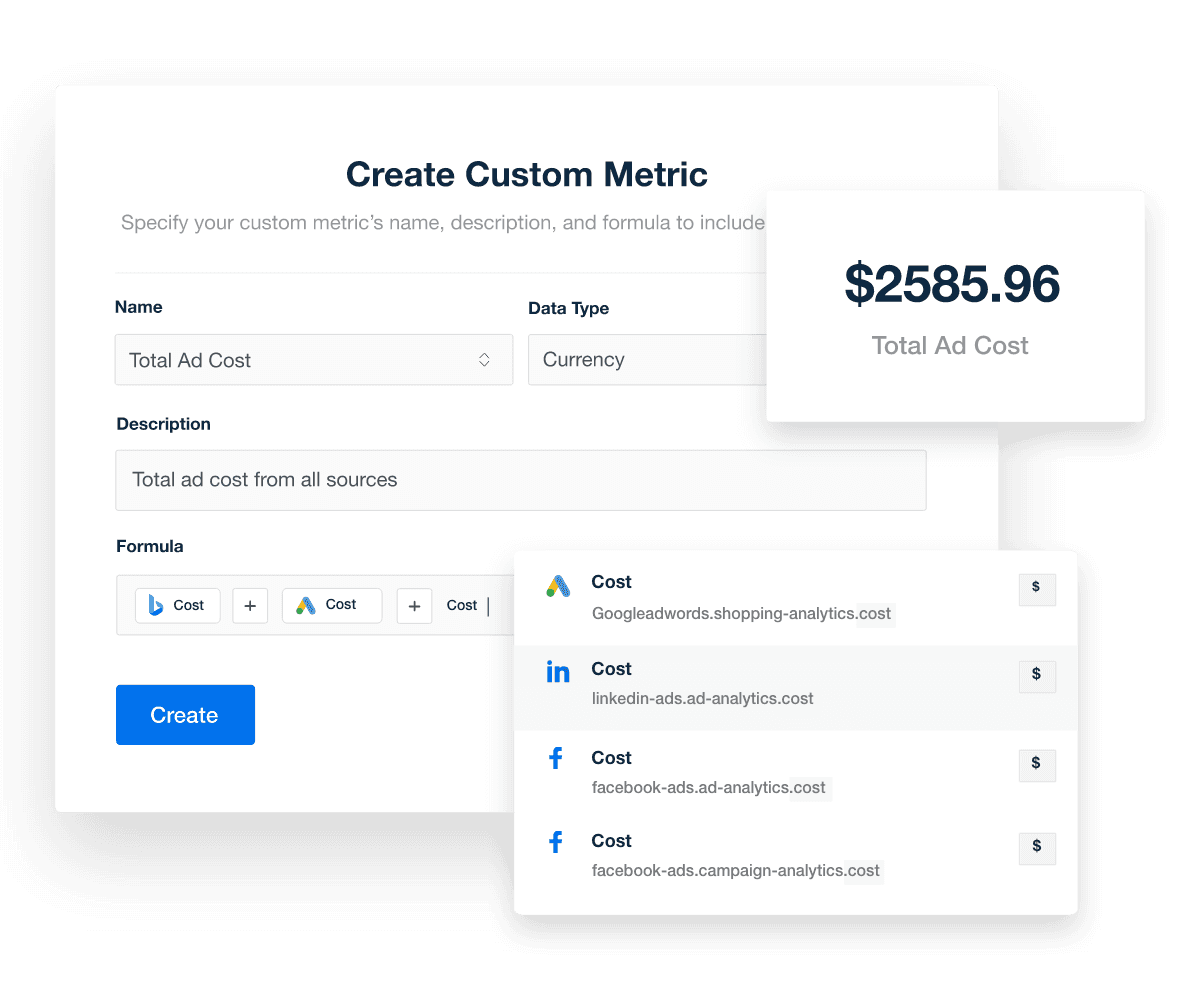
Take each marketing dashboard beyond what’s expected by creating custom metrics for the most in-depth client reporting possible. Combine data points from 80+ integrations into custom blended metrics. With this extra layer of personalization, add elevated insight and transparency to your client reporting.
Set Goals and Exceed Performance Targets
It’s essential to clearly define goals and set performance targets when you’re working with clients. The Goals widget lets you establish monthly targets and track performance on a day-to-day basis in one clear visual. Establish transparency, build trust, and reduce churn by showing clients exactly how they’re progressing toward their business goals.
Add Context to Your Data with Annotations
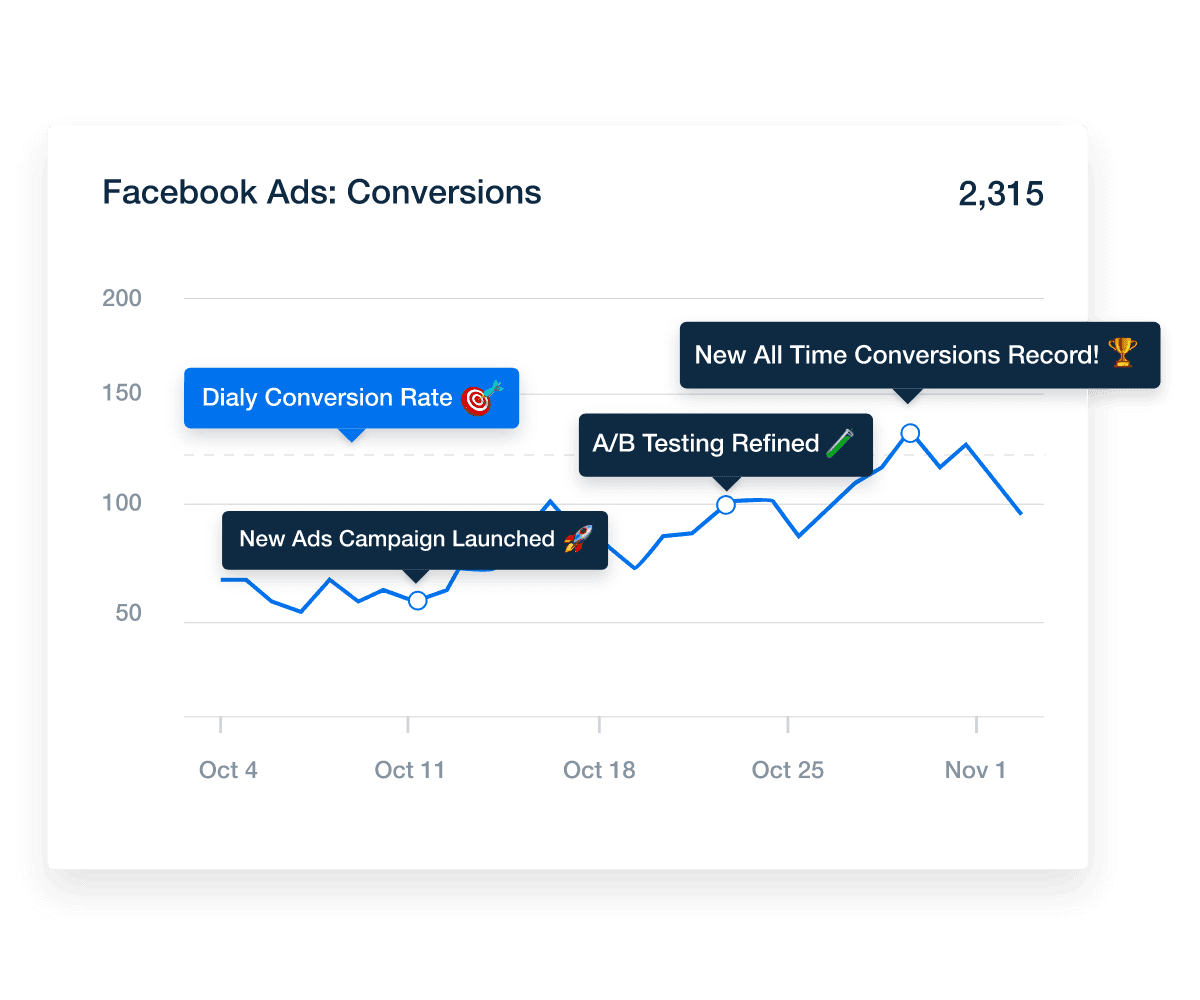
Enrich your clients' marketing data with context. Highlight their campaign changes using annotations on date-based charts. Establish performance benchmarks, integrate KPIs, and craft a compelling narrative with your data, all to support enhanced decision-making.
Design Reports That Look the Part
Agencies win on results—and presentation. The upgraded design experience makes it easy to showcase both. Apply colors, fonts, and images to create cohesive, professional reports that reflect your brand.
Save your favorite styles as themes and use them again with one click. Whether you start from scratch or build on a pre-created design, it’s the fastest way to deliver reporting that feels custom-made.
FAQs About Custom Marketing Dashboards
Still have questions about marketing dashboards? Don’t worry—we’ve got you covered. Here’s everything you need to know to create a personalized, up-to-date dashboard that tracks your marketing performance across all your channels.
A custom analytics dashboard is a centralized platform that helps digital marketers track key performance indicators across multiple marketing channels. It consolidates data from tools such as Google Analytics, SEO tools, Google Ads (and other paid ads), and social media platforms, providing marketing professionals with up-to-date data visualizations that simplify complex data and support informed decision-making.
Customizable analysis dashboards include specific metrics tailored to your marketing strategy, such as website traffic, social media metrics, campaign data, and revenue generated. The best marketing dashboards also integrate email marketing, SEO efforts, and Google Search Console data to display key performance indicators that reflect the overall marketing objectives.
With AgencyAnalytics, you drag and drop data visualizations, integrate data from multiple marketing tools, and monitor campaign results across all channels in one live dashboard.
The right marketing analytics dashboard software centralizes data from all your key data sources into one dashboard. With AgencyAnalytics, visualize marketing metrics, track performance metrics, and create white-label dashboards that make marketing reporting clear and actionable for your whole team—saving time while delivering more business value to clients.
Marketing analytics dashboards eliminate manual work and data silos by automatically pulling up-to-date data from all your marketing platforms. They make it easier for marketers to analyze information, identify areas for improvement, and make data-driven decisions that drive revenue growth.
Creating a personalized marketing dashboard takes just a few clicks with the AgencyAnalytics drag-and-drop editor. Choose from dozens of digital marketing dashboard examples or start from scratch. Import data from Google Ads, LinkedIn Ads, or SEO tools, and customize visualizations to match your clients’ goals and metrics.
To create a custom digital marketing dashboard, start by identifying key marketing metrics tied to your campaigns. Then use a marketing dashboard tool like AgencyAnalytics to automatically import data from multiple platforms, build customizable dashboards with drag-and-drop widgets, and streamline your reporting process. Whether you're building custom dashboards from scratch or using marketing dashboard templates, you'll simplify the reporting processes and improve campaign clarity.
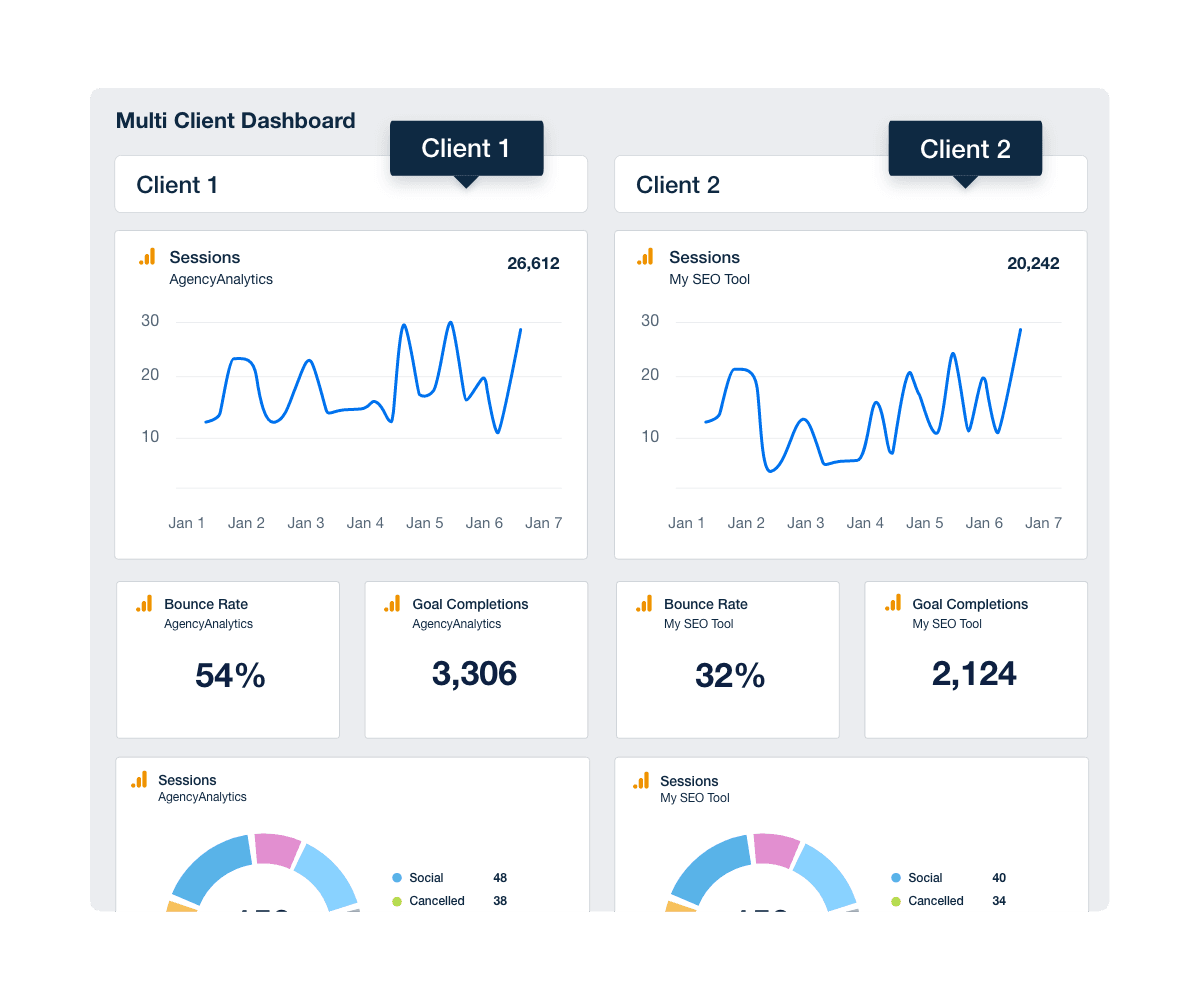
Yes. Agencies often build multiple dashboards for different audiences—such as executives, clients, and marketing teams. For example, a CMO dashboard provides a high-level overview of marketing strategies, revenue growth, and conversion rates, while a PPC dashboard or social media marketing dashboard focuses on campaign-level key metrics like ad spend, click-through rates, and engagement. Each dashboard highlights the most relevant KPIs and visualizations, giving every stakeholder the insights that matter most to their goals.
With AgencyAnalytics, agencies build dashboards in as little as 11 seconds using the Smart Dashboard Builder. The intuitive drag-and-drop dashboard builder automatically populates your widgets with live data from any of the 80+ marketing tools—saving hours of setup time.
The main benefit of using a marketing analytics dashboard is gaining actionable insights from all your data in one place. It helps marketing teams visualize metrics, identify trends, and measure marketing performance without switching between tools. A customized marketing dashboard eliminates guesswork and supports better tracking of demand lead generation metrics through SEO, paid advertising, social media, website performance, and more.
Another key benefit is visibility. A marketing KPI dashboard centralizes data from every marketing campaign, allowing marketers to track performance, spot trends, and make informed decisions—all in one platform.
Customizable analysis dashboards streamline the reporting process by automatically pulling in up-to-date data and organizing it into a shareable format. You can use dashboards for live performance reviews, scheduled reports, or even embed them under a custom domain for client access—saving your marketing team hours every month.
Custom dashboards can be easily converted into automated reports. Instead of manually exporting data, AgencyAnalytics lets you turn live dashboards into white-labeled client reports that update automatically each month.
A marketing analytics dashboard helps marketing teams monitor performance daily with metrics that update frequently. A reporting dashboard is used to summarize those results into structured updates, typically highlighting the most important key performance indicators rather than including the level of in-depth marketing data required for campaign optimization.
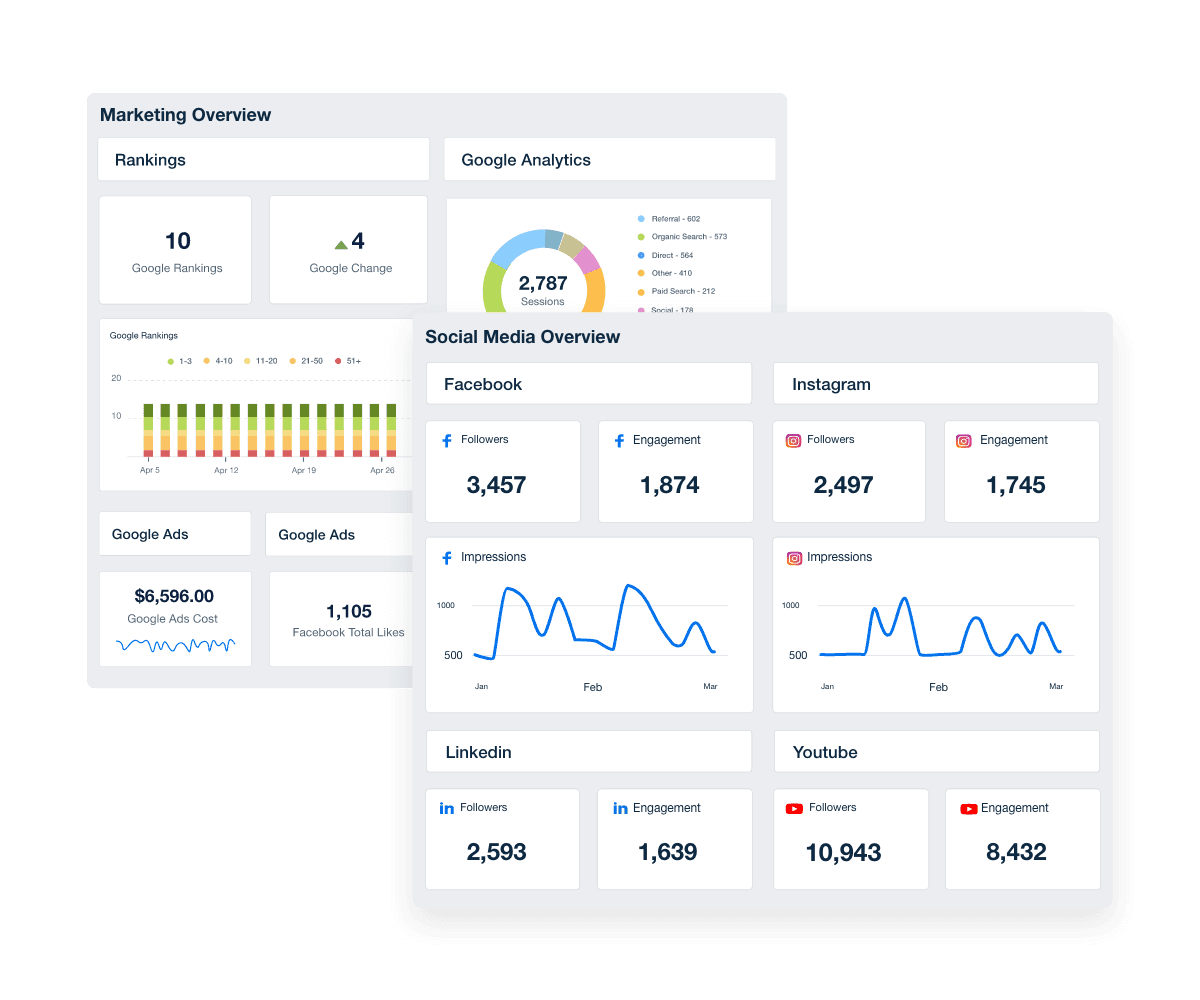
Popular types of marketing dashboards include SEO dashboards for rank tracking, social media marketing dashboards for channel engagement, and web analytics dashboards (most commonly a Google Analytics dashboard) for website performance. Other marketing dashboard examples include email marketing dashboards, PPC dashboards, and content marketing dashboards—each designed to track specific metrics based on your agency’s marketing strategy.
Look for software that connects to all your marketing tools, offers customization options, and automates data collection. The best dashboards—like AgencyAnalytics—integrate data from multiple sources and provide a single platform to analyze your marketing campaigns with minimal manual work.
The best marketing dashboard software makes it easy to import data from all your tools, customize dashboards for each client, and streamline your reporting process. AgencyAnalytics was built specifically for digital marketing agencies—offering customizable dashboards, automated reports, and a user-friendly interface that helps you show the value of your work without the manual effort. Try it free and see the difference it makes.
Yes. AgencyAnalytics offers pre-built templates for SEO, PPC, social media, and more—making it easy to launch dashboards in minutes. From there, quickly customize layouts, add performance metrics, and integrate data from your favorite marketing tools to match each client’s unique marketing efforts.
Unlike generic dashboard tools, AgencyAnalytics is purpose-built for marketing agencies. Easily connect data sources, create custom calculations, and build drag-and-drop white label dashboards for unlimited users. With real-time updates, full white labeling, pre-built templates, and a single platform for all your marketing reporting, it’s designed to help agencies make data-driven decisions quickly.
You get a powerful, scalable solution that improves your team’s efficiency and keeps clients engaged.
More features

Drag and Drop Report Builder

Smart Reports

AI Reporting Tools

SEO Tools

Automated Reports
Client Portals
See how 7,000+ marketing agencies help clients win
Free 14-day trial. No credit card required.


