Table of Contents
Table of Contents
- What is roll-up reporting?
- Why marketers need roll-up reporting
- How roll-up reporting works
- What kind of information is included in a roll-up report?
- Benefits of roll-up reporting
- Top roll-up reporting tools compared
- How to choose the right roll-up reporting tool
- Unlock more relevant analytics with roll-up reporting
7,000+ agencies have ditched manual reports. You can too.
Free 14-Day TrialQUICK SUMMARY:
This article explores how roll-up reporting unifies client data across campaigns and platforms, streamlines reporting, improves insights, and tracks performance, helping agencies turn disparate data into actionable analytics.
If you manage multiple clients–especially franchise clients or anyone with multiple locations–you know how messy reporting can get. Every property has its own dashboard, its own data, and its own quirks. Jumping between tools, exporting spreadsheets, and trying to piece together a full picture of performance (whether for a single client with multiple locations, or a snapshot of your agency’s performance across all your clients) wastes time and creates confusion.
What you really need is clarity: a single, unified view of everything happening across your–or your client’s– portfolio.
Roll-up reports consolidate data from multiple properties into one dashboard, giving decision-makers instant visibility into what’s working–and what’s not. No more manual updates or fragmented insights–just faster, smarter reporting that helps you spot trends, uncover inefficiencies, and make confident decisions.
In this article, we’ll cover how roll-up reporting works, which types of reports bring the most value, and how to structure your roll-ups so you maintain data integrity across every property you manage.
What is roll-up reporting?
Roll-up reporting lets you take aggregate data from multiple source properties and combine it into a single roll-up property. Instead of reviewing a single data set at a time, you can review data across franchises, brands, or entire client portfolios. This saves time and gives you a clear overview of how your clients’ marketing campaigns are performing.
Roll-up reporting also keeps your data organized and accessible when you need it. You don’t always need a deep dive into every client’s metrics–sometimes a high-level overview is enough. The key is being able to toggle between broad, portfolio-wide insights and more focused, granular data so you can cut through the noise and make smarter decisions.
Why marketers need roll-up reporting
Running a marketing agency with dozens of clients–or more–means sorting through a lot of data. While your team is busy shuffling through numbers from multiple sources, trying to get an idea of overall business performance, your competitors are getting ahead.
Instead of spending hours piecing together data from clients with multiple properties, roll-up reporting and dashboards aggregate metrics from all your clients’ data sources, giving you a single data source to refer to and a better idea of overall brand performance.
With roll-up reporting, it’s easy to zoom out to see total performance across a client’s entire portfolio, or your agency’s entire portfolio, then drill down into specific properties, campaigns, or metrics, all within the same dashboard.
This single roll-up property becomes your source of truth for all things related to this specific client, helping you to focus on your client’s business as a whole, identify opportunities, and take note of any challenges the company is facing so you can respond accordingly.
See all your clients’ performance in one place–Try AgencyAnalytics free for 14 days.
How roll-up reporting works
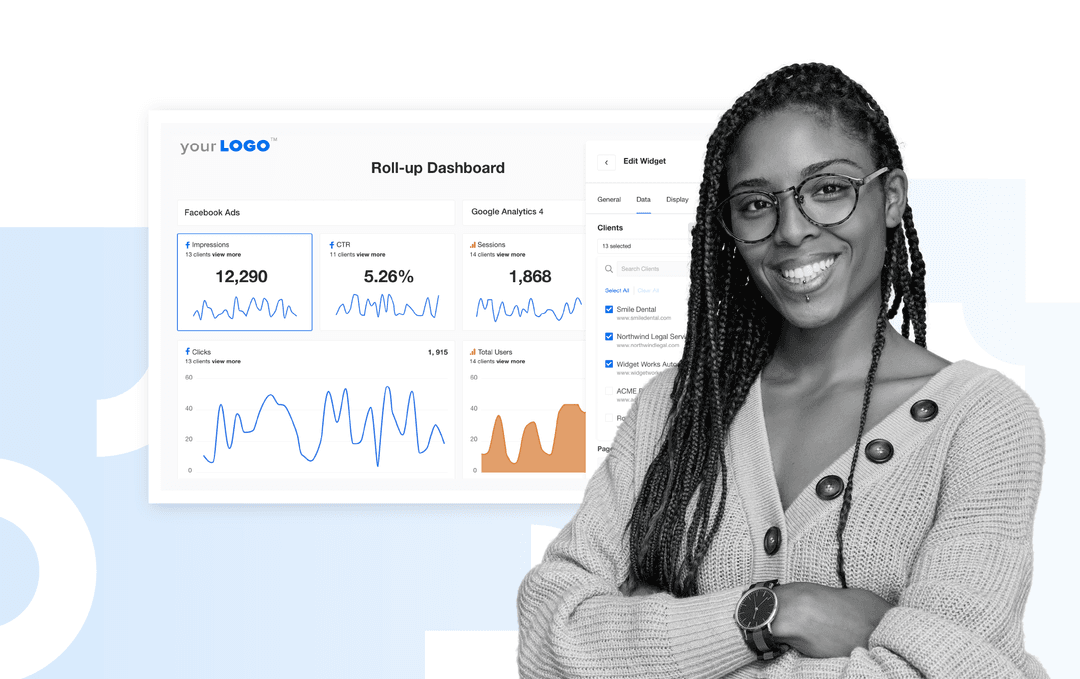
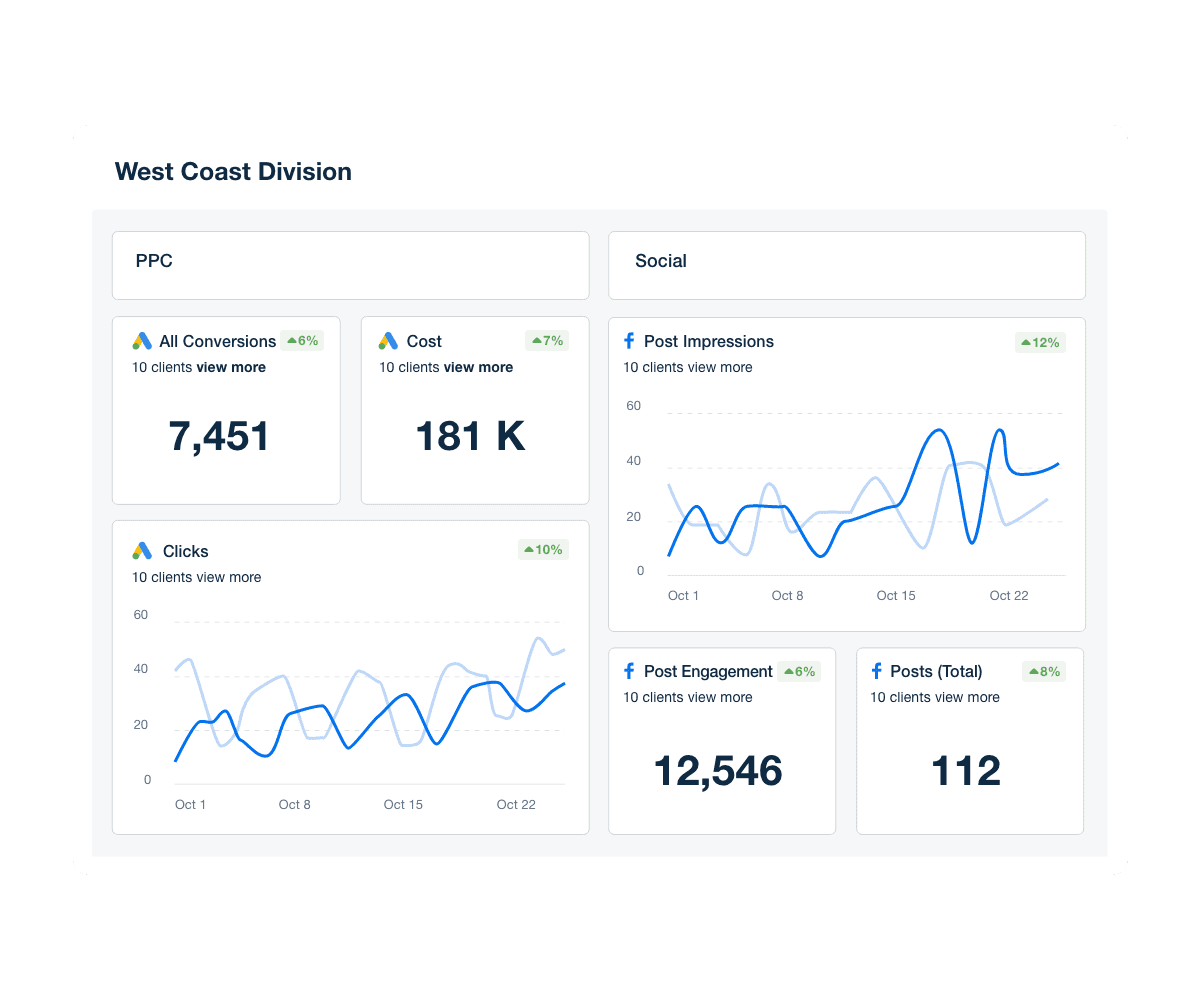
Within AgencyAnalytics, marketing agencies add roll-up widgets to dashboards and reports, bringing together data from different clients, brands, or locations, giving you one clear, high-level view of performance for each group.
You might use a roll-up dashboard for:
Internal performance monitoring to see overall agency performance
A view of performance of groups of clients (for example if you wanted to track performance for specific account managers)
Monitoring overall client performance for multi-location or franchise clients–which can be further broken out into individual locations to see which are performing best
Client visibility on high level performance across a client's multiple locations
By contrast, use a roll-up report to provide clients with a regular performance snapshot proving your agency’s ROI, demonstrating whether you're meeting your targets and where new opportunities exist.
Each roll-up property collects and summarizes data from multiple related websites or apps, giving you a high-level overview tailored to that specific group.
Always ask why. Understand the data and what's behind it. Not only will clients ask for context, but it will also make you a better marketer the more you understand the data.
Valerie Jennings, CEO, Jennings Social Media & MarTech
What kind of information is included in a roll-up report?
A roll-up report gives you a reliable, at-a-glance summary of performance across all clients, websites, or franchises. Instead of switching between dashboards, you can instantly see how all campaigns, websites, and channels perform across your portfolio.
Here’s what’s typically included:
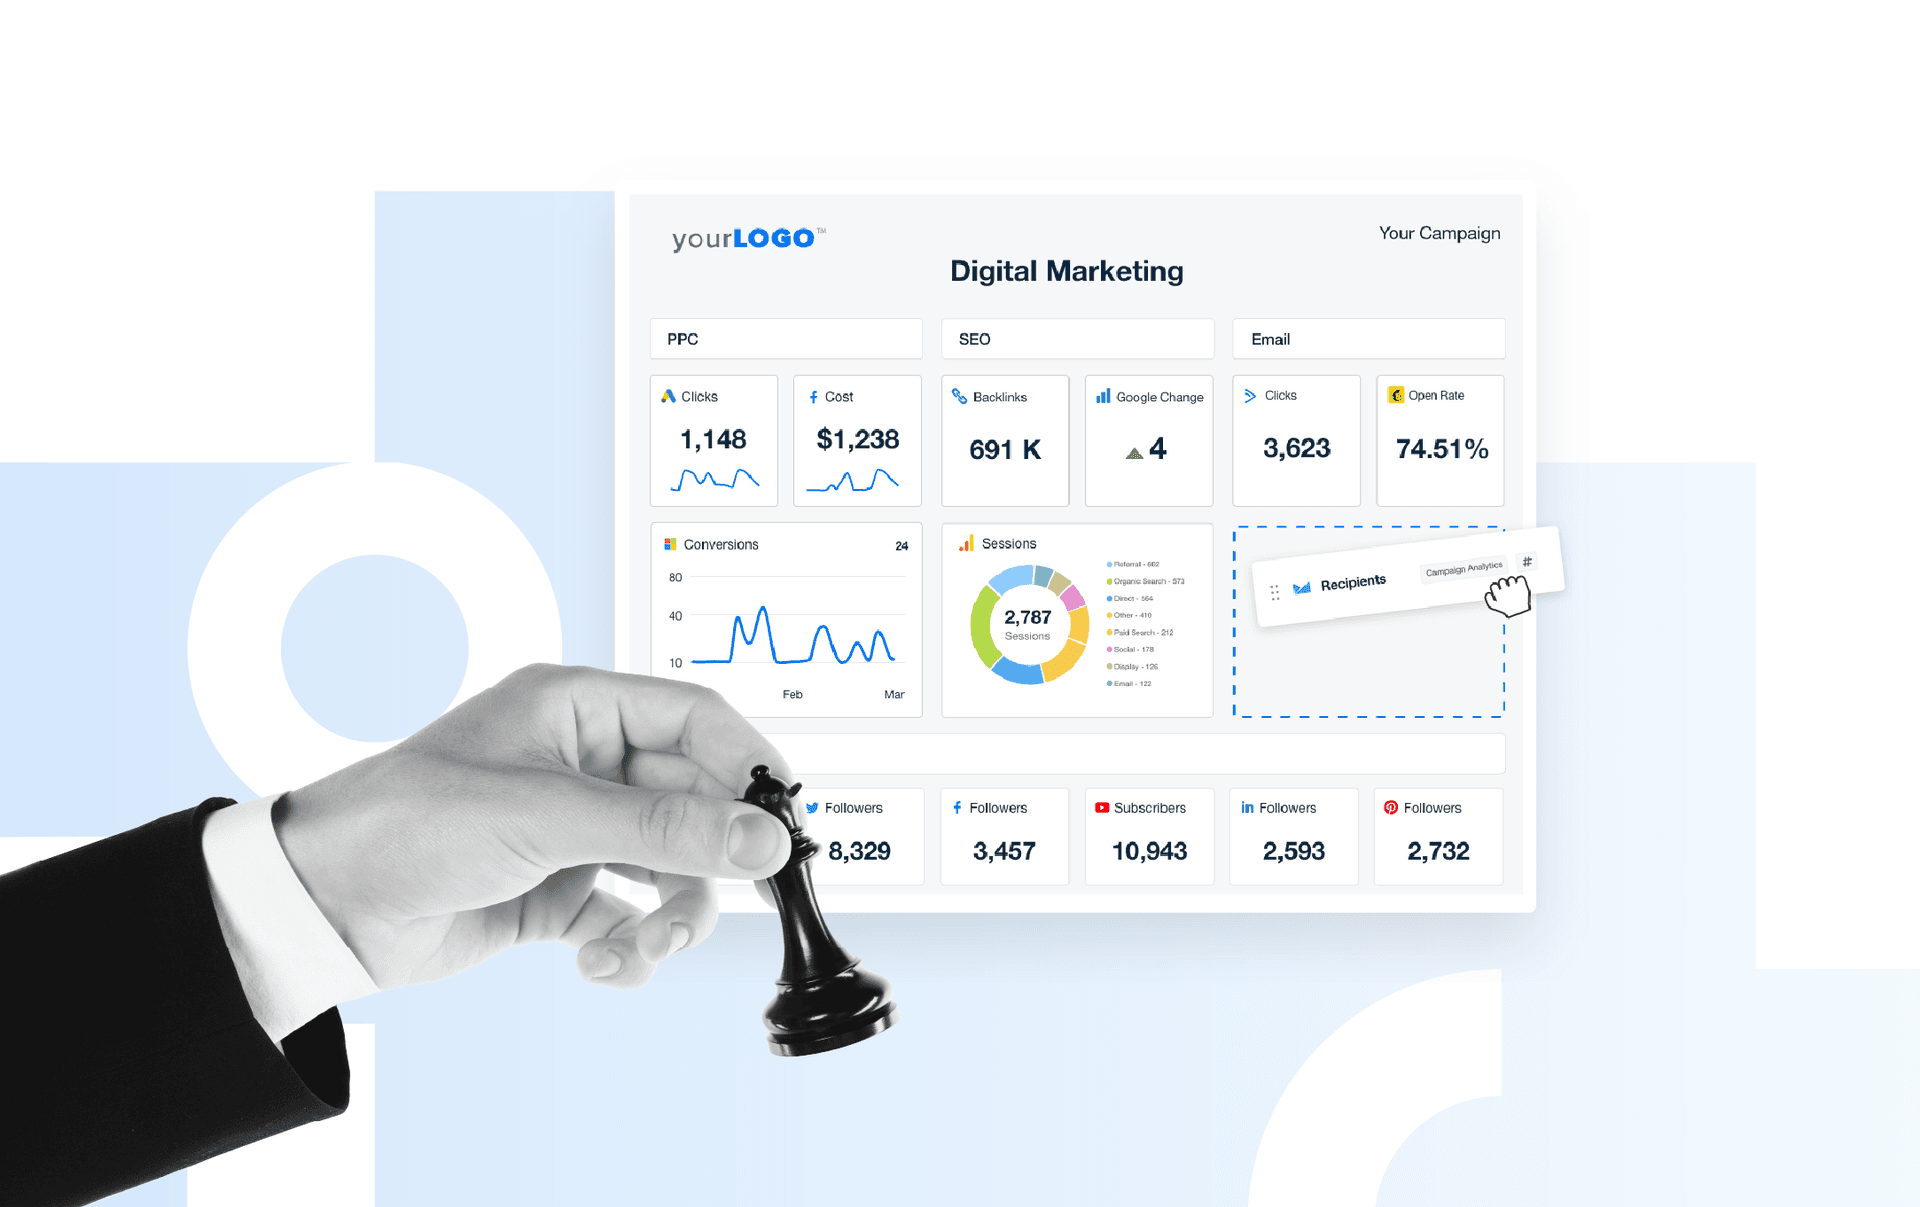
Aggregated performance metrics: Roll-up reports consolidate data across multiple clients, brands, or locations into a single customizable dashboard, giving you an instant, high-level view of agency-wide performance.
Side-by-side comparisons: Easily break out metrics to compare results across clients, campaigns, or data sources, helping you spot trends, gaps, and growth opportunities at a glance.
Smarter benchmarking: Track overall averages, identify top performers, and understand where to focus your efforts for maximum impact.
Consistent, accurate data: Keep naming conventions, time zones, and metrics standardized across all sources so your comparisons stay reliable and actionable.
In short, a roll-up report gives you the best of both worlds: the big-picture overview and the granular details you need to understand client performance at every level. Once you have that clarity, you can start to experience the real benefits of roll-up reporting.
Agency tip: When setting up roll-up reports, think carefully about how to build client marketing dashboards that align with each client’s goals. Group metrics by campaign, location, or channel, and focus on the KPIs that matter most. This makes your dashboards actionable, easy to read, and perfect for insights-driven marketing.
Benefits of roll-up reporting
Aggregating performance metrics across multiple clients, locations, or websites can be a total time-suck. Plus, manual roll-ups are prone to error and can quickly become outdated, failing to provide an accurate overview of your clients’ businesses.
Roll-up reporting solves these challenges, giving you one clear, accurate, and actionable view of agency-wide performance.
Here are some of the main benefits of roll-up reporting:
Seamless multi-client and multi-location reporting
Instantly combine time-based metrics, like impressions, CTR, and spend, across all clients, brands, or locations. No exports, no manual merging, just a single, reliable dashboard that consolidates all performance data in real time.
Agency tip: Use roll-up reports to show not just what happened, but why. Highlight key KPIs and trends across clients or campaigns so your clients understand what’s driving results.
Accurate, reliable data
Manual aggregation is prone to errors, and outdated data can mislead decision-making. Roll-up widgets pull directly from the original data sources, ensuring your reports are always accurate, up-to-date, and client-ready.
Agency tip: Along with managing data from a client’s website, it’s important to account for offline activity, especially when you're working with local businesses. With roll-up reporting, you can import offline events, like phone calls or in-store visits, alongside online metrics from all source properties. Track active users, average engagement time, and total revenue across multiple roll-up properties, and consolidate them into a single dashboard of global performance metrics.
Give your team back their time
Automating data aggregation means no more manual work; No more juggling links, rebuilding dashboards, or cleaning duplicates. Once set up, roll-up reports update automatically, saving your team hours each week while giving clients trusted insights.
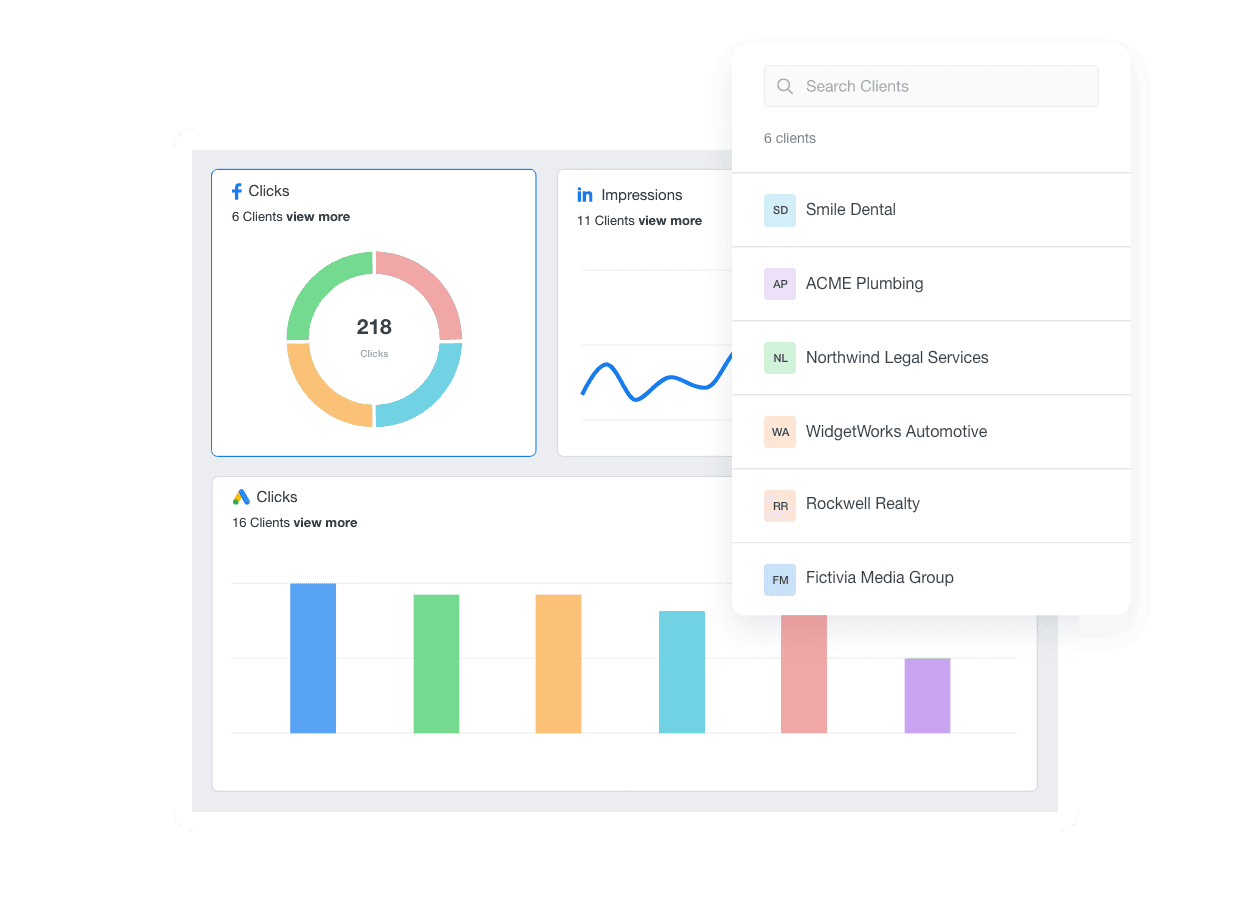
Unlock agency-wide insights and trends instantly–Try AgencyAnalytics free for 14 days.
Top roll-up reporting tools compared
Once you understand how roll-up reporting works, the next step is choosing the right tool to bring it to life. The best platforms make it easy to track performance across every client property and connect multiple data streams without compromising data integrity or security.
Whether you’re working in Google Analytics, a white label dashboard, or a dedicated analytics suite, each tool handles roll-up properties a little differently. Some make it simple to create roll-ups directly from the admin page or adjust custom dimensions for better cross-client data analysis. Others focus on automation, reducing the remaining effort needed to combine reports or update metrics.
In the next section, we’ll review the top roll-up reporting tools side by side, so you can see how they differ in configuration, reporting flexibility, and overall ease of use.
Google Analytics (GA4): Best for agencies using Google’s ecosystem to manage multiple brands or regions
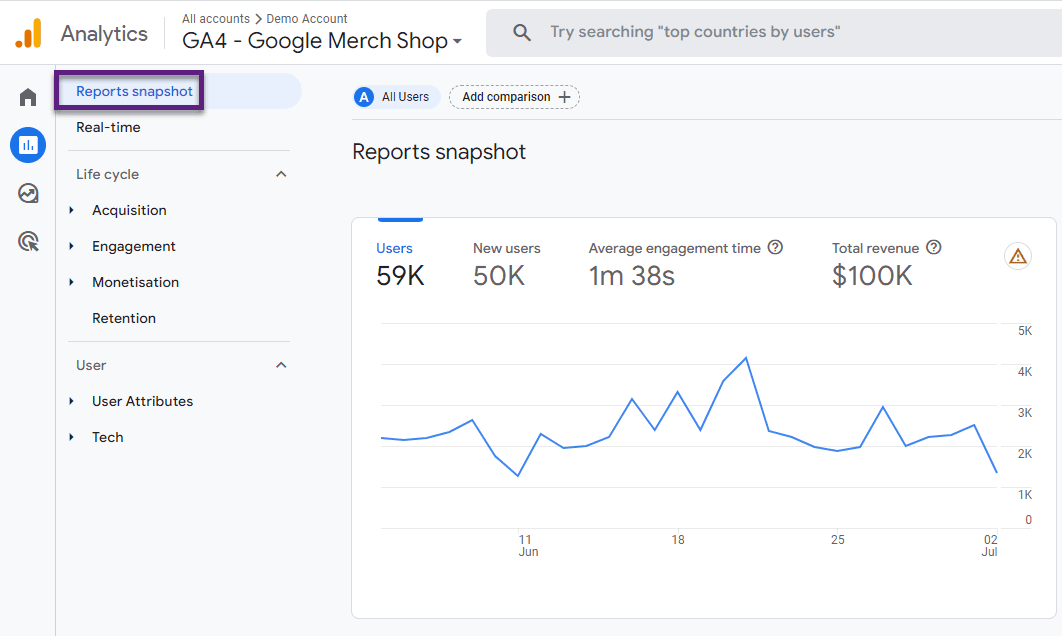
GA4's top features
Unified cross-brand analytics: Combine data from up to 200 source properties into one single site view for a complete picture of performance across clients, products, or regions.
Consistent Google Ads integration: Link roll-up properties to the same Google Ads accounts to view and export campaign data across all source properties using the most permissive configuration when multiple links exist.
User deduplication for cleaner insights: Automatically deduplicates users across properties when they share the same ID or Google account, giving you accurate session data and engagement metrics.
Independent configuration control: Adjust settings, custom dimensions, and audiences directly in the roll-up property without affecting source properties or their admin page configurations.
GA4 pricing
GA4 roll-up reporting requires a GA4 360 subscription, starting at $50K/year. Costs rise with usage, and roll-up property events are billed at half the rate of source property events.
Matomo: Best for agencies managing multiple websites, mobile apps, or online stores
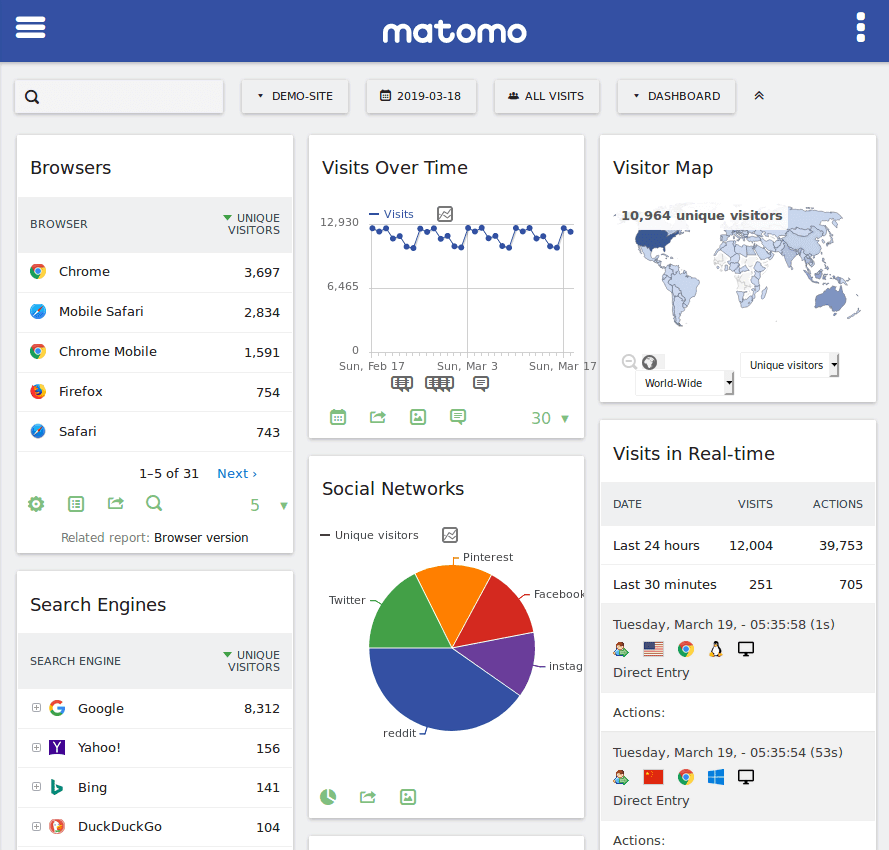
Matomo's top features
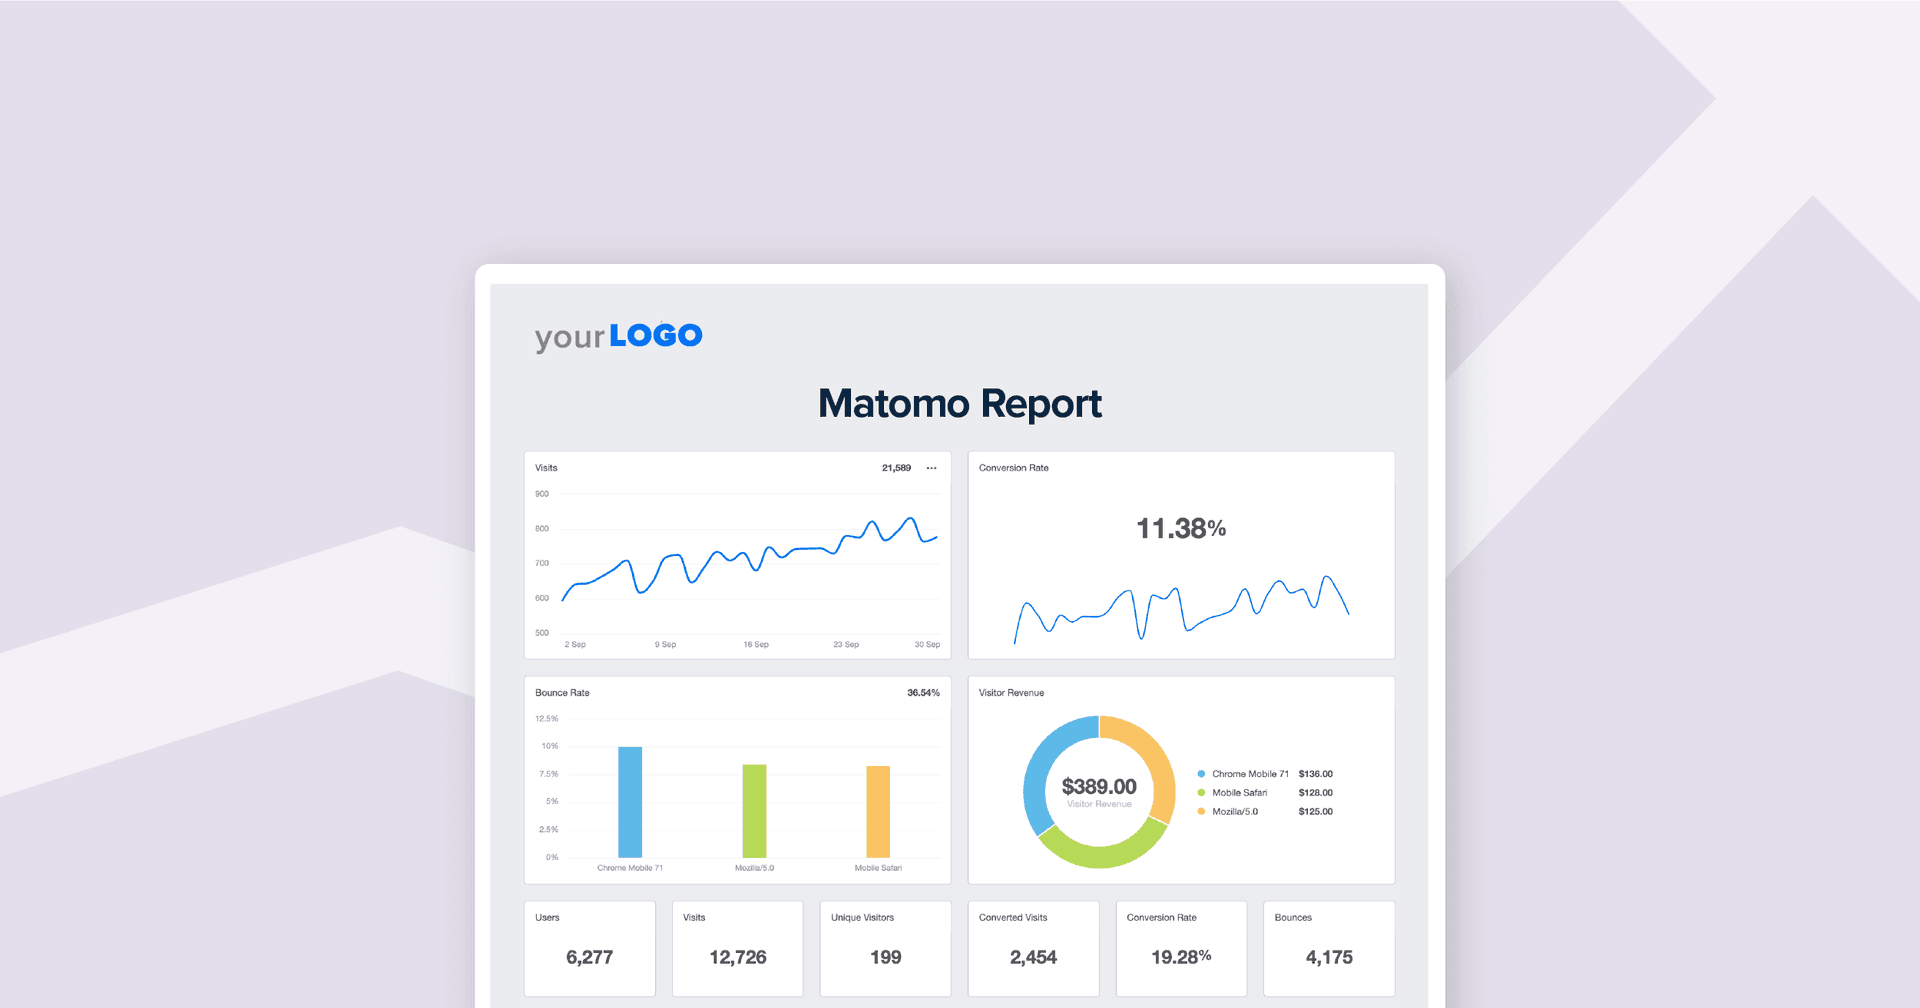
Real-time reporting: Access real-time data across all your connected properties, to quickly understand user behavior and how your client’s sites are performing.
Visitor segmentation: Matomo's segmentation features let you analyze specific visitor groups across different properties for better targeted marketing.
Custom dimensions and metrics: Set up and track custom dimensions and metrics within roll-ups, giving you a more detailed view of your data.
API access and integration: Pull roll-up data through Matomo’s HTTP Reporting API, making it easy to connect with other tools and get a complete view for smarter data analysis.
Matomo pricing
Matomo is a free, open-source analytics platform (cloud hosting from $19/month). Roll-Up Reporting is an optional plugin, sold as an annual subscription.
BrightLocal: Best for a consolidated view of keyword rankings and performance metrics
BrightLocal’s top features
Keyword grouping: Group your keywords by theme, service, or product to make analysis and performance tracking easier and more targeted.
Location-level insights: Keep an eye on keyword rankings at the individual location level and quickly spot high performance as well as areas for improvement.
Historical ranking tracking: Check historical ranking data to spot trends, improvements, or declines over time and make smarter strategic decisions.
Search engine breakdown: See how keywords perform on each search engine, giving you clear insights into platform-specific visibility.
BrightLocal pricing
Starts at $29/month.
TapClicks: Best for agencies with the time and resources to manage complex integrations.

TapClicks’s top features
Customizable dashboards and widgets: Build custom dashboards with widgets that show key metrics–like ad spend, clicks, and conversions–so each client or campaign gets personalized reporting.
Automated reporting and alerts: Set alerts for key metrics so you can respond quickly to changes in client performance.
Advanced data calculations: Set up custom metrics–like total engagement or cost per acquisition–and use them across multiple campaigns or clients to keep your reporting consistent.
Scalable template-based reporting: Use template-based reporting to easily manage and update dashboards for all your clients, keeping everything consistent and scalable.
TapClicks pricing
Starts at $99/month.
AgencyAnalytics: Best for agencies that need customizable, real-time performance insights without manual data handling
AgencyAnalytics’ top features
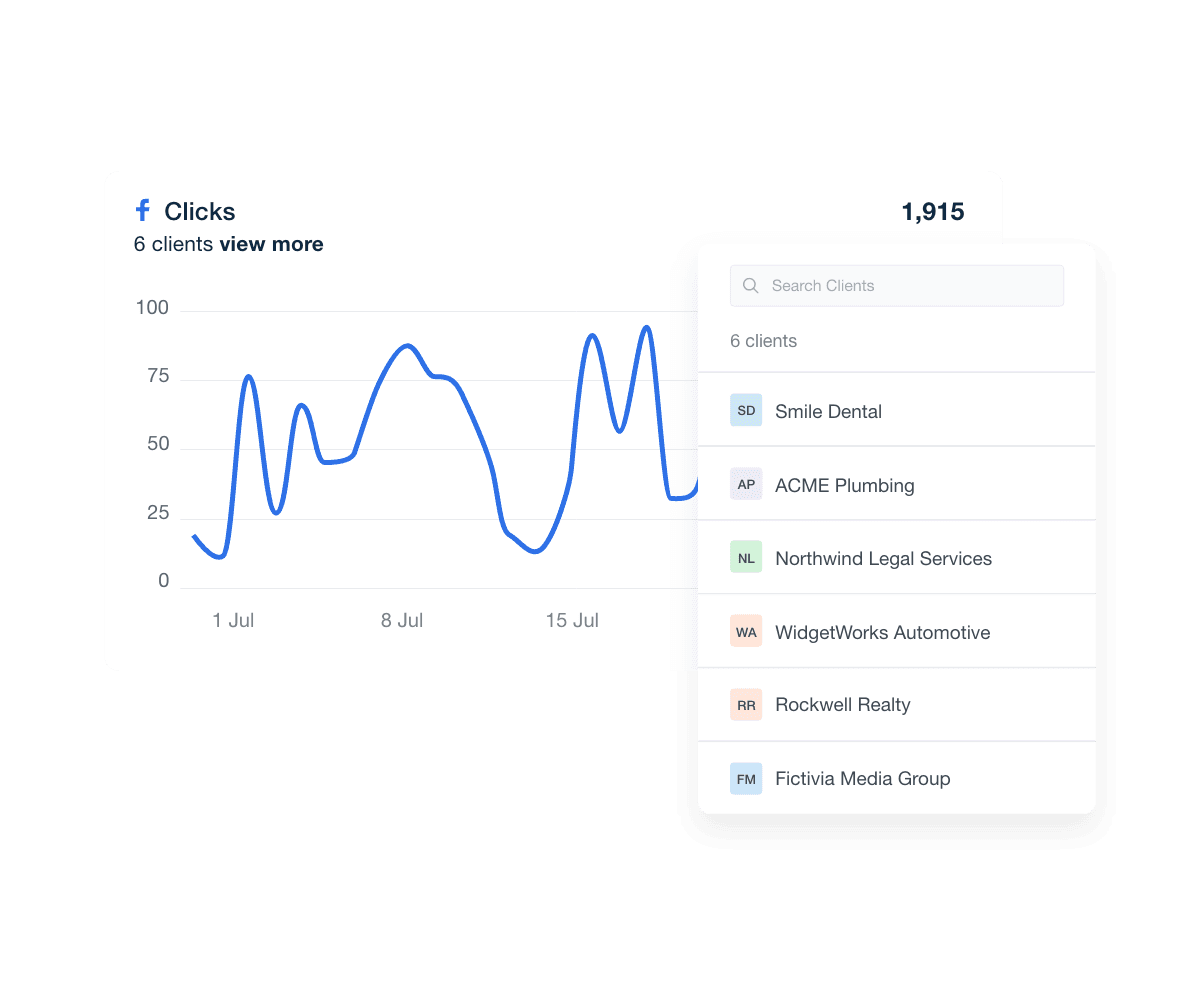
Centralized roll-up monitoring: Roll-up reporting and dashboard functionality provides a unified, real-time view of key metrics like ad spend, clicks, and conversions across all clients, enabling agencies to quickly identify top performers and areas needing attention.
Customizable roll-up dashboards: Create tailored dashboards that aggregate data from multiple clients, brands, or locations, and compare side-by-side to identify trends.
Advanced benchmarking and trend analysis: Track performance trends across regions, business types, or industries, allowing agencies to benchmark results and make data-driven strategic decisions.
White label reporting: Deliver branded reports and dashboards with agency logos and color schemes, enhancing professionalism and client trust.
Real-time data aggregation: Eliminate manual reporting by automatically aggregating time-based metrics across multiple clients, ensuring up-to-date insights are always available. With AgencyAnalytics, set dashboards to inherit users from multiple clients, so your team sees all relevant data without manually adding each user.
AgencyAnalytics pricing
Pricing begins at $59 per month.
AgencyAnalytics helps us look our best. It delivers beautiful reports that are easy for our clients to understand and makes us look professional. It is easy to use and is customizable for multiple clients and use cases. The wide range of integrations means it gives us the flexibility to deliver on all our clients needs. I highly recommend AgencyAnalytics to other digital marketing agencies.
Russell Brown, Director, Digital Stream
Best roll-up reporting tools: Summary
Tool Name | Best For | Cons | Pricing |
|---|---|---|---|
Google Analytics (GA4) | Agencies using Google’s ecosystem to manage multiple brands or regions. | Requires GA4 360 subscription; expensive; roll-up reporting only available with 360. | GA4 360 subscription starts at $50K/year; roll-up property events billed at half the source property rate. |
Matomo | Agencies managing multiple websites, mobile apps, or online stores, seeking a unified analytics view without relying on Google Analytics. | Roll-up reporting requires a paid plugin; cloud hosting costs extra. | Free open-source platform; cloud hosting from $19/month; roll-up plugin sold annually. |
BrightLocal | Managing multiple local SEO campaigns across various locations, seeking a consolidated view of keyword rankings and performance metrics. | Limited to local SEO; not ideal for multi-channel or enterprise reporting. | Pricing starts at $29/month (varies by plan and features). |
TapClicks | Agencies with the time and resources to manage complex integrations and coordinate multi-channel marketing campaigns.
| Complex setup makes it difficult to onboard.
| Starts at $99/month. |
AgencyAnalytics | Growing agencies that need to hit the ground running with customizable, real-time performance insights, minus the manual data handling.
| Built for agencies; may be less ideal for single-site tracking.
| Starts at $59/month. |
Impress clients and save hours with custom, automated reporting.
Join 7,000+ agencies that create reports in under 30 minutes per client using AgencyAnalytics. Get started for free. No credit card required.
Already have an account?
Log inHow to choose the right roll-up reporting tool
When selecting a roll-up reporting tool, don’t get distracted by fancy dashboards and capabilities you’ll never use. Instead, focus on how well it helps you mine for applicable data and meaningful insights, which translates to faster decision-making for every client.
Here are some things to keep in mind when making your choice:
Data integrity and configuration flexibility: Make sure the tool you choose can handle different configurations without breaking roll-up data. With AgencyAnalytics, you can create custom metrics dashboards and review or adjust them through a centralized admin page. Adjusting metrics and settings in either the sub-property or the main roll-up property won't affect the others, so you have full control over your analytics.
Reports vs analytics: Look for a platform that doesn’t just compile numbers but provides actionable analytics. You want to understand trends, session data, and overall performance, not just see tables of totals. AgencyAnalytics excels here with real-time roll-ups that make raw data easy to visualize and analyze.
Enterprise-level SEO and multi-client analytics: If your agency handles multiple brands or locations, you need analytics for enterprise SEO. Your reporting platform should let you compare performance across clients and spot outliers in one report without juggling multiple spreadsheets.
Scalability and ease of use: The tool should let you delete data streams or adjust metrics as needed, maintain historical data by date, and support multiple reporting views, such as by client, campaign, or location. This way, you can respond to client needs quickly and scale reporting as your portfolio grows.
Visualization and insights delivery: Finally, consider how easily the platform lets you review and share insights. AgencyAnalytics’ roll-up metrics dashboards make it simple to highlight key performance indicators, enabling your team to deliver insights-driven marketing that clients can act on.
Unlock more relevant analytics with roll-up reporting
With AgencyAnalytics, you can instantly aggregate metrics from clients, brands, or locations into a single shareable dashboard. Roll-Up Reporting eliminates the need for manual spreadsheets, giving you accurate, real-time data pulled directly from over 80 native integrations, including Google Analytics, Google Ads, Facebook, LinkedIn, and Search Console.
Smarter benchmarking is a breeze with software that lets you track trends across regions, industries, or business types to guide strategic decisions. With side-by-side views, you can compare clients or locations to uncover performance gaps and opportunities.
Create agency-wide reports that reveal your overall performance at a glance, or hone in on specific accounts for granular insight. Drag-and-drop editing makes it easy to customize visuals, highlight key metrics, and deliver polished, client-ready reports that you can be proud of.
Try AgencyAnalytics free for 14 days and see how roll-up reporting will revolutionize your agency.

Written by
Anya Leibovitch is a B2B SaaS content marketing specialist. She partners with tech companies to design and execute their content marketing strategy. A writer first and foremost, she harnesses the power of storytelling to build and strengthen relationships between companies and the clients they serve.
Read more posts by Anya LeibovitchSee how 7,000+ marketing agencies help clients win
Free 14-day trial. No credit card required.


