Table of Contents
Table of Contents
- Why Good Data Visualization Matters in Marketing Reports
- Core Principles Behind Effective Data Visualization
- 12 Best Data Visualization Examples
- Bad Data Visualization Examples (and What to Avoid)
- How To Use Creative Data Visualization In Client Reports
- Why AgencyAnalytics Is Built for Better Data Visualization
7,000+ agencies have ditched manual reports. You can too.
Free 14-Day TrialQUICK SUMMARY:
Explore cool data visualization examples that help turn raw marketing data into clear, actionable insights. Strong visuals simplify complex information, highlight performance trends, and help clients (and agencies) act faster. This article showcases 12 interesting data visualization examples that make client reports user-friendly, faster, and more valuable.
A good report shares the numbers. A great one turns them into a story clients can understand.
Without strong visuals, even the strongest campaign results risk getting lost in disconnected metrics. Clear, focused data visualization helps clients celebrate wins, spot gaps, and confidently make decisions. Whether it's tracking growth over time, comparing campaign results, or highlighting regional performance, the right visual choices turn routine updates into must-read reports.
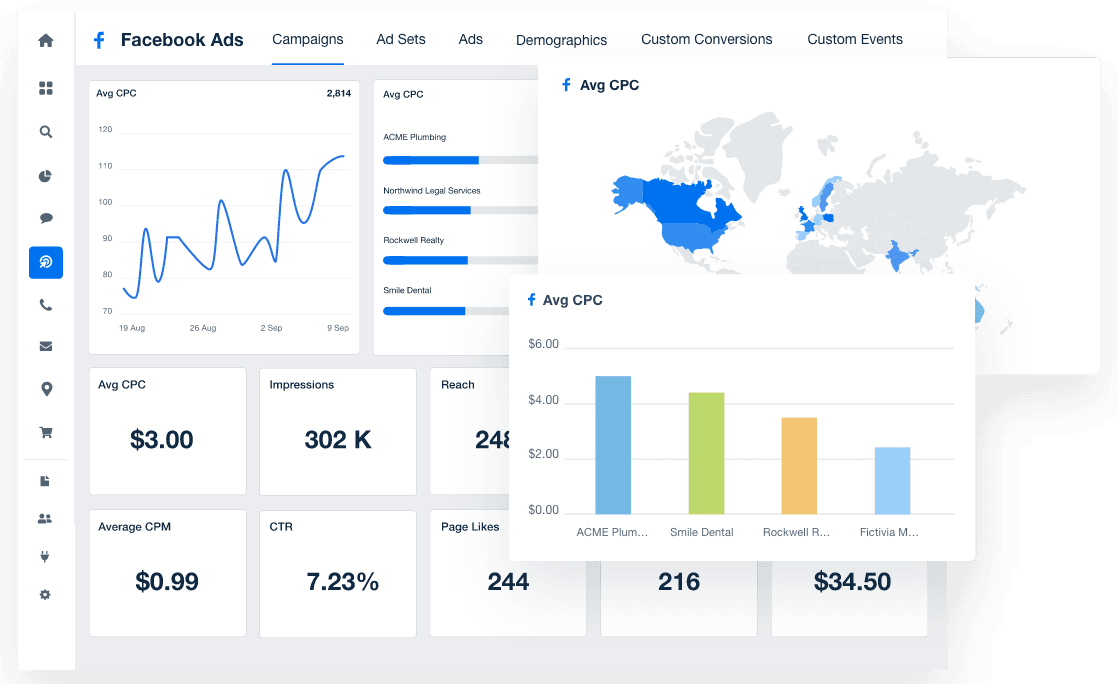
In this article, discover 12 of the best examples of marketing-focused data visualization along with some tips for building reports that clients will see as an added value to your services.
If your reports feel too heavy on raw numbers, these examples will help sharpen them into clearer, faster, and more powerful updates.
Why Good Data Visualization Matters in Marketing Reports
Rows upon rows of raw numbers leave too much room for misinterpretation and slow down decision-making.
Good data visualization bridges that gap, providing accessible insights that lead to faster approvals, smarter budget shifts, and stronger campaign strategies.
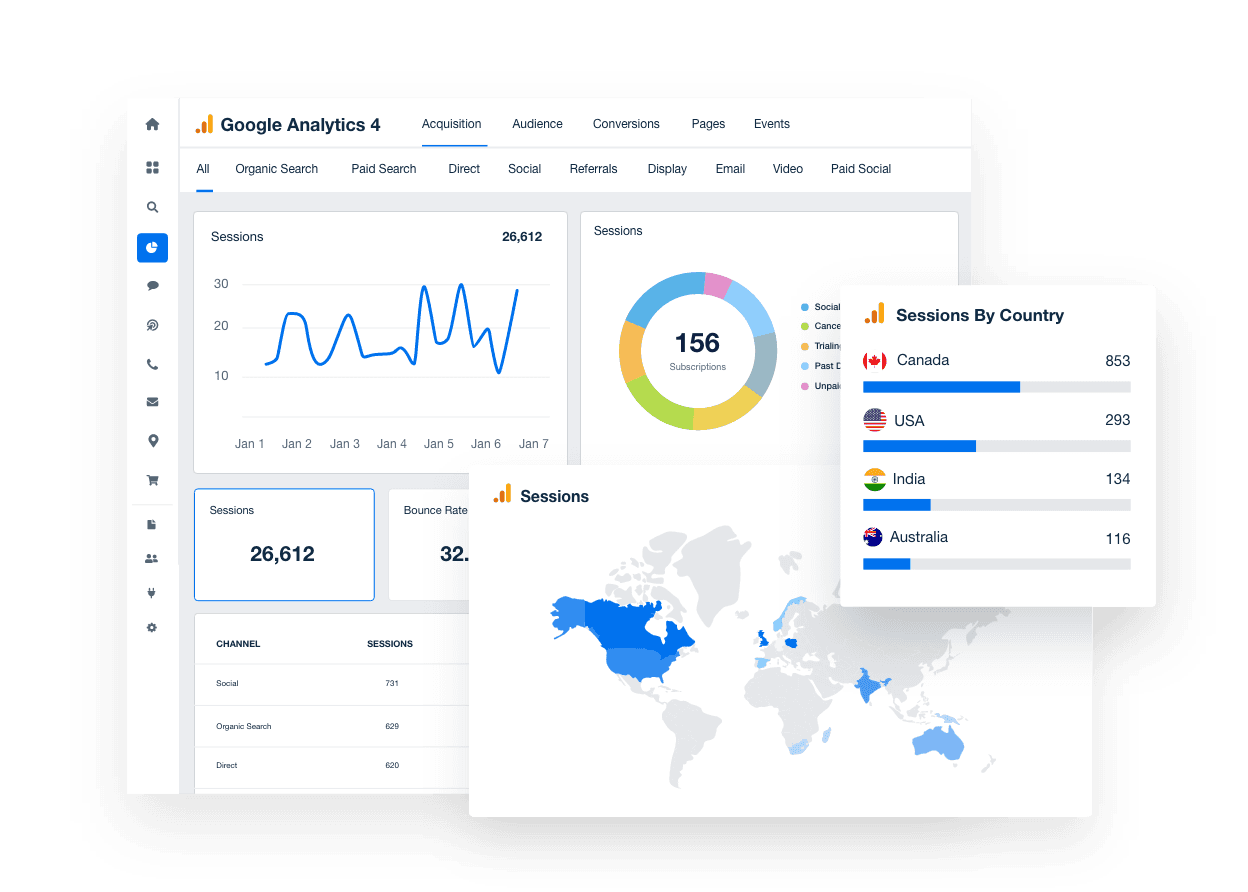
Data visualization makes it easy for clients to see where campaigns are succeeding and where adjustments are needed without relying on a deep dive into spreadsheets. Try AgencyAnalytics free for 14 days.
Effective data visualization focuses on key outcomes, uses the right chart type for the story being told, and stays visually consistent throughout the report.
The best reports don’t just look good—they build trust, prove value, and strengthen your position as a strategic partner.
Every choice, from the format to the overall report color scheme, should make it easier for clients to see what’s working and what needs attention and reinforce that they made the right decision when hiring your marketing agency.
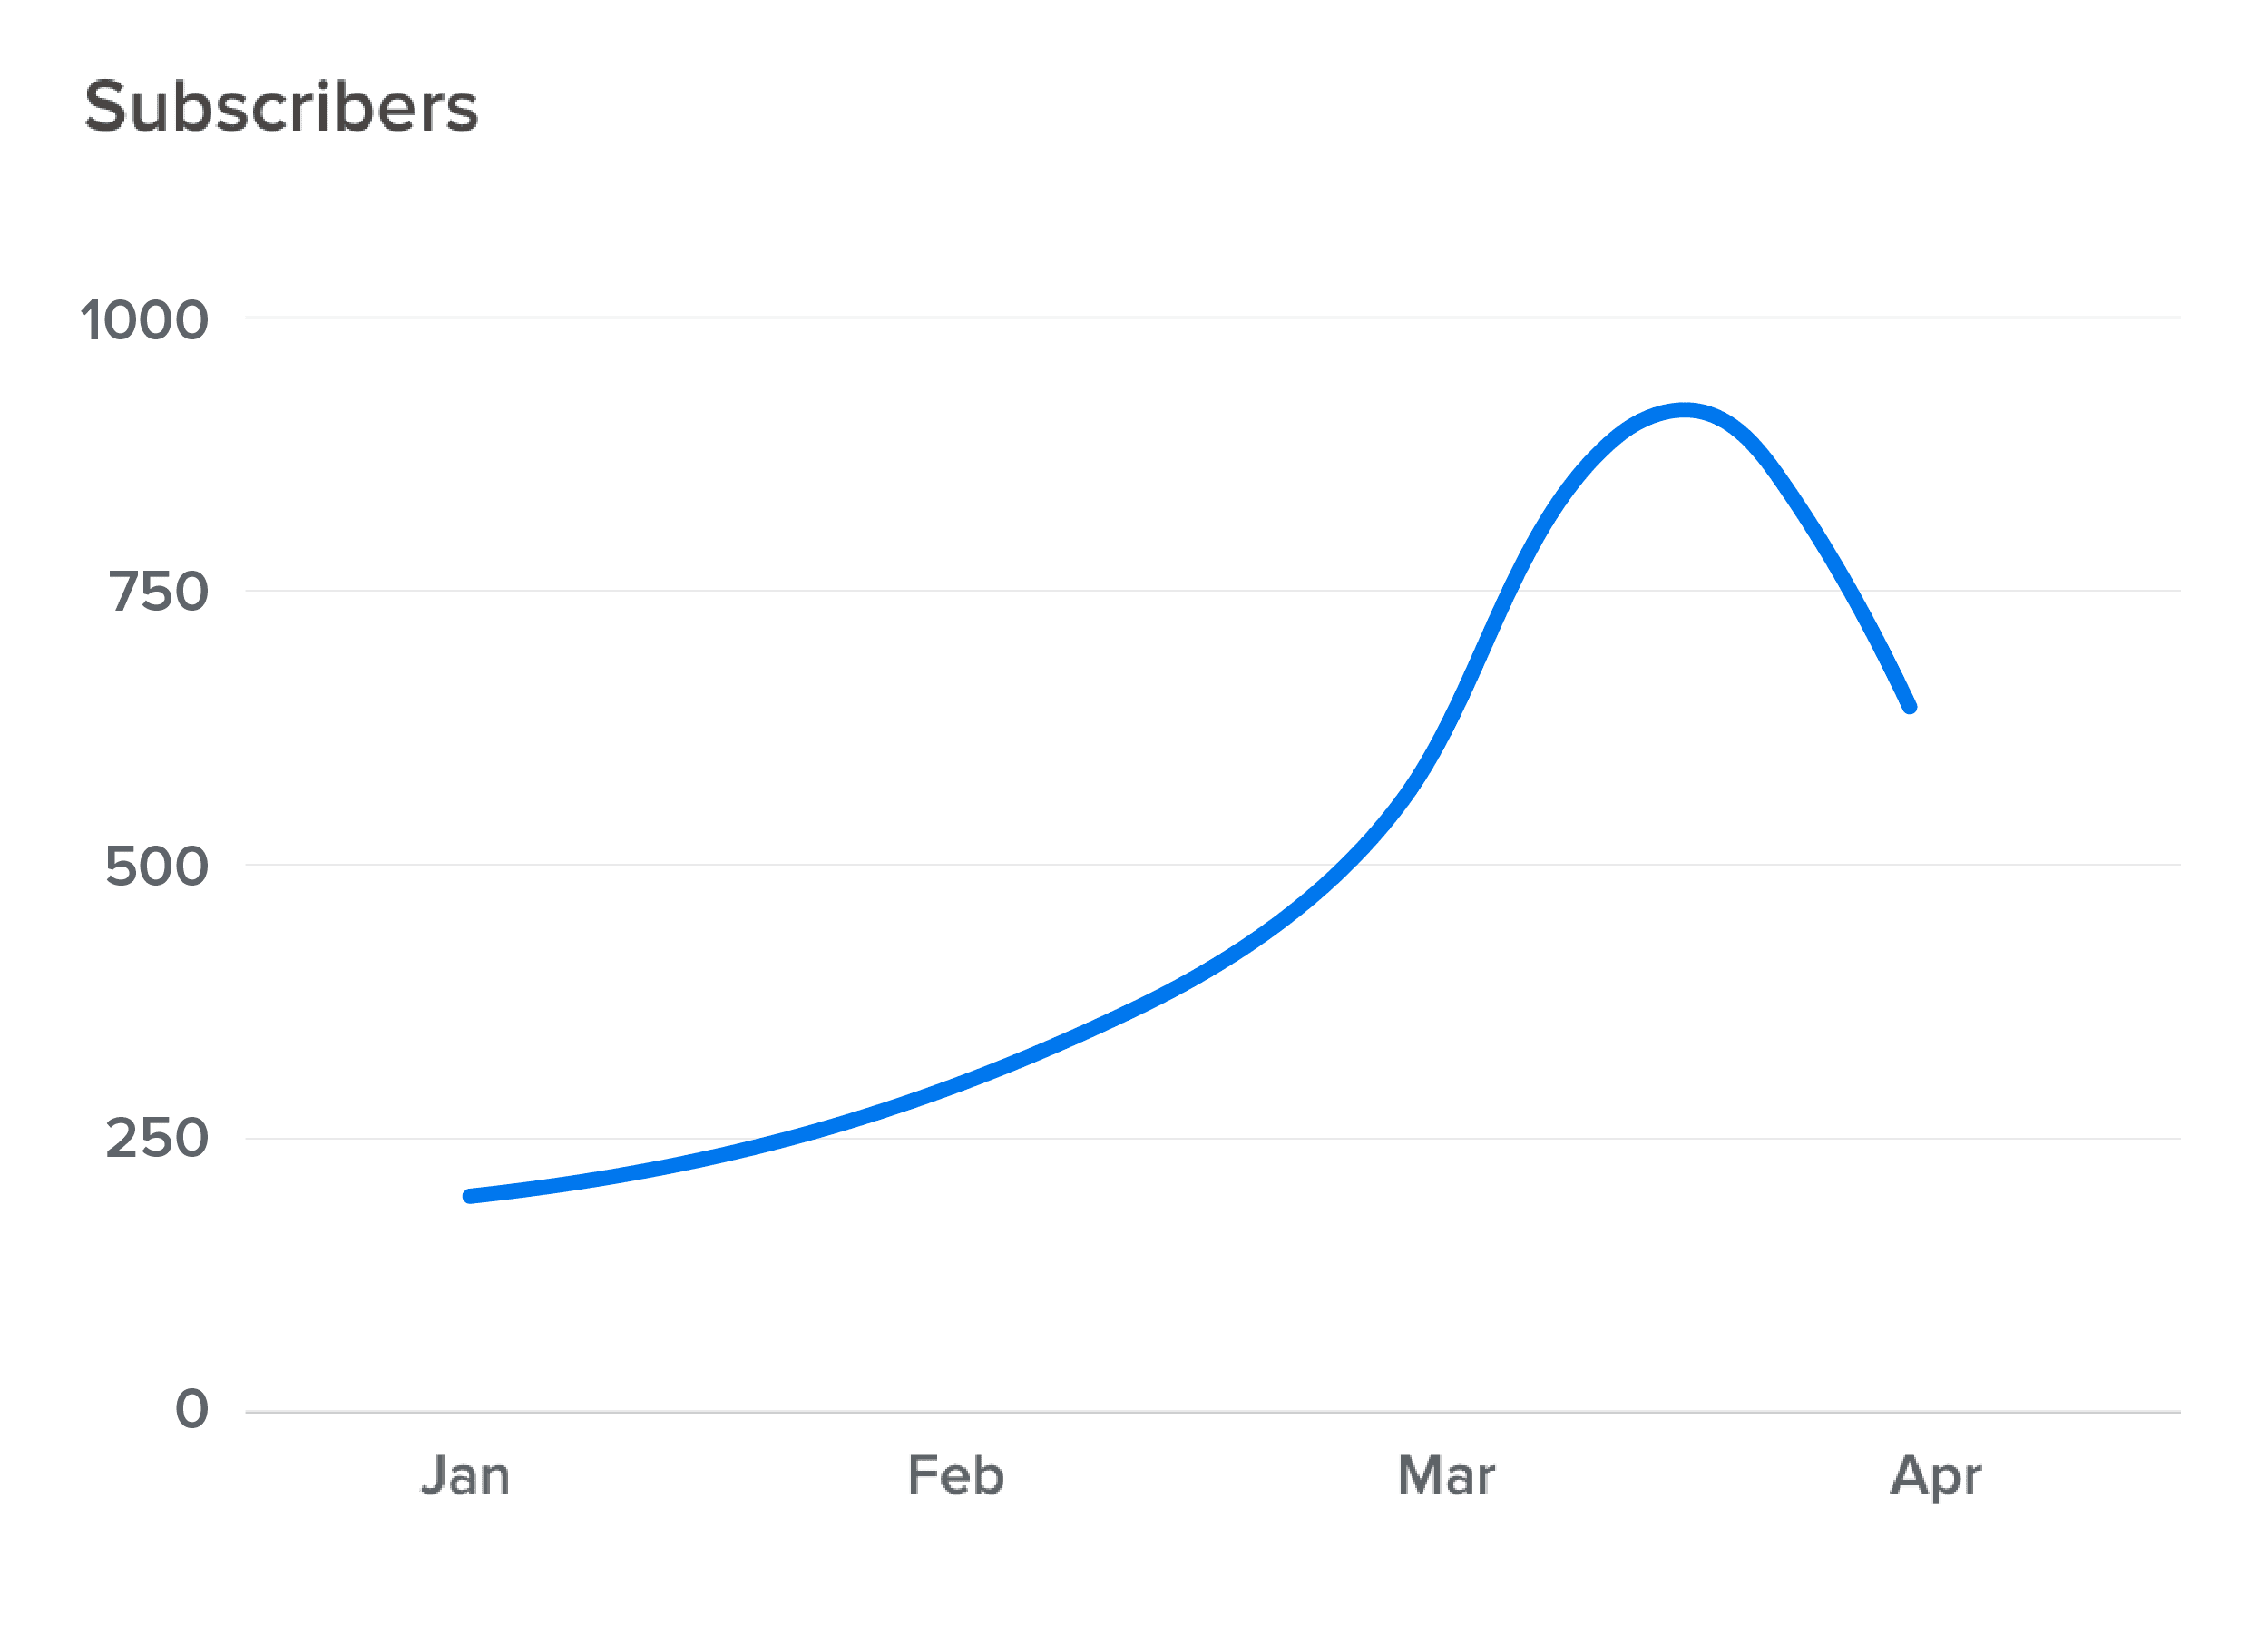
Data visualization methods add context and emotion to performance updates, making reports more memorable.
The best data visualization techniques focus on making insights easy to understand and act on. Strong reporting relies on choosing the right data visualization tools, applying creative visualization strategies, and keeping the visual experience simple.
Core Principles Behind Effective Data Visualization
Effective data visualization relies on a few simple principles: focus on the right outcomes, choose the best visual format for the story, and maintain a consistent, easy-to-follow design. Done right, reports become faster to build, easier to understand, and more aligned with client goals.
Principle #1: Favor Simplicity and Focus on Key Outcomes
Clarity always wins over complexity. Effective visual analytics help avoid overloading reports with unnecessary details. Instead, they highlight what matters most, like campaign performance, ROI, or audience engagement. Using data visualization tools designed for marketing reports streamlines visuals and keeps the focus on essential outcomes.
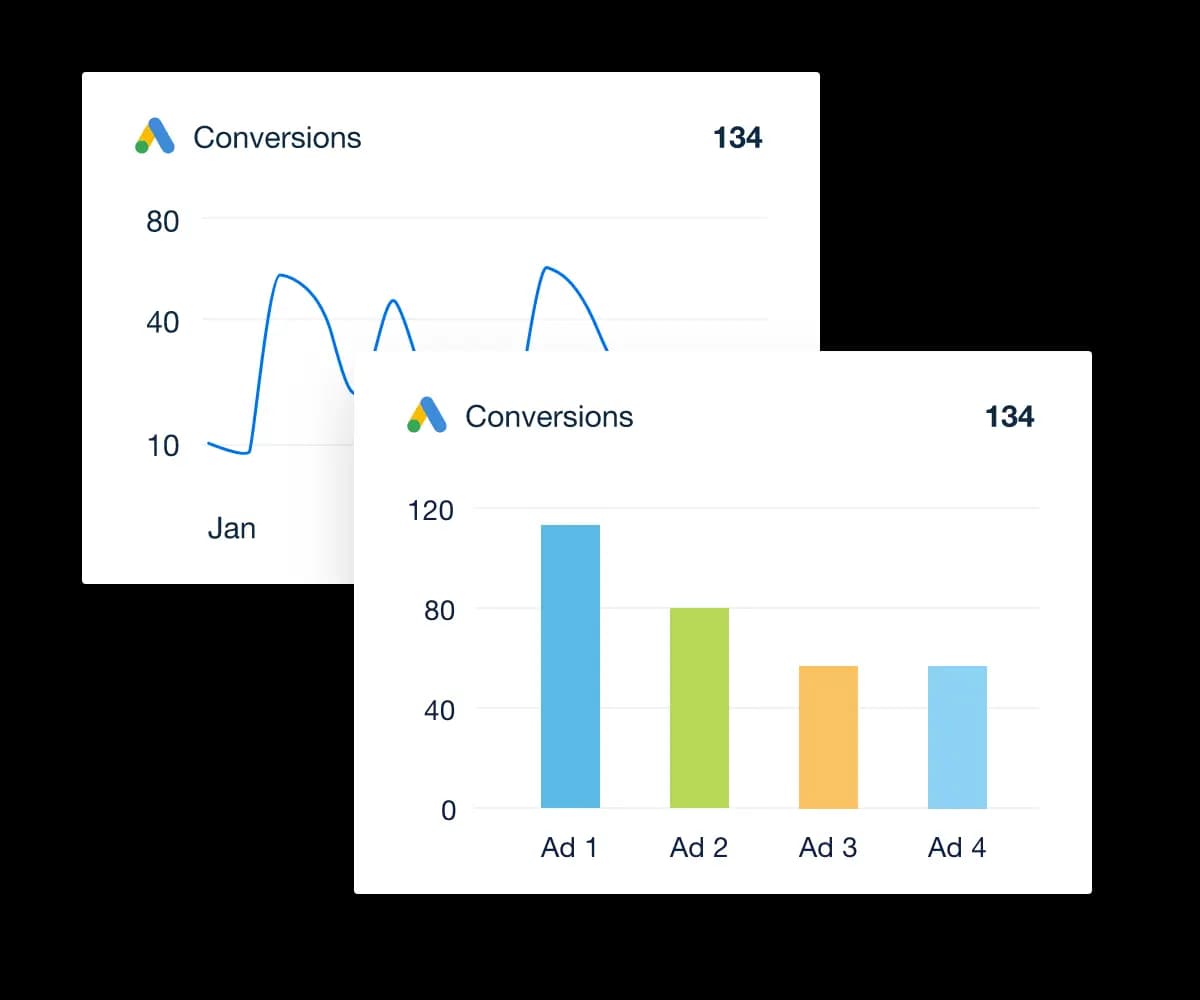
For example, line charts are great for tracking growth over time, bar charts are ideal for comparing campaign results, map charts bring regional performance to life, and funnel charts explain customer journeys. When matched correctly, visuals bring structure to performance updates.
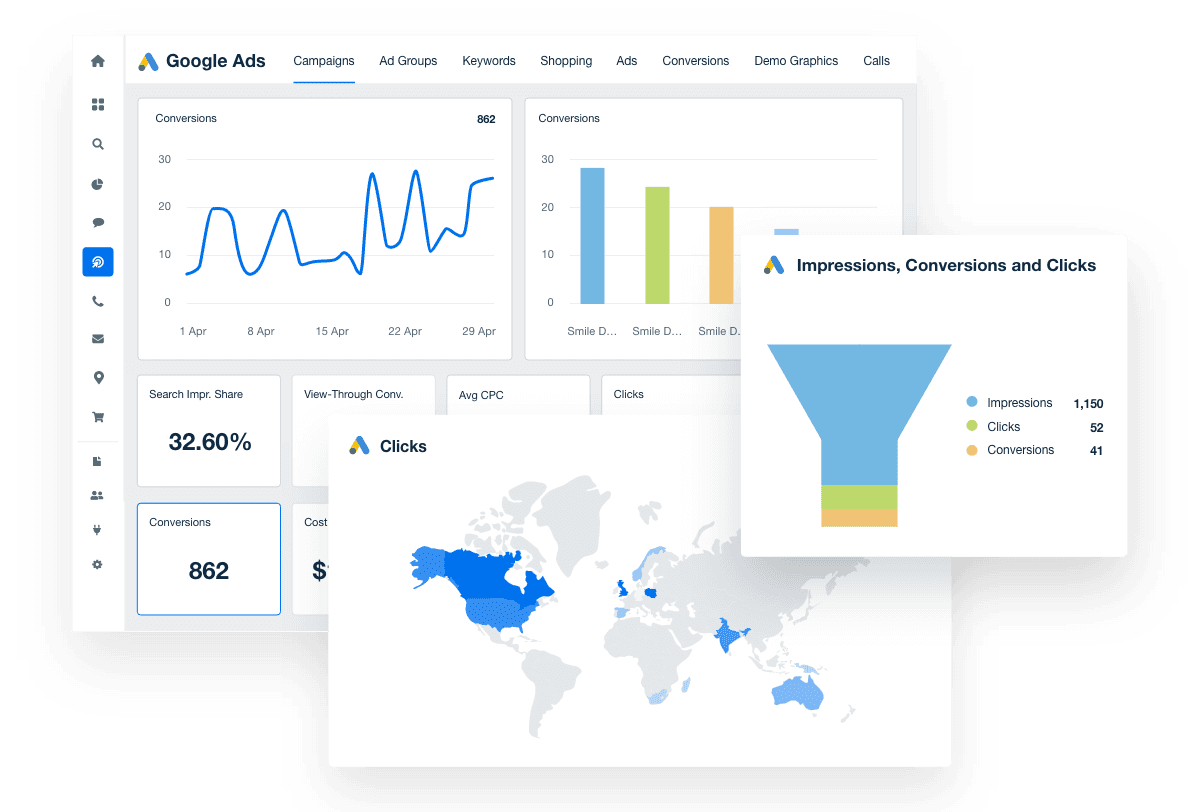
Quality data visualization software makes it easy to pull from multiple data sources and build the best chart for the story—access built-in data visualization widgets with AgencyAnalytics. Get started with a 14-day free trial.
Principle #2: Standardize Visuals To Streamline Reporting Across Clients
Standardized visual practices—like consistent chart types, color schemes, and formatting—save time, reduce errors, and make reports easier to build, review, and send to clients. When every account manager and analyst works from the same playbook, client reports become a strategic asset instead of an administrative chore.
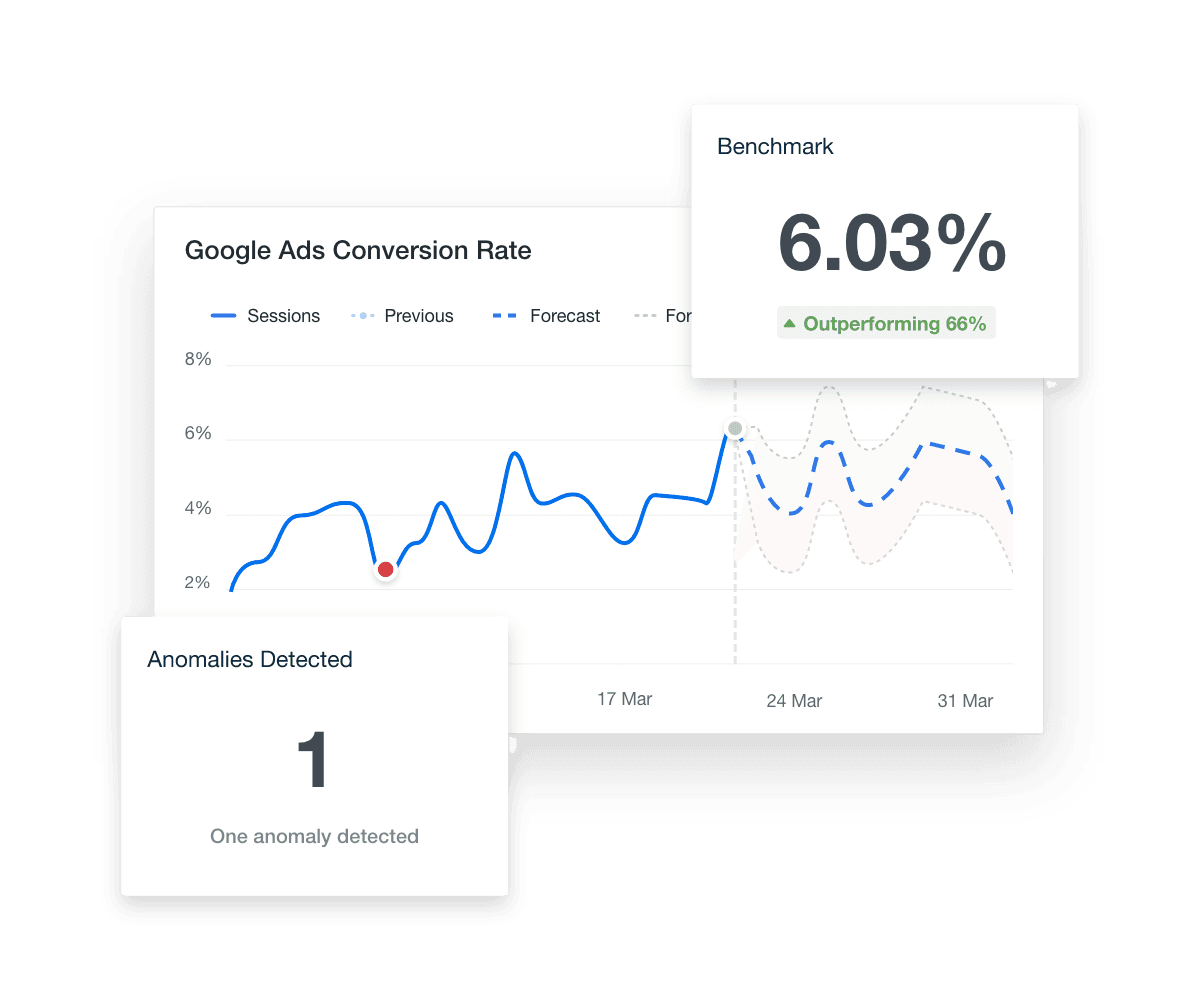
Standardization also makes onboarding new clients and team members easier, maintaining brand consistency, and scaling client reporting as the agency grows. Instead of reinventing the wheel for each client, teams focus on insights and strategy, while reports stay professional and easy to share.
Principle #3: Visual Consistency for Clearer Understanding
Inconsistent formatting makes even good insights harder to follow. Using consistent colors, scales, and styles across a report speeds up client understanding. The right data visualization tools support template-driven reports that maintain a professional look without extra effort. After all, creative visualization shouldn’t come at the cost of clarity.
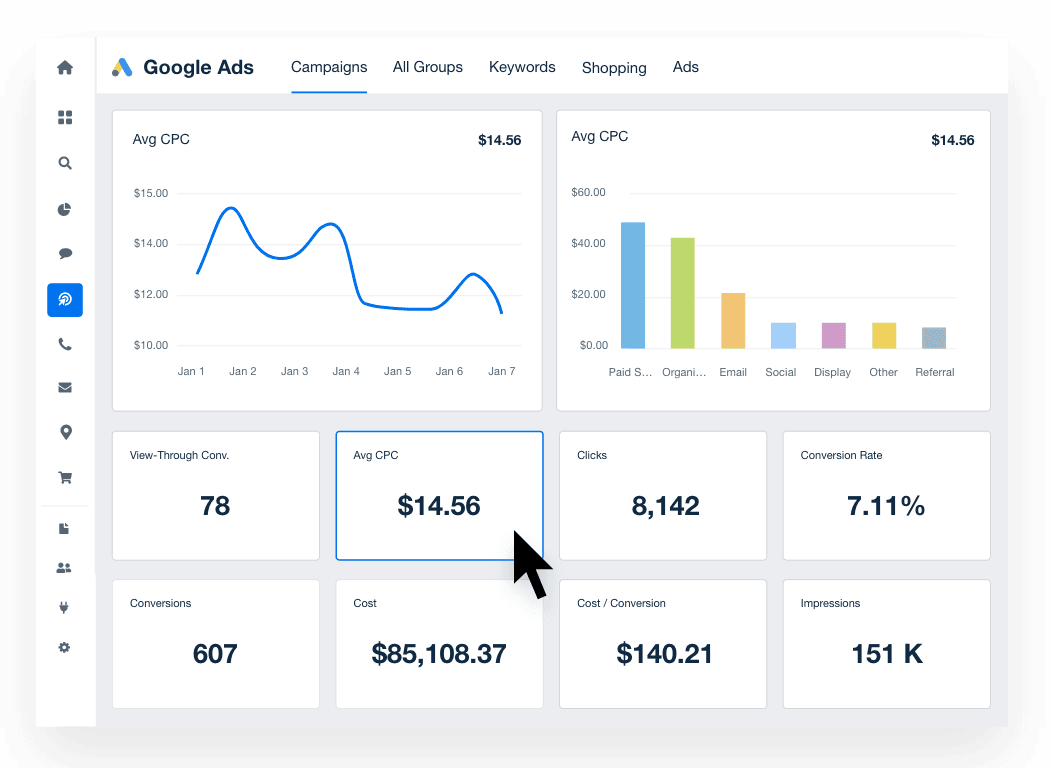
Whether using a sparkline, an interactive chart, or a bar chart, keeping the visual language unified makes reports easier to navigate and builds stronger client relationships.
12 Best Data Visualization Examples
Great data visualization isn't just cramming information into a chart—it’s about making the right insight impossible to miss.
The best examples stay simple, highlight what matters, and help clients see the bigger picture without getting lost in the details. Here are 12 data visualization examples that turn raw performance data into clear, client-ready insights.
Example 1: Bar Charts
A bar chart is one of the most intuitive ways to compare performance across campaigns or periods. Each bar’s height or length clearly represents the value, making it easy to spot differences between regions, age groups, or tactics.
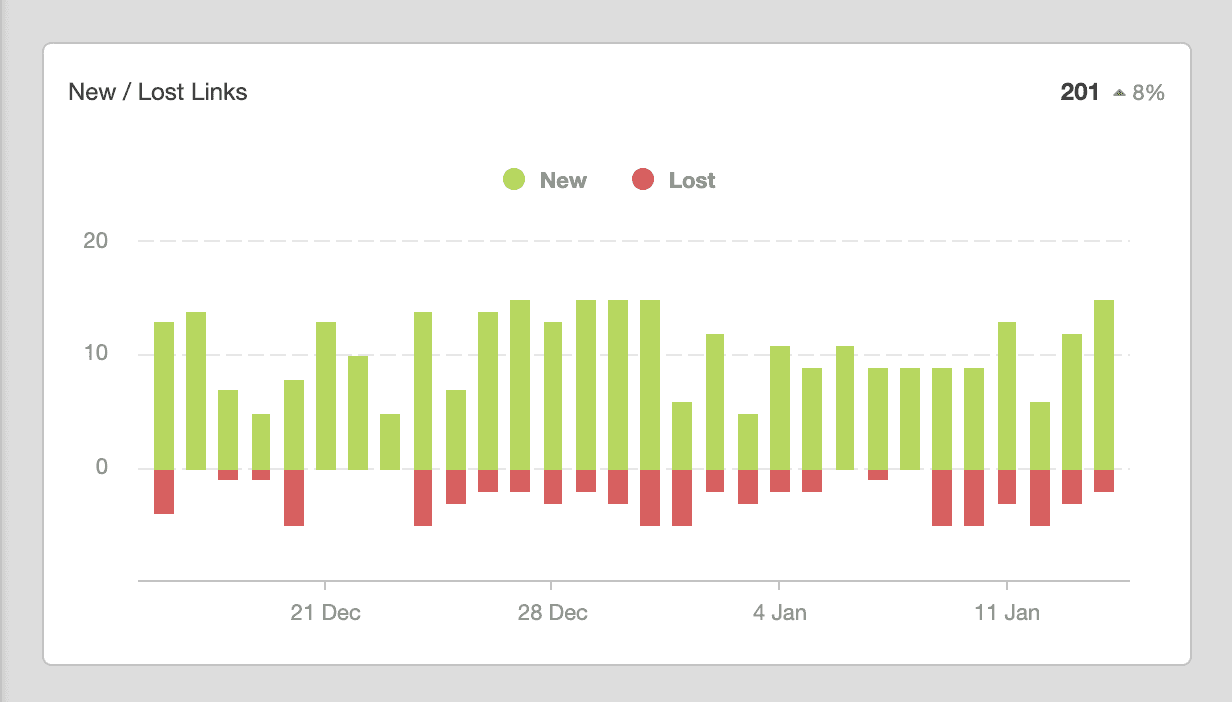
This type of chart shows the total number of actions or results side-by-side for fast comparison.
Example 2: Line Graphs
A line graph is ideal for showing how performance evolves over time. As each line represents a different dataset, it becomes easier to identify peaks, trends, and gaps across campaigns.
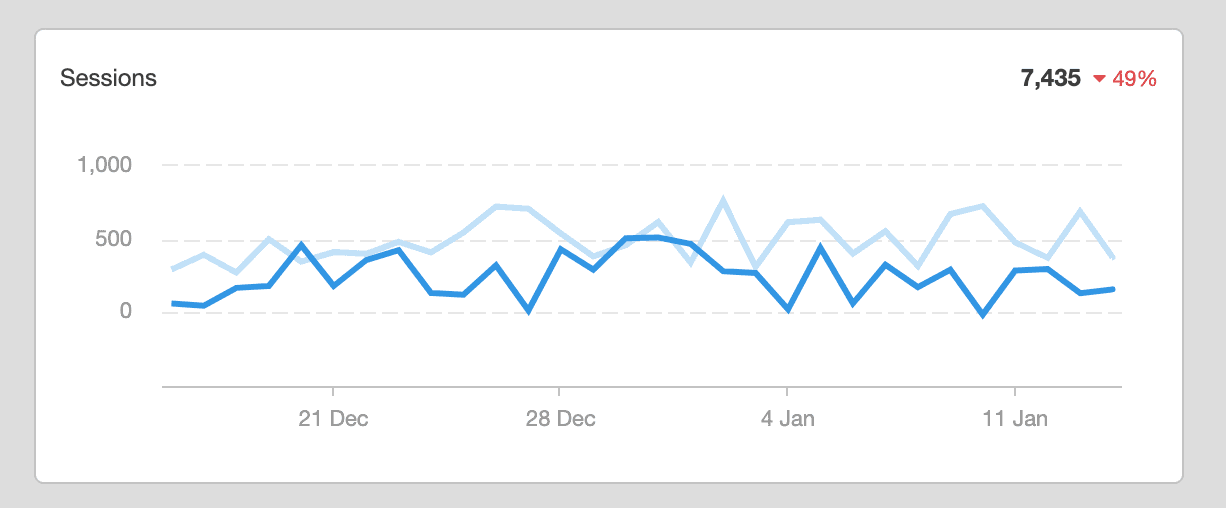
This chart shows patterns across different time periods, helping marketers conduct historical performance research, track growth, identify declines, or pinpoint seasonal changes with minimal explanation needed.
Example 3: Pie Charts
Pie charts are effective for breaking down simple proportions, such as the percentage of leads generated by each marketing channel. A simplified pie chart shows a clear snapshot without overwhelming the reader.
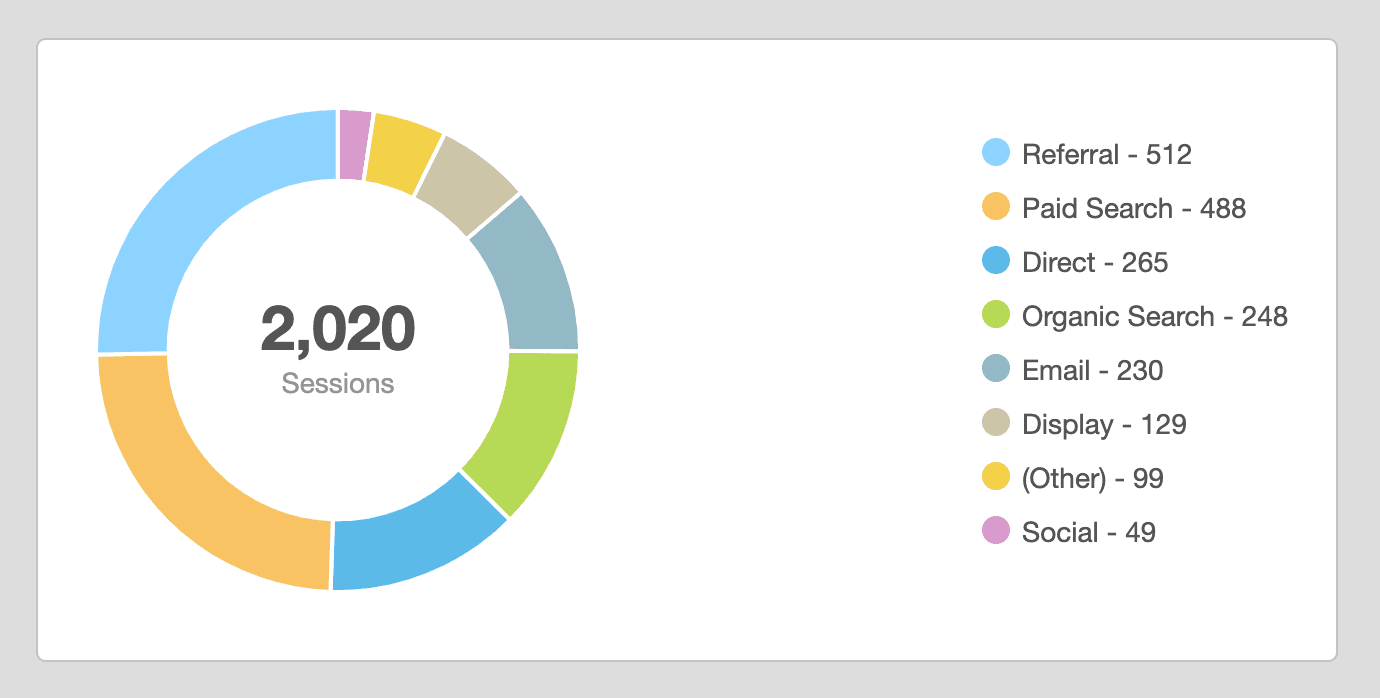
For more detailed campaigns, adding interactive data visualization elements lets users drill into slices for additional information.
Example 4: Tables
Tables remain an essential tool for detailed comparisons that require precision. They work well when clients need to review exact figures, benchmarks, or rankings.
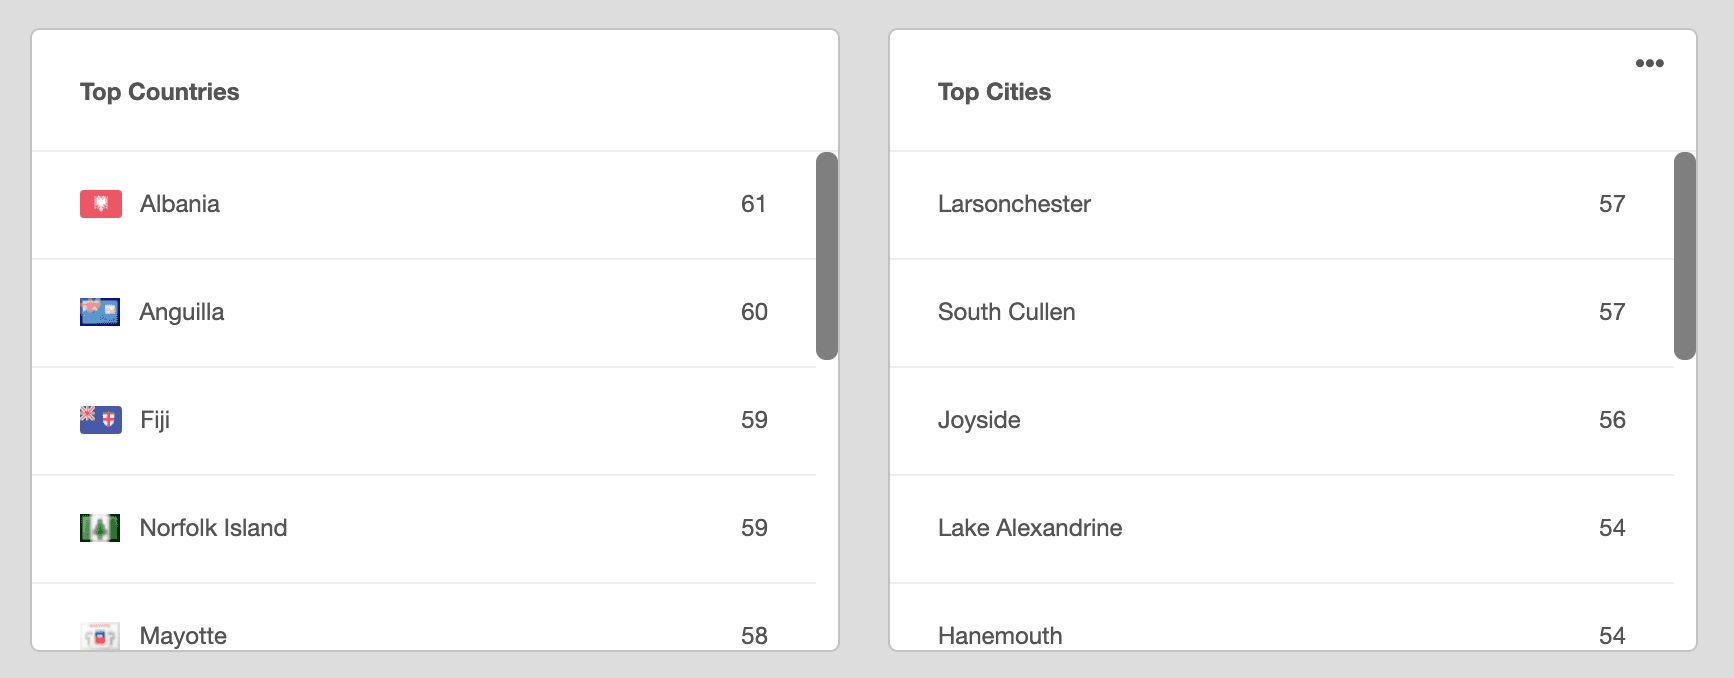
Using tables alongside more visual formats balances high-level insights with the ability to dig deeper into the data when necessary.
Example 5: Map Charts
Map charts transform geographic data into an intuitive visual format. When comparing performance across regions, cities, or countries, a map chart makes it easy to see which areas drive the most results.
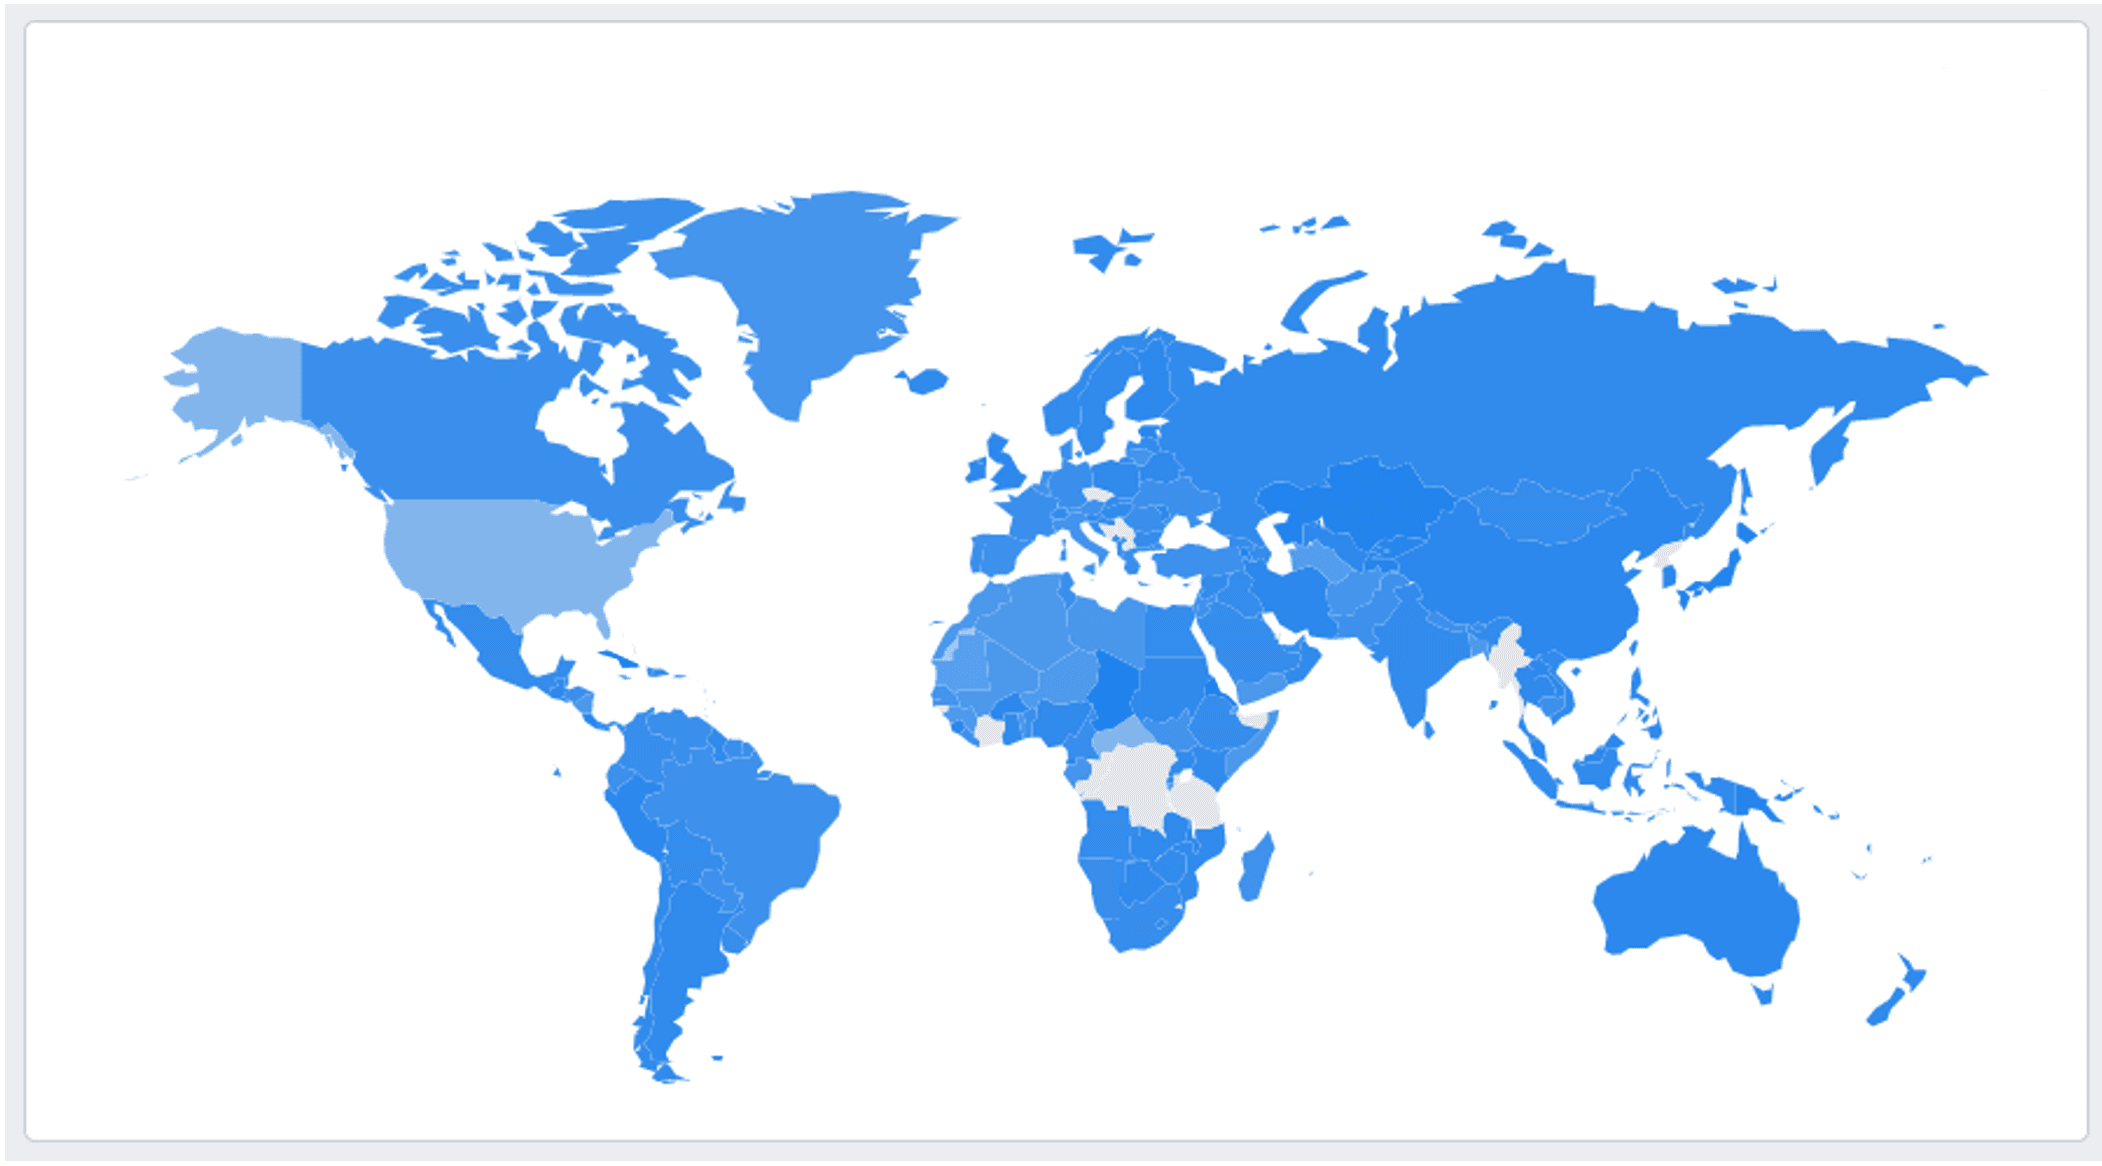
Using automatically updated data creates a dynamic view of performance across the state or around the world, helping agencies spot local opportunities or gaps quickly.
Example 6: Stacked Charts
Stacked charts are helpful when visualizing the component parts of a total result. This chart shows the total number of conversions or impressions and how different channels or tactics contributed to that total. They are also handy for bucketing results by performance targets, such as top keyword ranking positions.
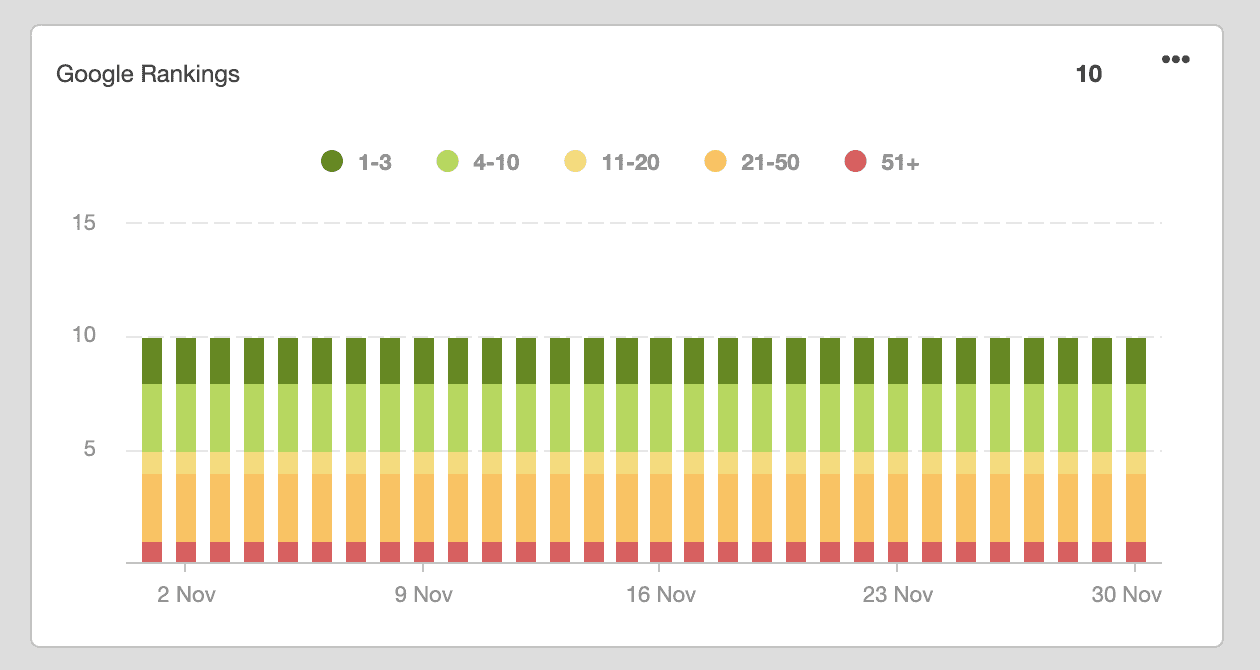
Stacked charts reveal changes in campaign structure or performance without needing long narrative explanations.
Example 7: Stat Widgets
Stat widgets highlight a single key metric at a glance. Whether tracking conversion rate, cost per acquisition, click-through rate, or audience engagement, a stat widget brings critical numbers forward without distraction.
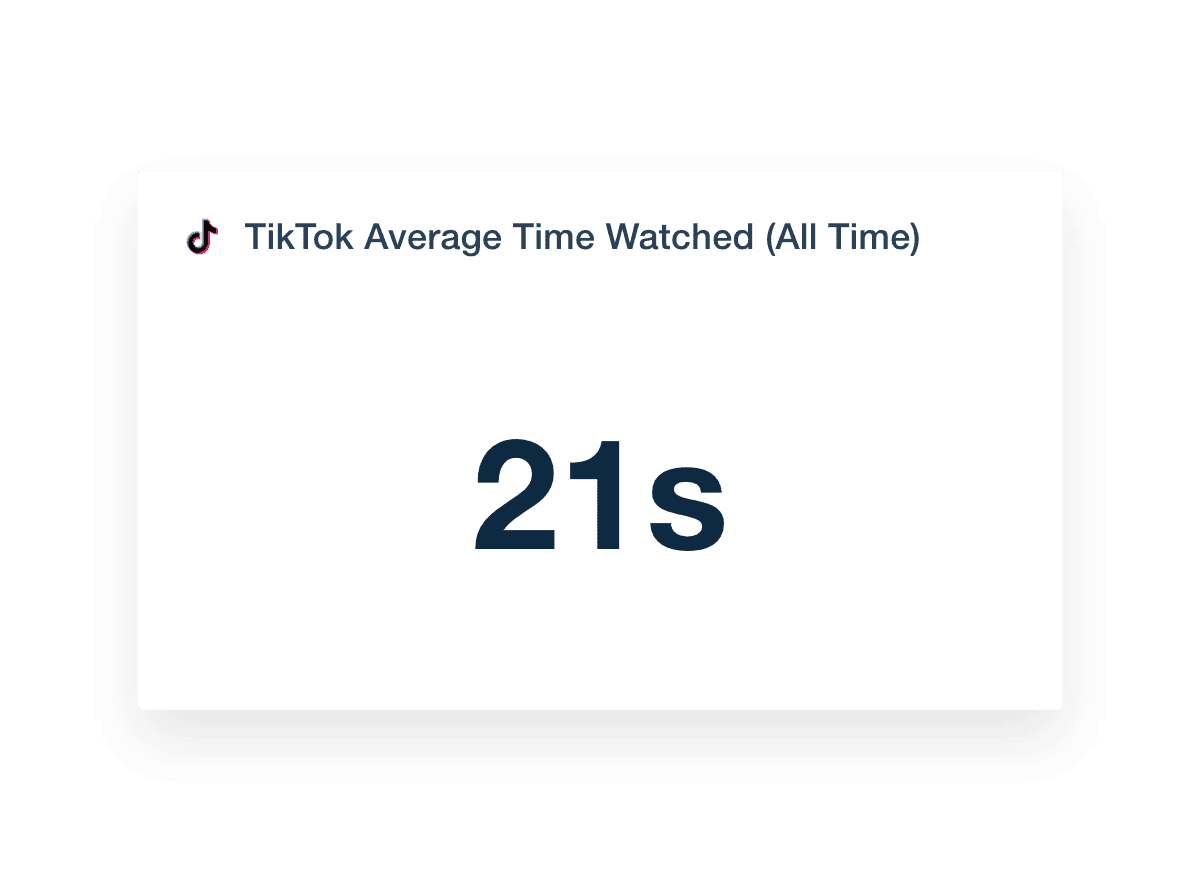
Interactive visualization of important metrics and KPIs speeds up client analysis and keeps the focus on results that matter most.
Example 8: Sparkline Charts
A sparkline is a small, simplified line graph embedded within an existing widget. These mini-charts are perfect for displaying trends over time without taking up too much space.

When used with up-to-date data, a sparkline provides instant context for how a metric trends across different periods.
Example 9: Gauge Charts
Gauge charts visually track performance against key benchmarks or best practices. Whether monitoring SEO health, traffic goals, or ad conversion rates, gauge charts provide a clear snapshot of how close a campaign is to hitting optimal targets.
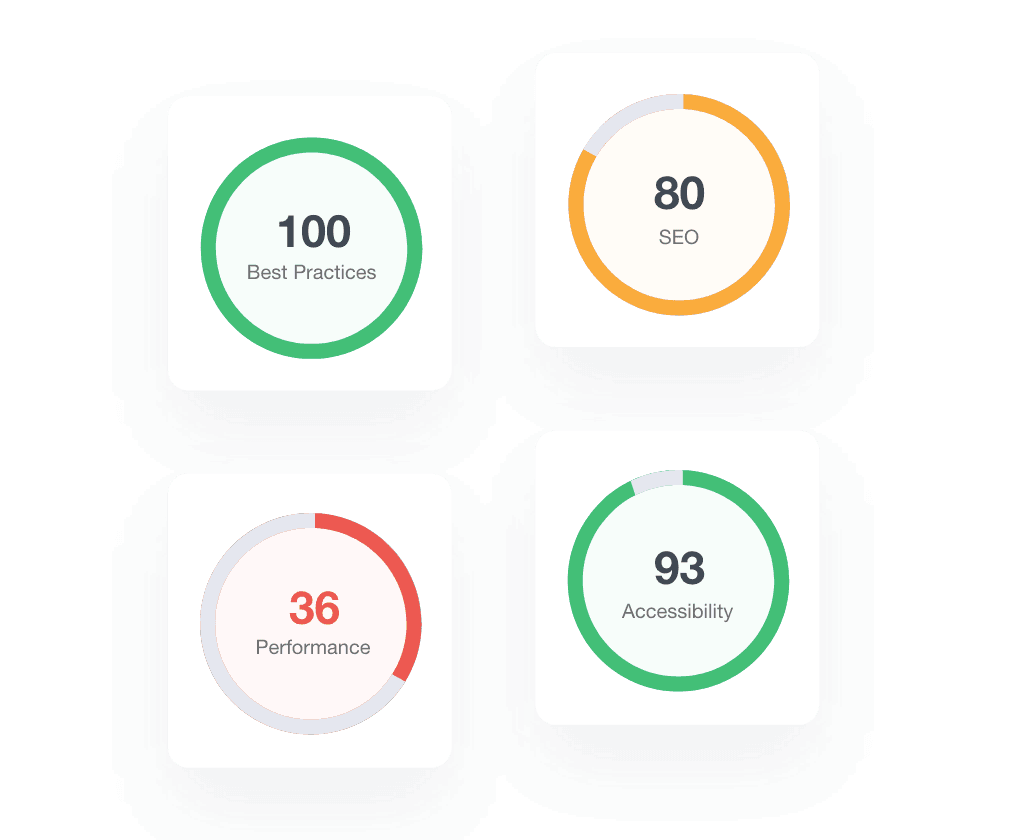
Instead of digging into multiple metrics, clients quickly see whether performance is on track, needs attention, or exceeds expectations. Gauge charts are ideal for making complex KPIs accessible and actionable in seconds.
Example 10: Area Charts
Area charts work well when emphasizing volume trends over time. Similar to a line graph, but with the area beneath the line filled in, this chart shows both direction and magnitude.
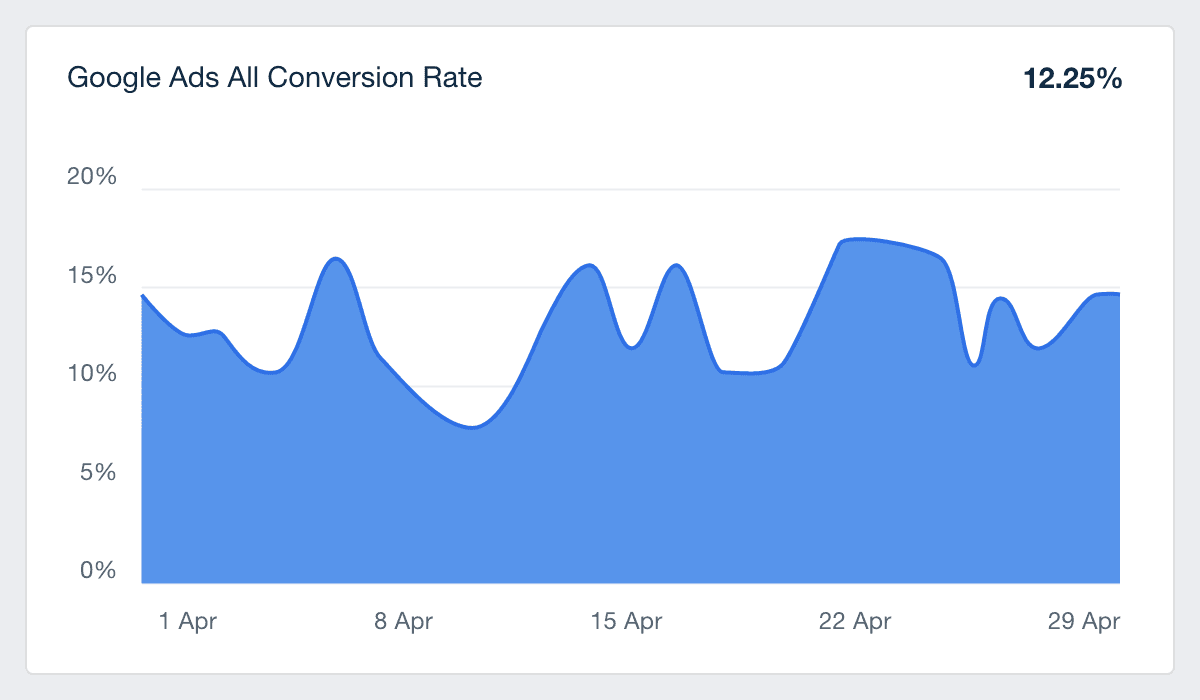
Area charts are ideal for highlighting cumulative growth, helping clients see the scale of impact without needing additional information.
Example 11: Funnel Charts
Funnel charts map out the customer journey step-by-step. They are essential for understanding how prospects move through stages like clicks, leads, MQLs, SQLs, and customers or ad journeys from impression to conversion.
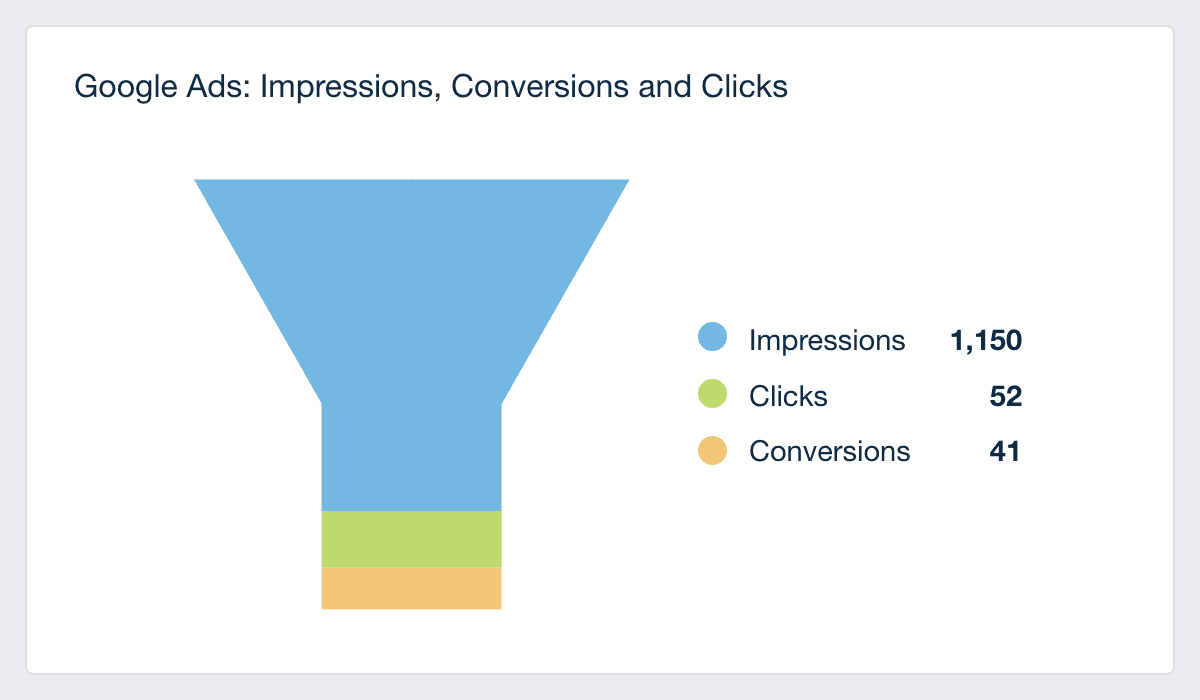
A funnel chart shows conversion drop-offs clearly, helping drive faster data-driven decisions about where optimization is needed.
Example 12: Goal Trackers
Goal trackers visually measure progress against predefined KPIs. Whether tied to lead generation, ad spend, or site traffic, a goal tracker provides a simple, visual checkpoint for how campaigns progress.
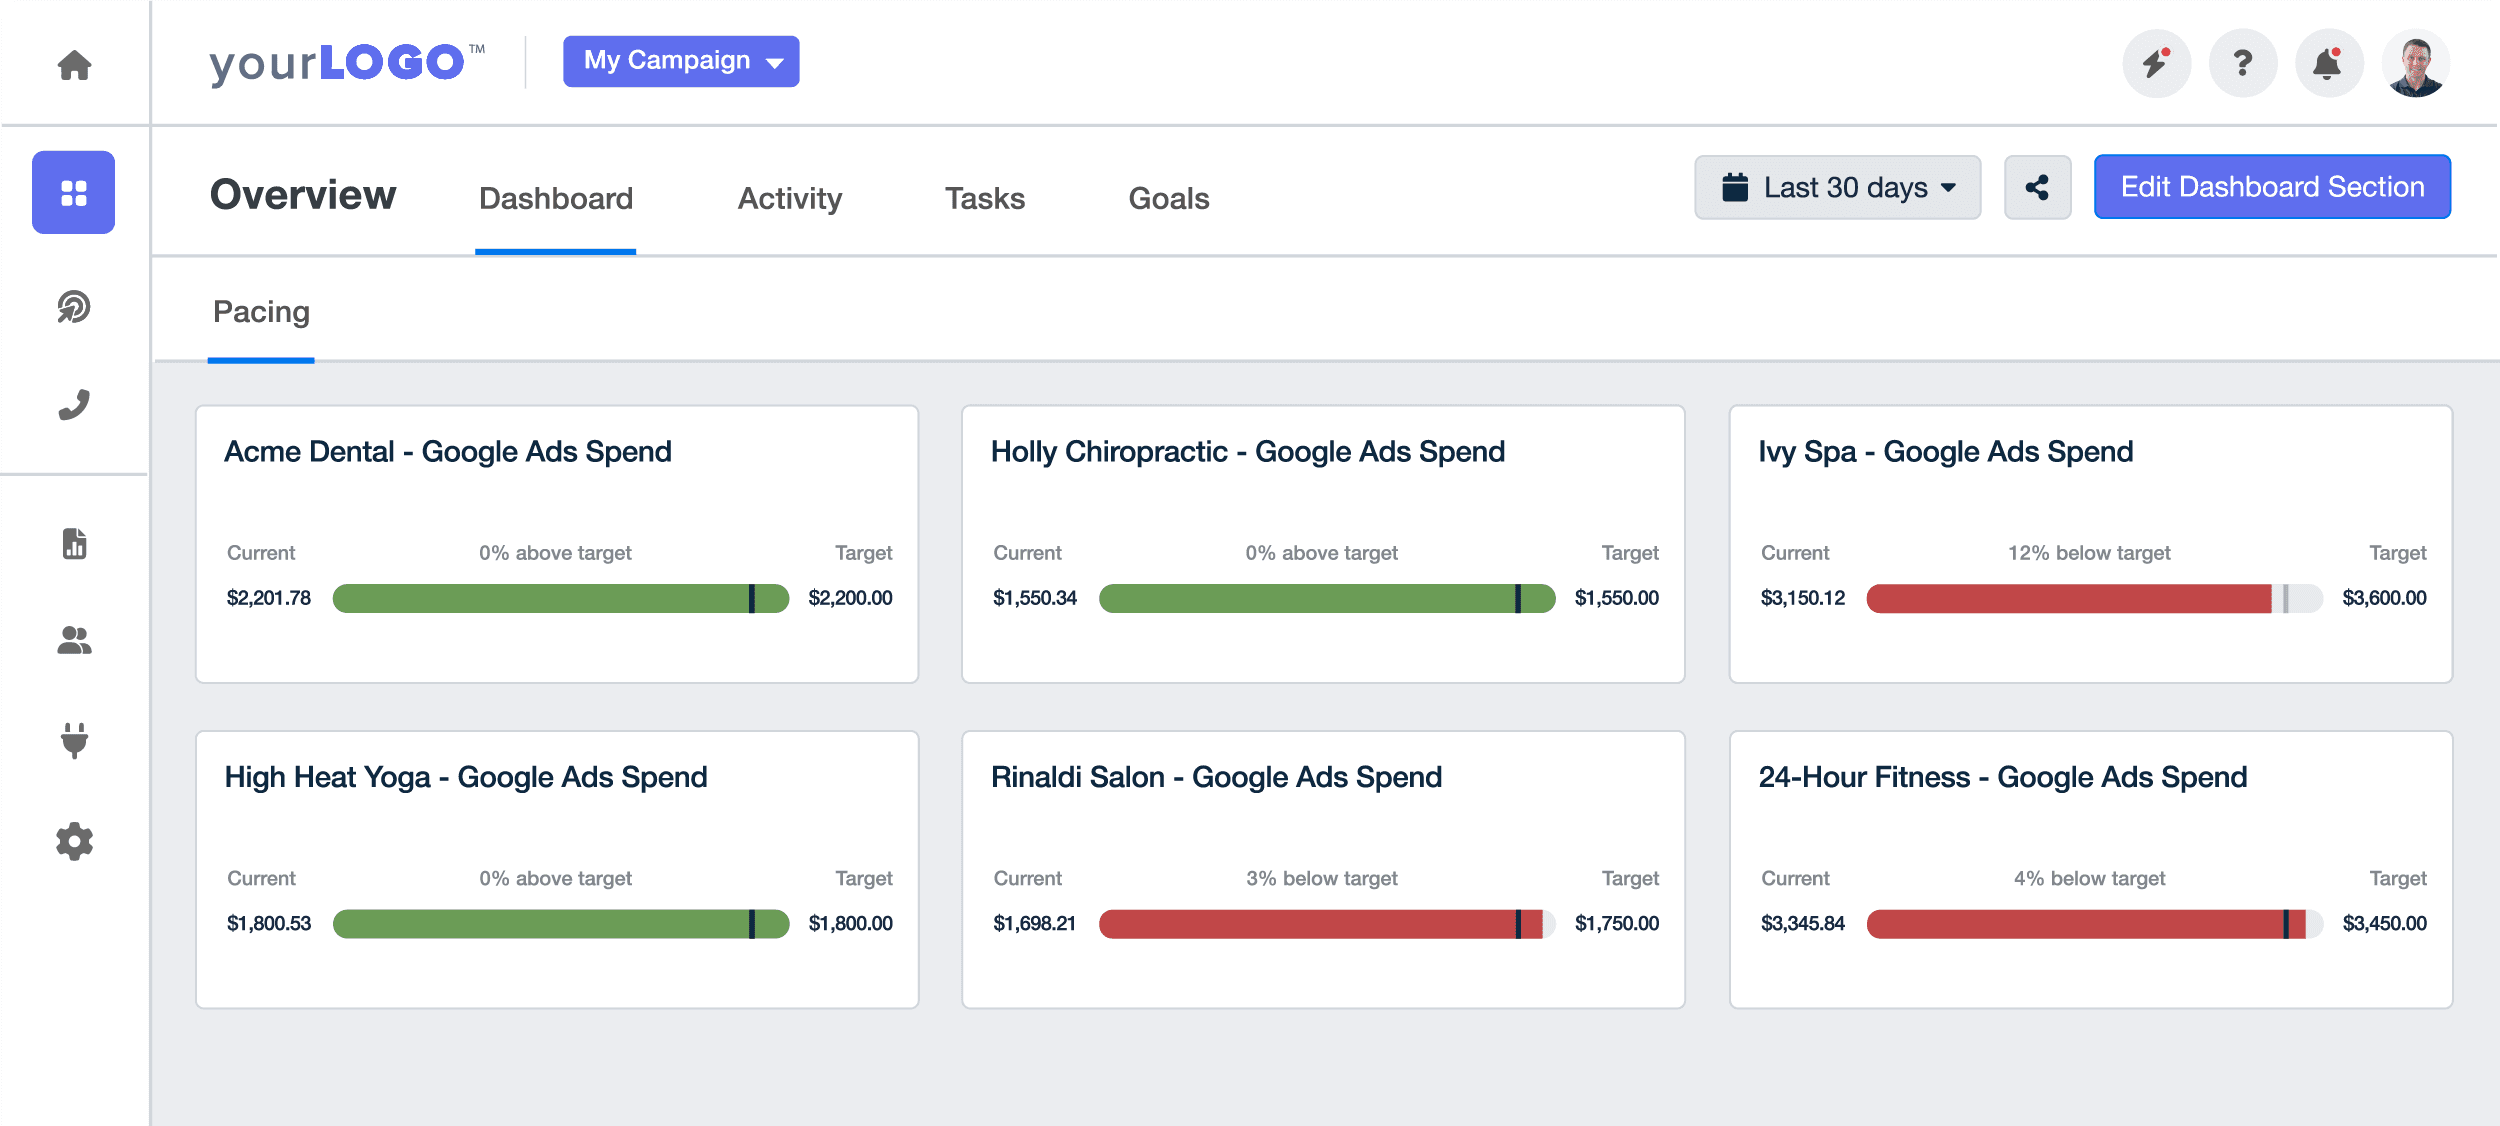
Using an interactive data visualization platform to update goal trackers automatically from live data keeps reports fresh and actionable.
Bad Data Visualization Examples (and What to Avoid)
Poorly designed charts confuse audiences, hide real insights, and weaken client trust. Avoiding common visualization mistakes helps maintain credibility and keeps performance data clear and actionable. Here are just a few of the most egregious data visualization mistakes to avoid:
Mistake #1: Overcomplicated Visuals That Hide Insights
Packing too much into a single chart makes it harder for clients to focus on the story the data needs to tell. Charts filled with too many lines, multiple scales, or endless categories turn insights into noise. Simplicity drives better understanding, while overcomplication creates doubt and distraction.
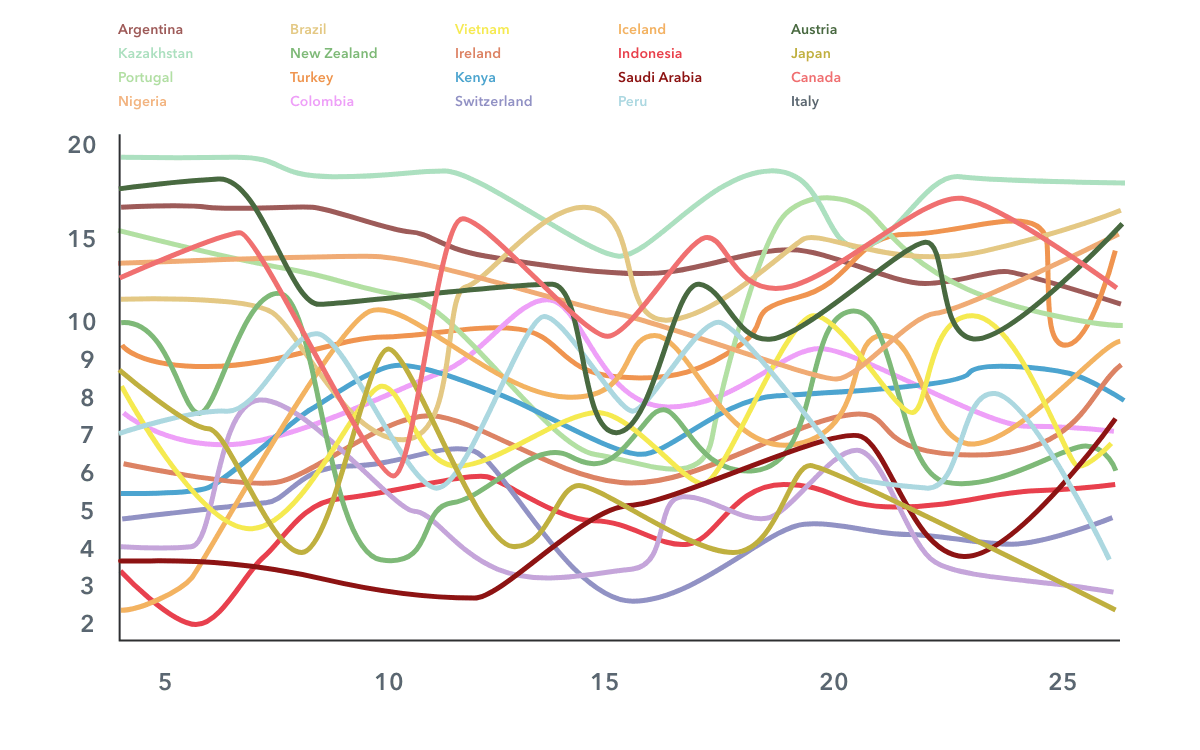
Example: A cluttered multi-line graph with 20+ lines, different colors, and tiny legends makes it challenging to tell what any trend means.
Mistake #2: Distorted or Misleading Chart Designs
Visuals that distort data scale, skip key values on axes, or visually exaggerate minor differences create a false impression of performance. Clients rely on accurate, transparent reporting. Even unintentional distortion could damage credibility and make campaign analysis unreliable.
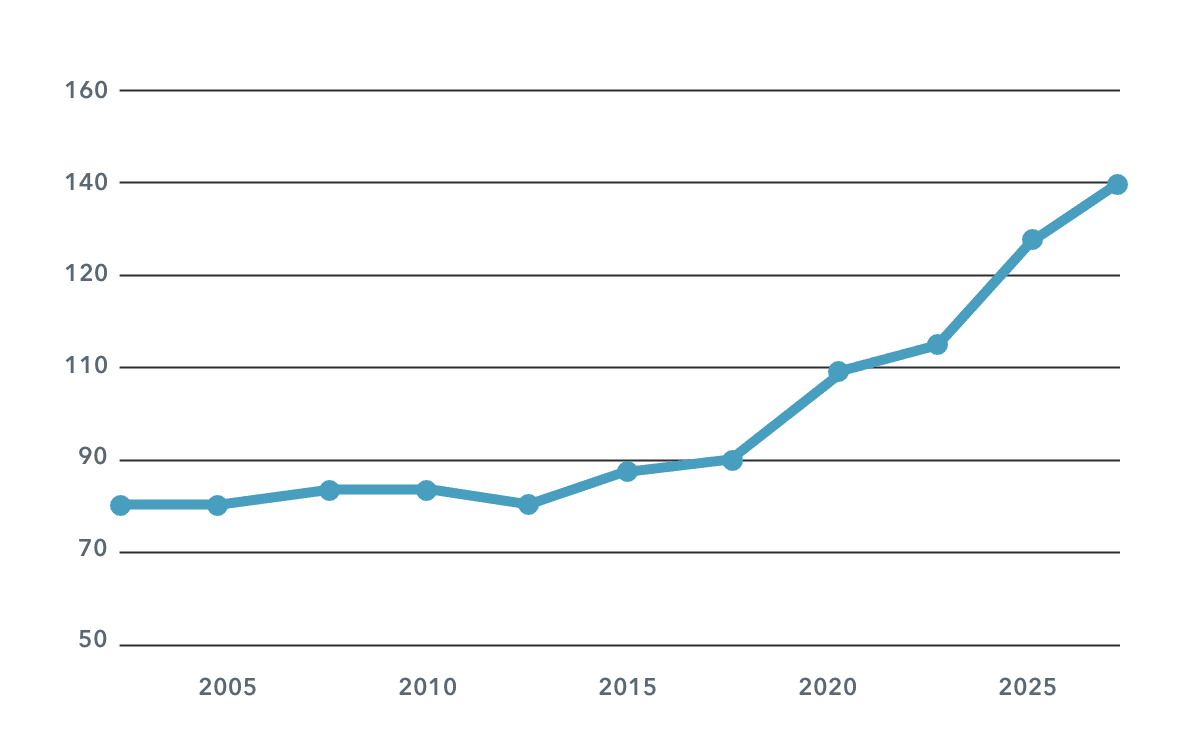
Example: A line chart where the y-axis starts at 50 instead of 0 can make slight differences between campaigns appear massive.
Mistake #3: Overloaded Visuals With Too Much Text or Irrelevant Data
Charts that include excessive labeling, vanity metrics, or multiple conflicting insights overwhelm viewers. Visuals should guide the reader to a single, clear takeaway. Overloading a report forces clients to work harder to find meaning and risks losing their attention entirely.
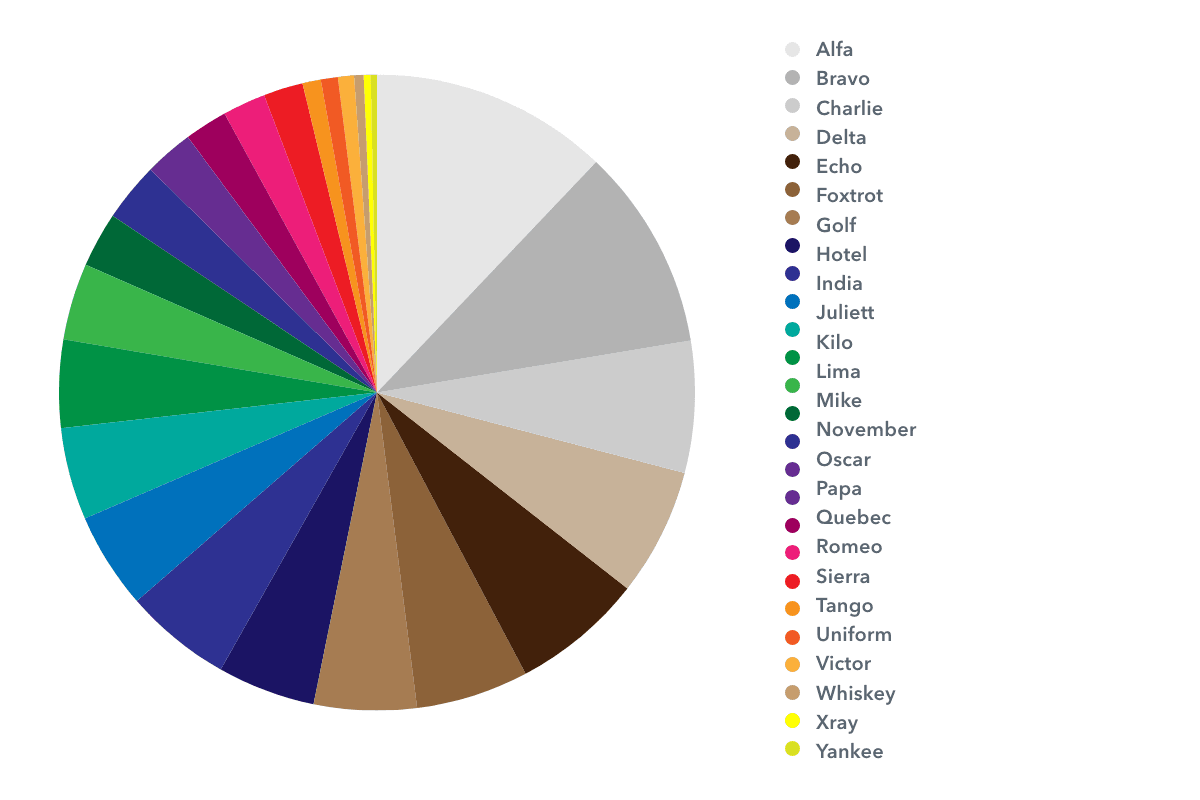
Example: A pie chart with 25 (or more) slices, small font labels crammed into each section, and a cluttered legend will make it hard to match the slices with the data.
Mistake #4: Cluttered Tables That Become a Data Dump
Tables overloaded with dozens of metrics, inconsistent formatting, and small, dense text make comparison nearly impossible.
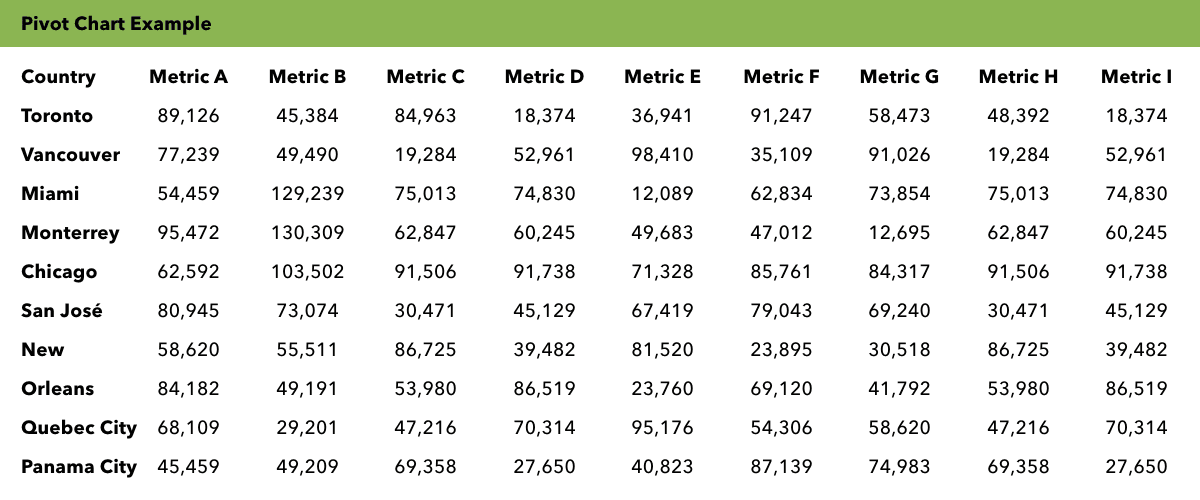
Example: A large table showing 100+ metrics with no color coding or visual grouping will make it practically impossible to identify key insights.
Mistake #5: Inconsistent Color Usage That Confuses Clients
Using random colors for the same data types across different charts creates confusion and disrupts the flow of the report.
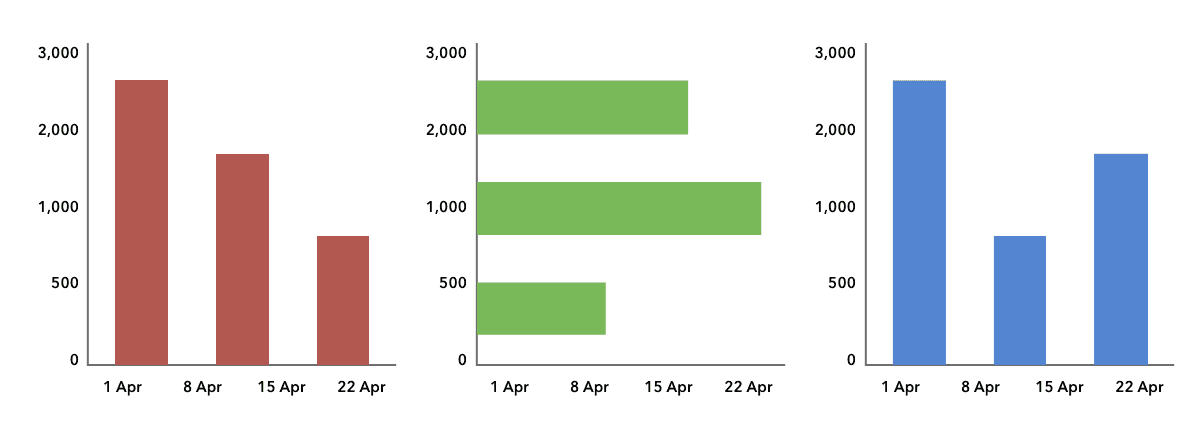
Example: Multiple charts in the same report, with conversions shown in red on one graph, green on another, and blue on a third, will confuse clients and make them question the data.
Mistake #6: Unnecessary Decorative Elements That Put the Focus on Design, Not Data
Charts filled with shadows, gradients, clip art, or overly decorative fonts distract from the actual data being presented.
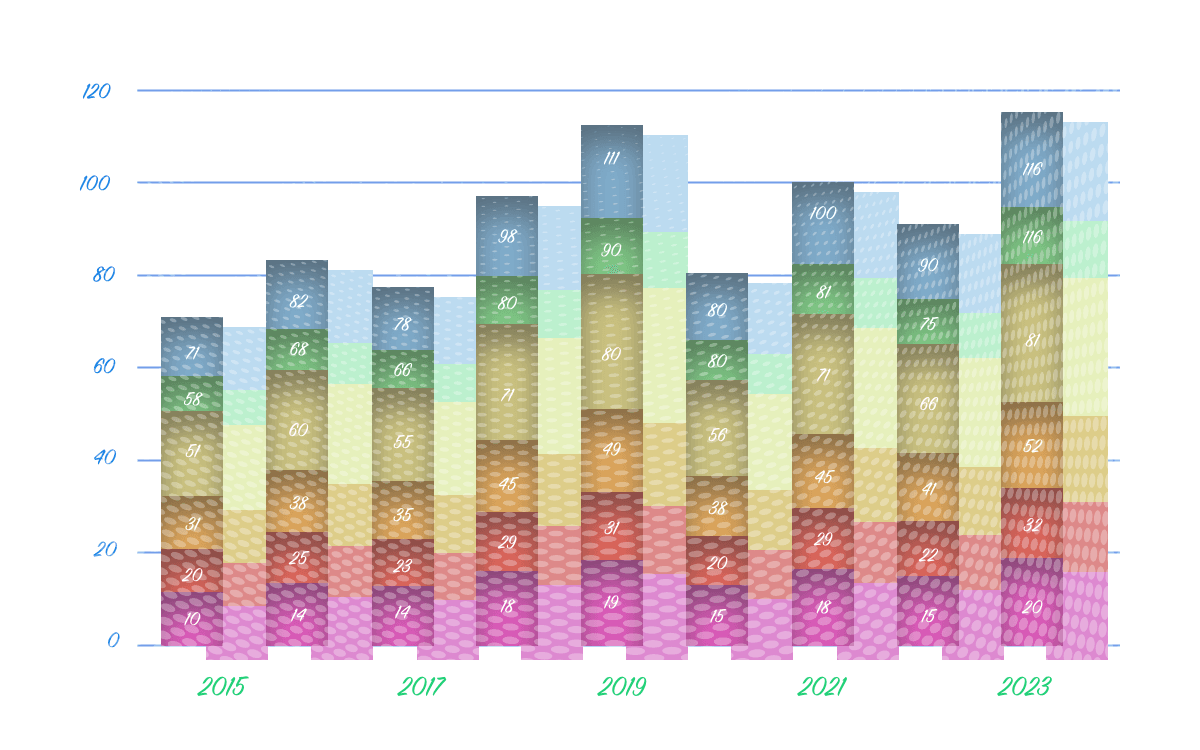
Example: A bar graph with heavy 3D effects, background textures, and fancy fonts will make understanding the numbers more difficult than it should be.
How To Use Creative Data Visualization In Client Reports
A strong client report makes the main takeaways obvious at first glance. Before choosing a chart type, it is important to define the main takeaway. If the goal is to show growth over time, a line graph or sparkline fits best. If the goal is to compare campaign results side-by-side, bar charts or column charts work better.
The story always drives the choice of visual format—not the other way around. Keep these data visualization best practices in mind when creating your next client report:
Balance Detail With Clarity: Reports must balance providing enough detail with keeping insights easy to grasp. Too much information clutters the visuals, while too little information can leave important context out. Strong reports layer data effectively: using tables for deep dives and clean, simple charts for high-level takeaways.
Keep Reports Easy for Clients to Understand at a Glance: Clients should not need to study a chart to understand campaign performance. Reports that are easy to scan lead to faster, more confident decisions. Consistent visual styles, clear labels, and straightforward chart types keep attention on the results. The goal is always the same: present the correct data, in the right way, at the right time—so clients see the value immediately.
Use Interactive Elements Thoughtfully: Interactive data visualization dashboards enhance client performance reports when used with purpose. Giving clients the ability to filter time periods, drill into specific metrics, or view regional performance in more detail helps keep reports flexible and focused.
Why AgencyAnalytics Is Built for Better Data Visualization
Strong data visualization starts with the right platform. AgencyAnalytics simplifies the entire process by putting marketing-focused visuals at the center of client reporting. Every feature is designed to turn up-to-date performance data into reports that are easy to build, easy to understand, and easy to share.
How AgencyAnalytics Simplifies Creating Impactful, Marketing-Focused Visuals
AgencyAnalytics removes the need for complex setups or manual exports. Interactive dashboards make it easy to pull up-to-date data from over 80 marketing platform integrations.
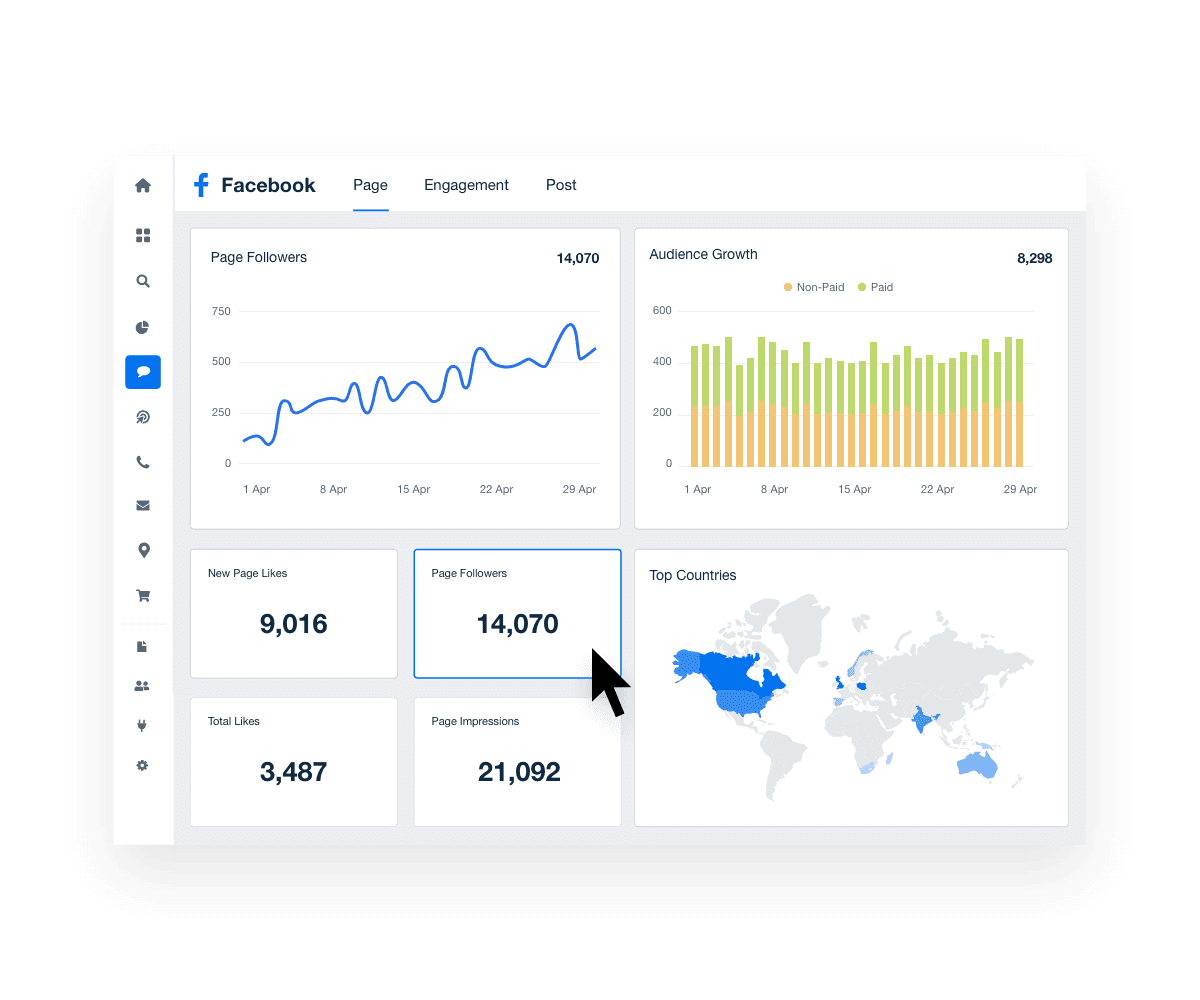
Clear templates guide visualization choices, ensuring every chart tells the right story. Reports stay focused, client-friendly, and ready for immediate use. See for yourself how professional data visualizations improve client reporting. Try AgencyAnalytics free for 14 days.
Key Features: Drag-and-Drop Dashboards, Flexible Chart Types, Automated Client Reports
Drag-and-drop functionality makes building dashboards intuitive. Different types of data visualizations—from bar charts and line graphs to goal trackers—cover all the major needs for campaign reporting.
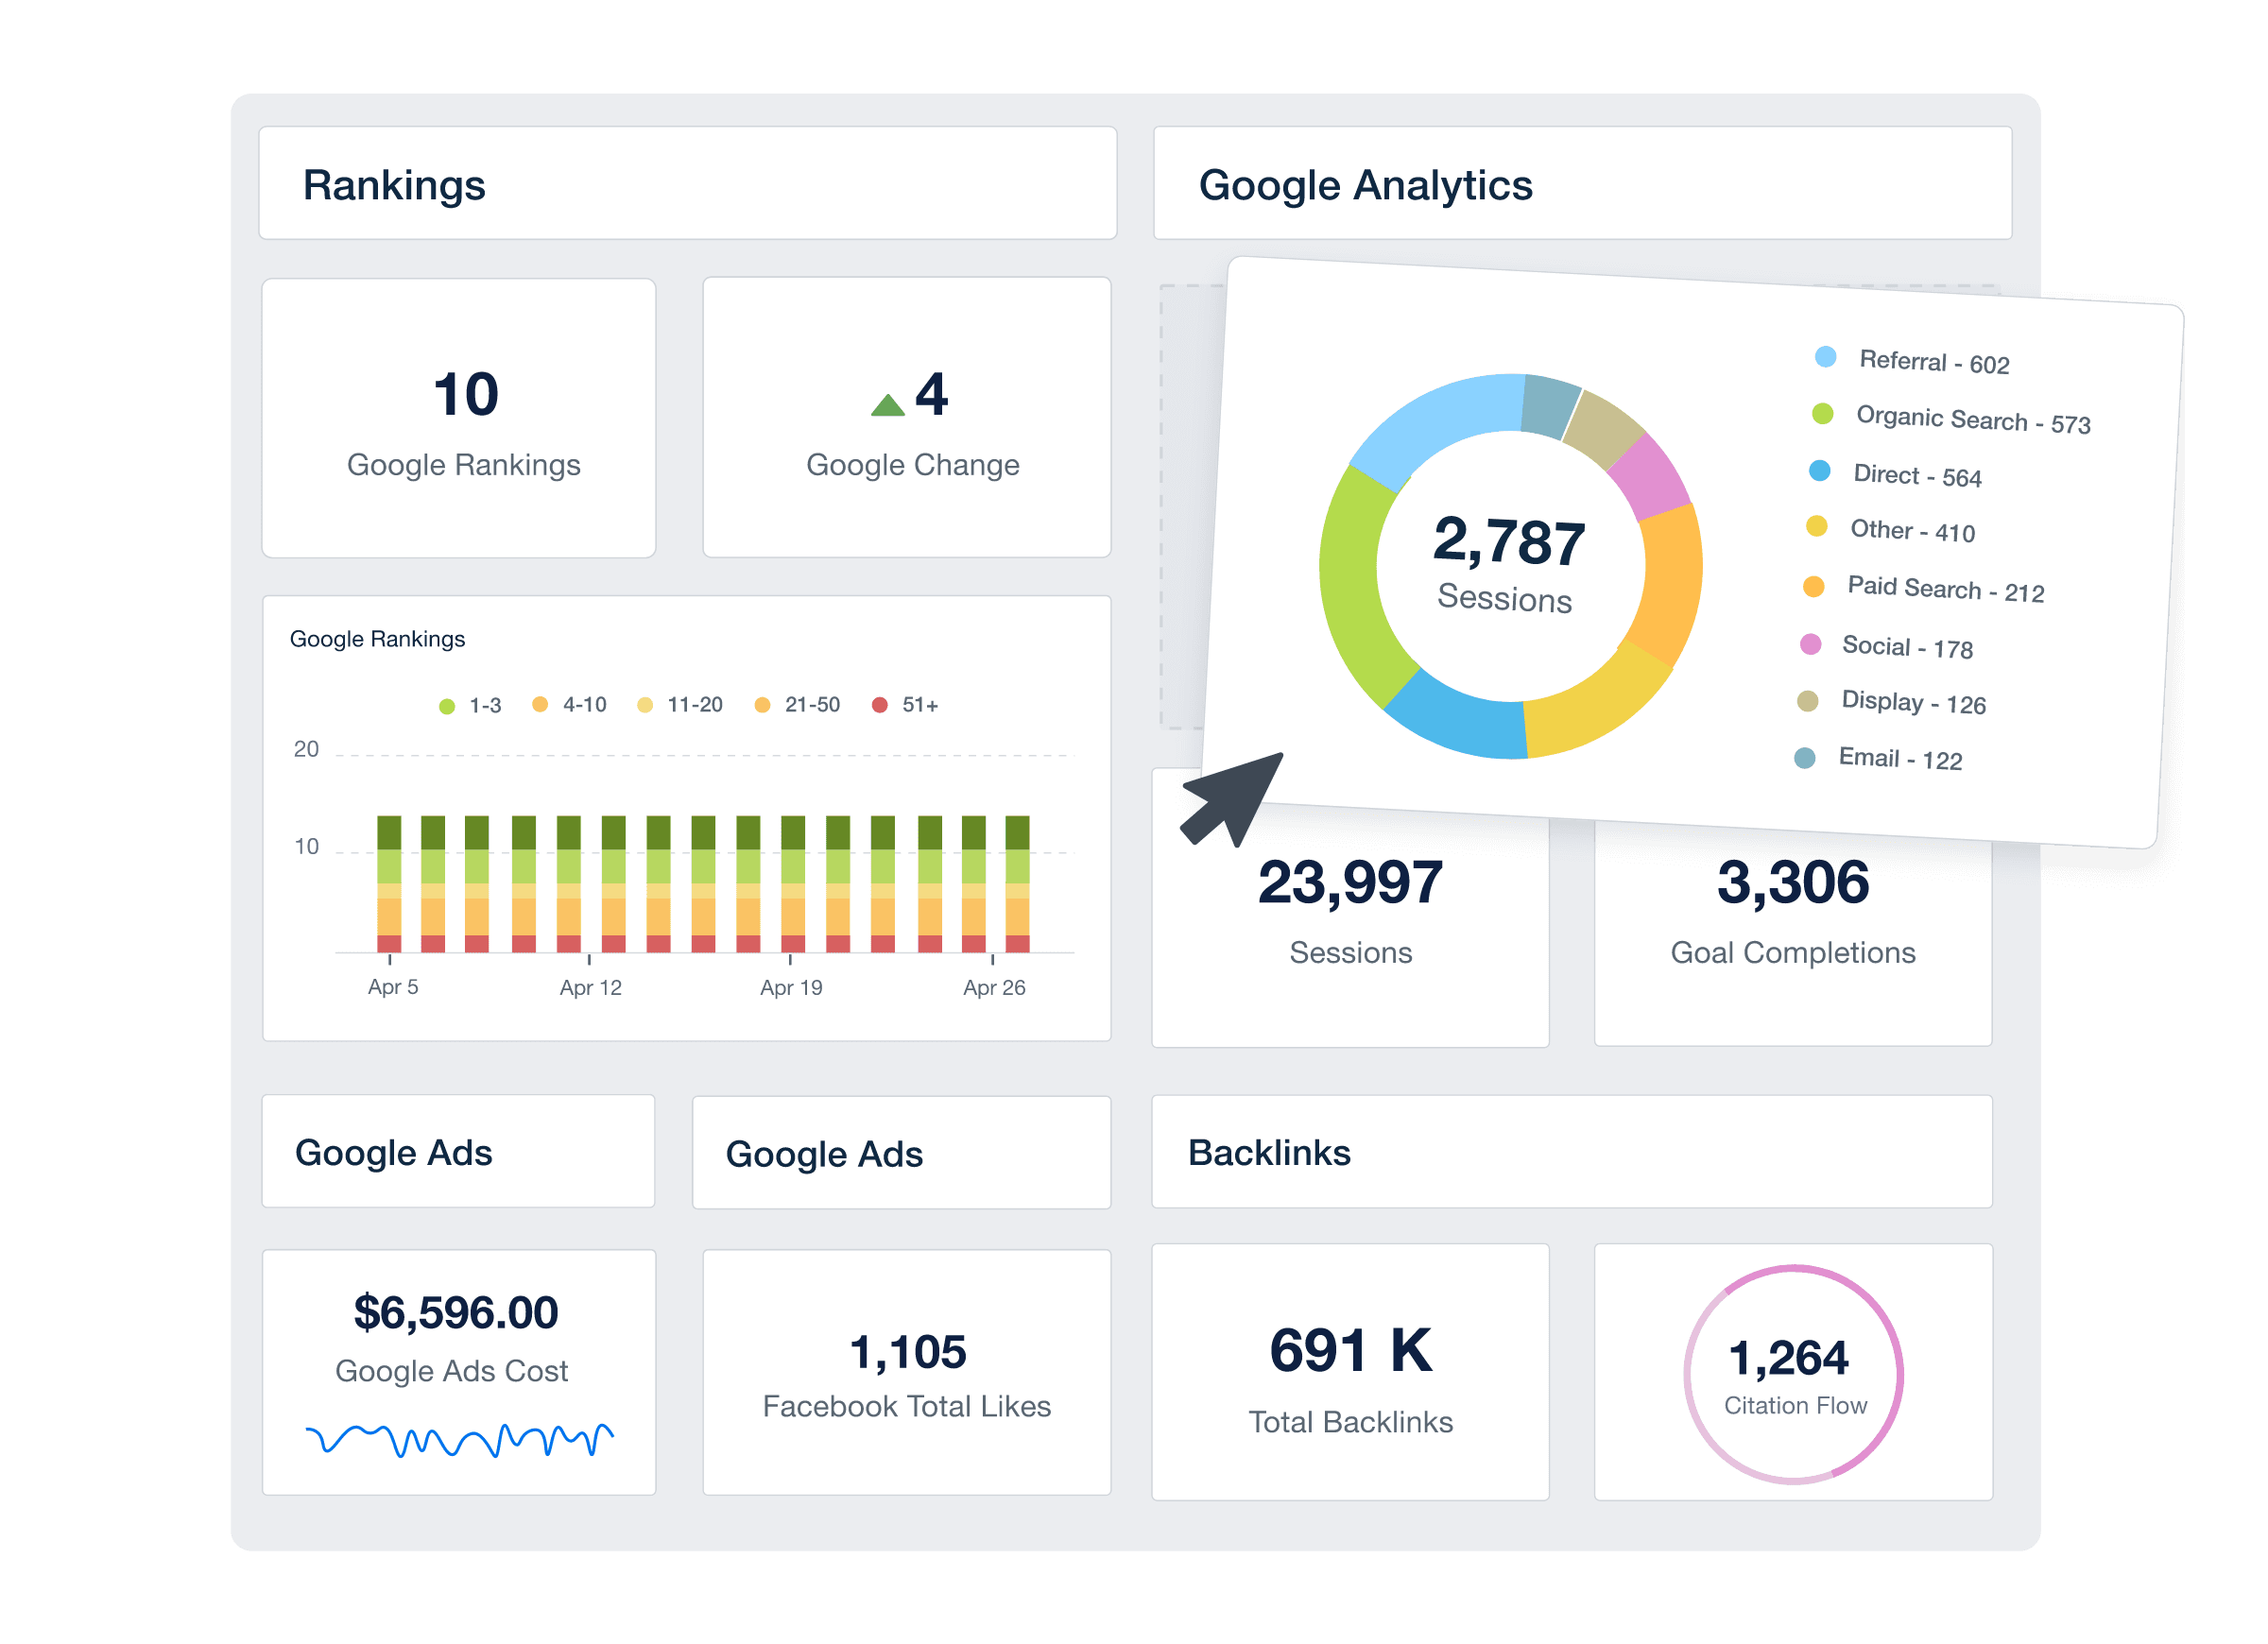
Automated client reports ensure that performance updates stay consistent and timely without becoming a drain on agency resources.
Benefits of Using a Purpose-Built Platform Instead of General BI Tools
Traditional business intelligence tools are built for data teams, not marketers. They often require complex configuration and feel disconnected from day-to-day marketing insights.
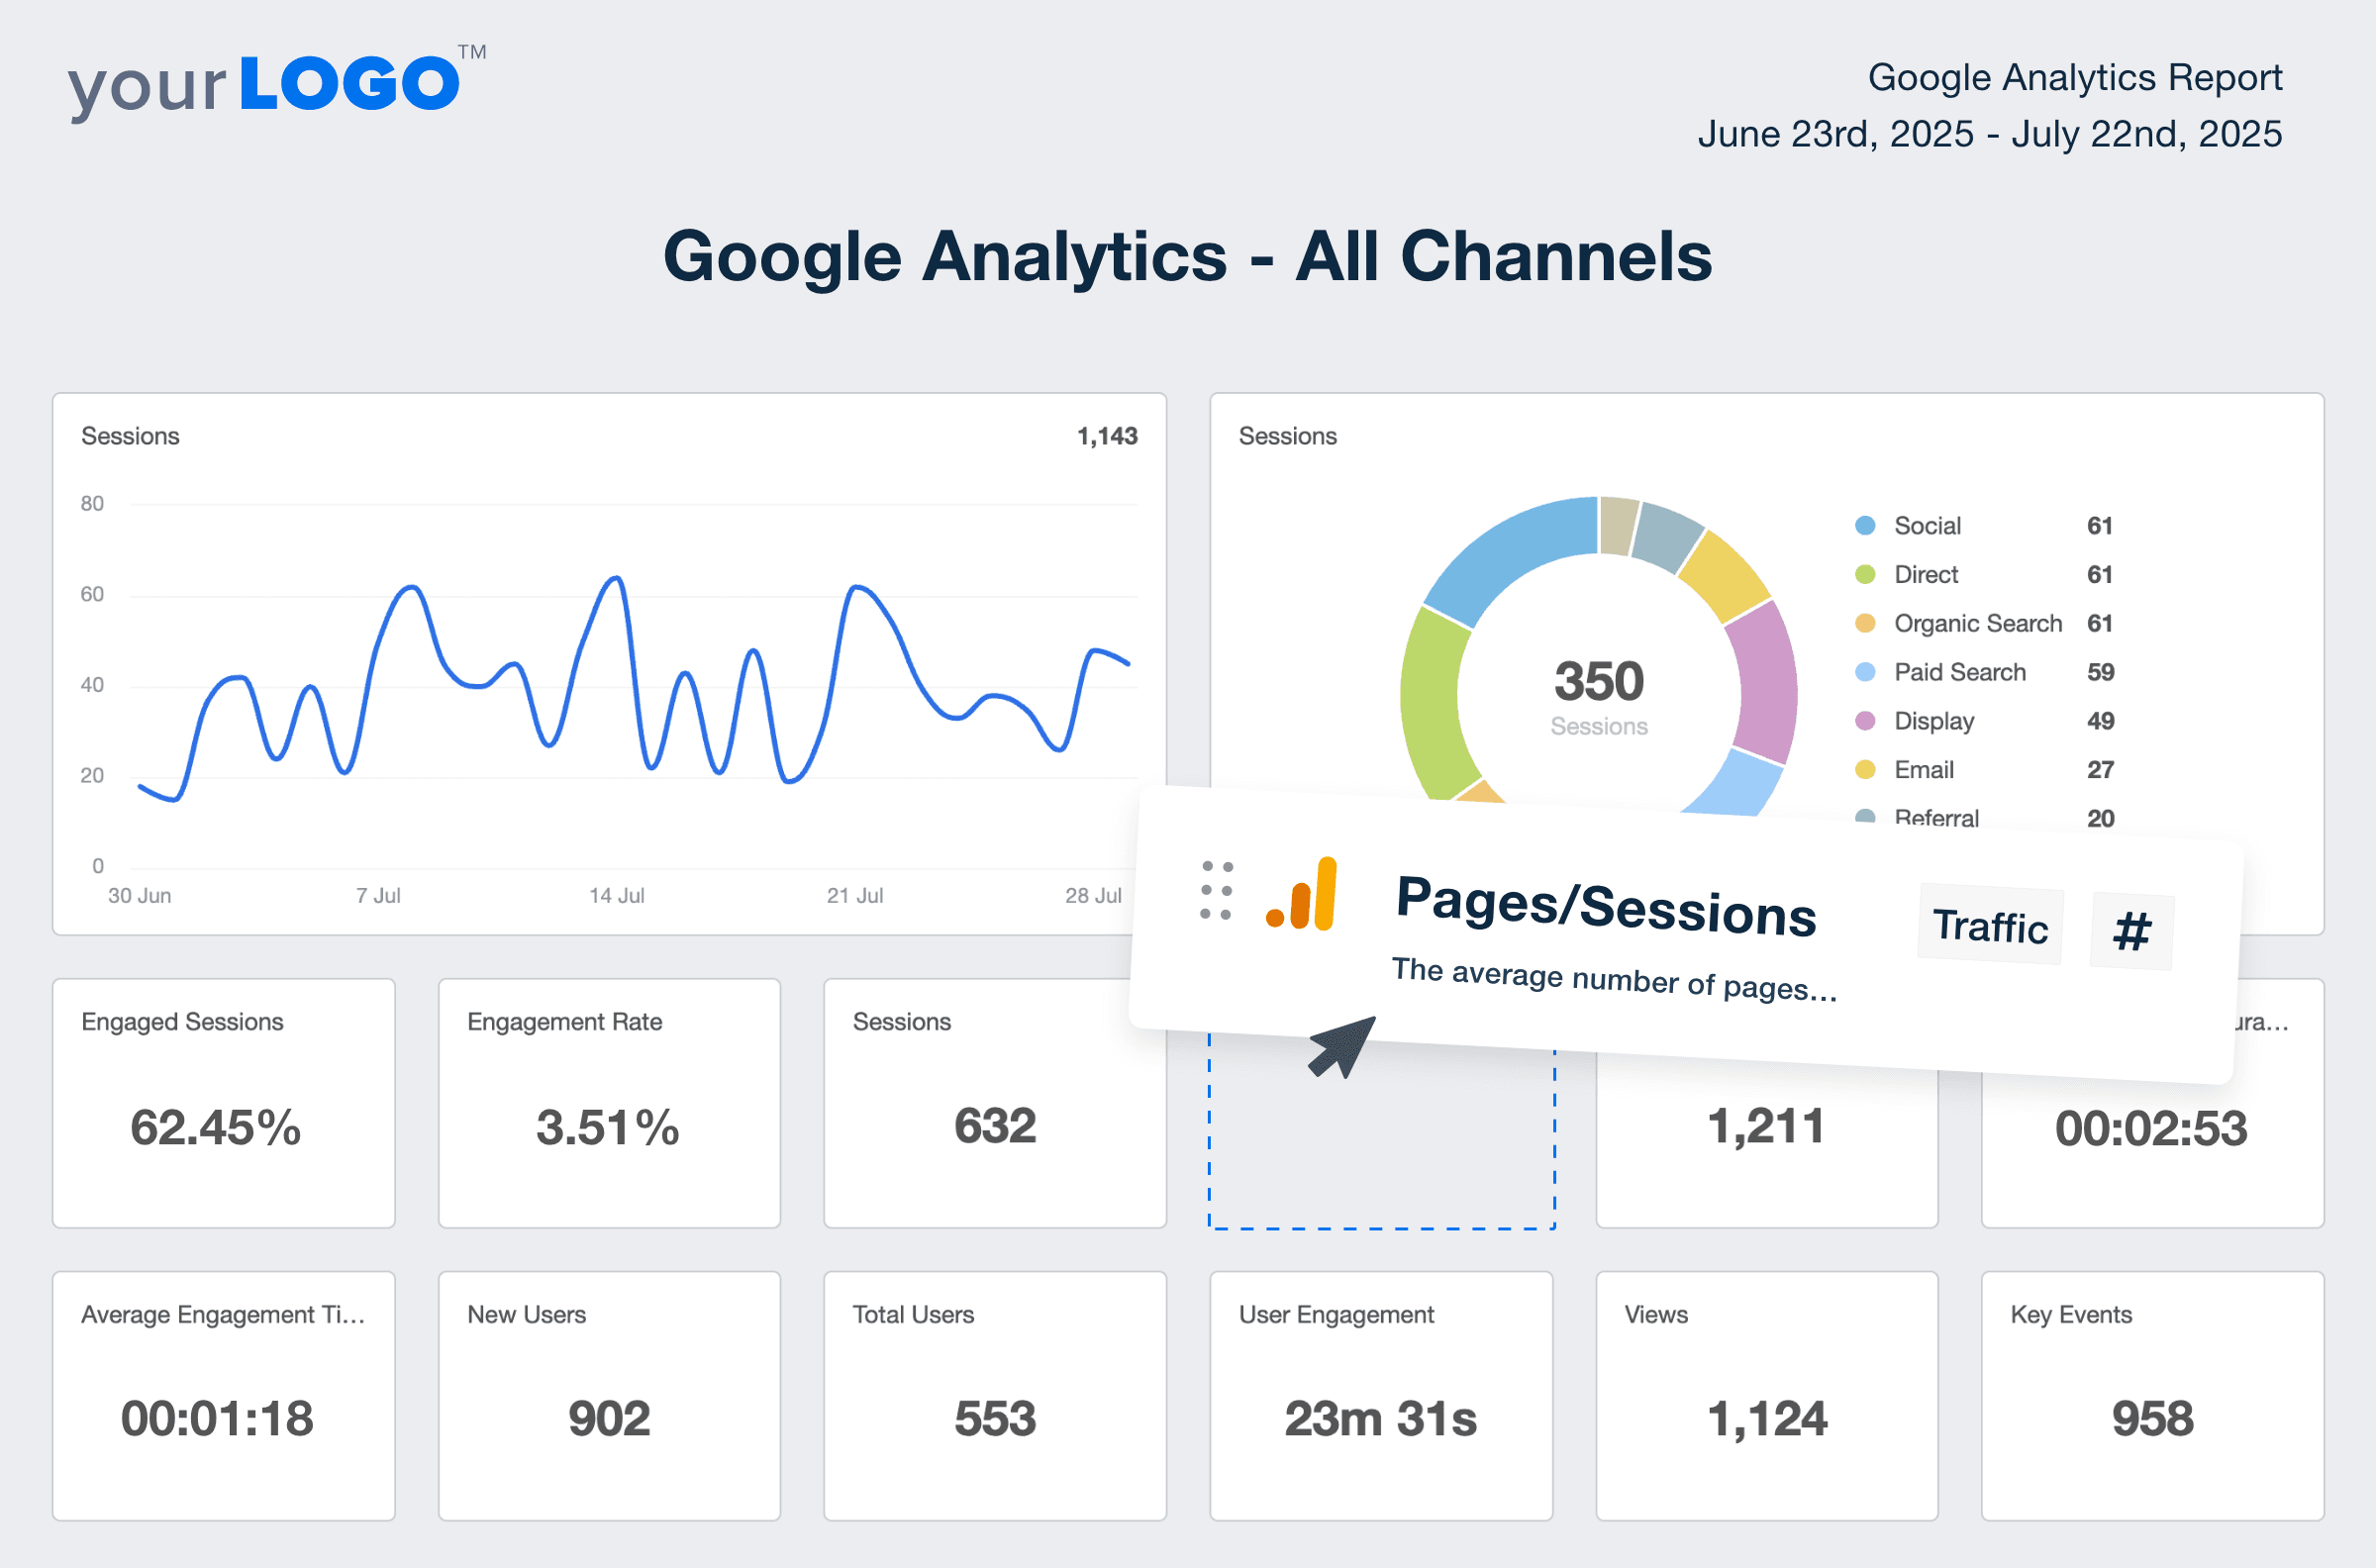
AgencyAnalytics is purpose-built to present the data that matters most to marketing clients, making it faster to create meaningful reports without specialized technical skills.
Why Using AgencyAnalytics Improves Reporting Speed, Accuracy, and Client Experience
Using AgencyAnalytics streamlines reporting workflows, reduces the risk of manual errors, and keeps visualizations aligned with campaign goals.
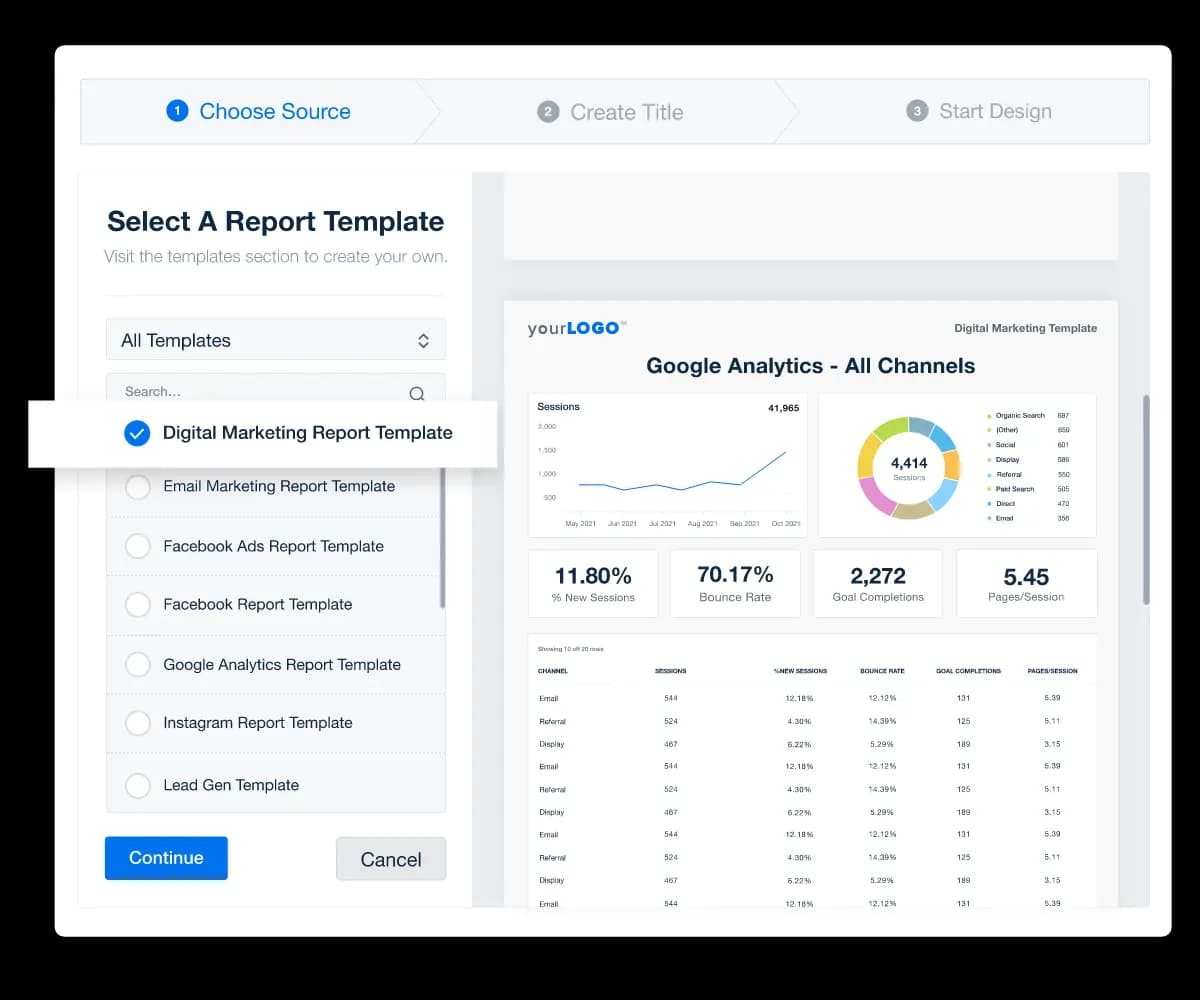
Reports built with AgencyAnalytics help clients see results faster, understand insights more clearly, and feel more confident in the strategies being executed.
AgencyAnalytics not only enables the team to have useful data at their fingertips, but also presents it in a palatable way for our clients to digest. Beyond time savings, the platform helps us keep the client conversation centered on strategy vs chasing down metrics and helping the client understand them.


Written by
Paul Stainton is a digital marketing leader with extensive experience creating brand value through digital transformation, eCommerce strategies, brand strategy, and go-to-market execution.
Read more posts by Paul StaintonSee how 7,000+ marketing agencies help clients win
Free 14-day trial. No credit card required.


