Table of Contents
Table of Contents
- The Importance of LinkedIn Reporting in the Agency-Client Relationship
- What Makes a Great LinkedIn Ads Report?
- Essential LinkedIn Ads Metrics to Track
- 5 Common Challenges of LinkedIn Ads Reporting
- 10 Best Practices for Building LinkedIn Ads Reports
- Revolutionize Your LinkedIn Ads Reporting With AgencyAnalytics
7,000+ agencies have ditched manual reports. You can too.
Free 14-Day TrialQUICK SUMMARY:
A LinkedIn Ads report brings together all the key campaign data in a straightforward, easy-to-digest format. It’s not just about tracking performance—it’s a chance to highlight what’s working and what can be adjusted to achieve even better results. In this article, we’ll show you how to create a LinkedIn Ads report that impresses clients, landing you referrals, repeat business, and cementing your agency as an industry leader.
LinkedIn Ads are crucial for B2B marketing, but without the right reporting, you won’t know what’s hitting the mark and what’s falling flat. With most marketing budgets shrinking—down to 7.7% of overall company revenue from 9.1% last year—marketing leaders are under more pressure than ever to do more with less, making insightful reporting a must.
Creating detailed and insightful LinkedIn Ads reports using Campaign Manager reporting for your clients helps you demonstrate the effectiveness of your agency’s digital advertising strategies and prove return on investment (ROI), justifying the client’s ad spend and securing space in the budget to extend your contract, or upsell other agency services.
In this article, we’ll run through the best practices for creating a LinkedIn Ads reporting dashboard, explore the perks of automated client reporting, and learn how effective reporting will strengthen client relationships and drive better results.
The Importance of LinkedIn Reporting in the Agency-Client Relationship
When you provide your clients with LinkedIn Ads reports, you're not just handing over data—you're showing them how well your digital advertising strategies are working, and that by investing in your agency, they’re getting the best bang for their buck.
These reports dive deep into campaign performance, offering insights that help clients fine-tune their marketing efforts and optimize their campaigns and ads. By focusing on key LinkedIn metrics like impressions, engagement rates, and follower growth, clients see the real impact of their marketing, make smarter decisions, and boost their ROI, all of which reflects well on you.
LinkedIn is one of the top platforms for B2B lead generation due to its precise audience-targeting capabilities, making it easier to reach decision-makers and key influencers in relevant industries. The platform's targeting options allow you to tailor your campaigns based on specific criteria such as job title, industry, company size, and seniority level, ensuring your message reaches the right people.
Taylah Fuchshofer, Account Director, Young Folks
What Makes a Great LinkedIn Ads Report?
While each client is unique, a truly impactful LinkedIn analytics & reporting tool consistently hits on a few key points:
Executive Summary: Kick things off with a concise rundown of your group campaign and ad goals, strategies, and major outcomes.
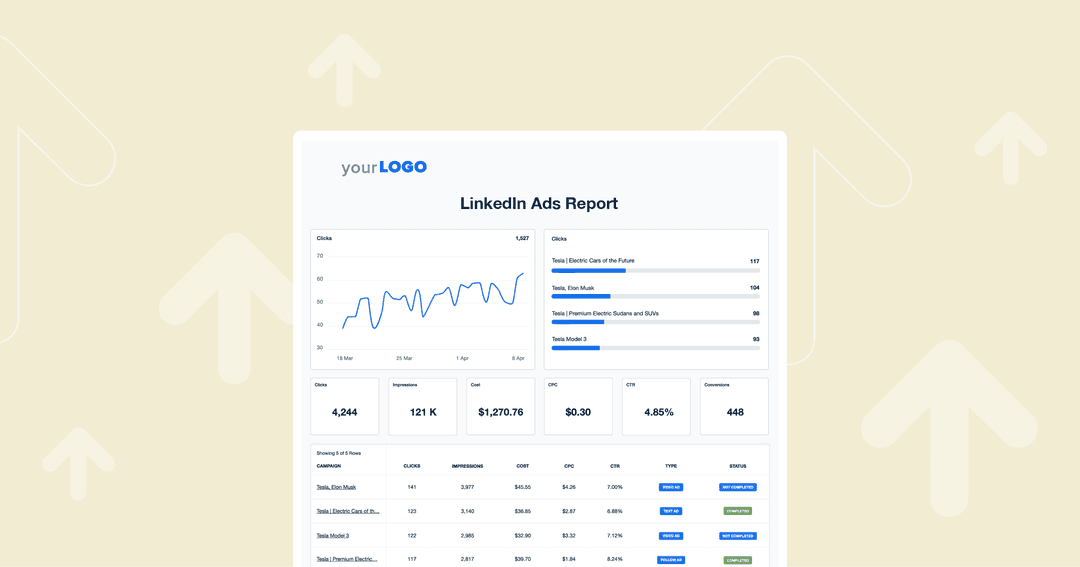
Performance Metrics: Dive into the data with essential metrics like impressions, clicks, CTR, conversion rate, CPC, and CPA. Tailor these metrics based on your client, their target audience, and the specific campaigns you’re running.
Campaign Highlights: Showcase the top performers—whether it’s ads, audience segments, or creative elements—the campaign group that really hit the mark.
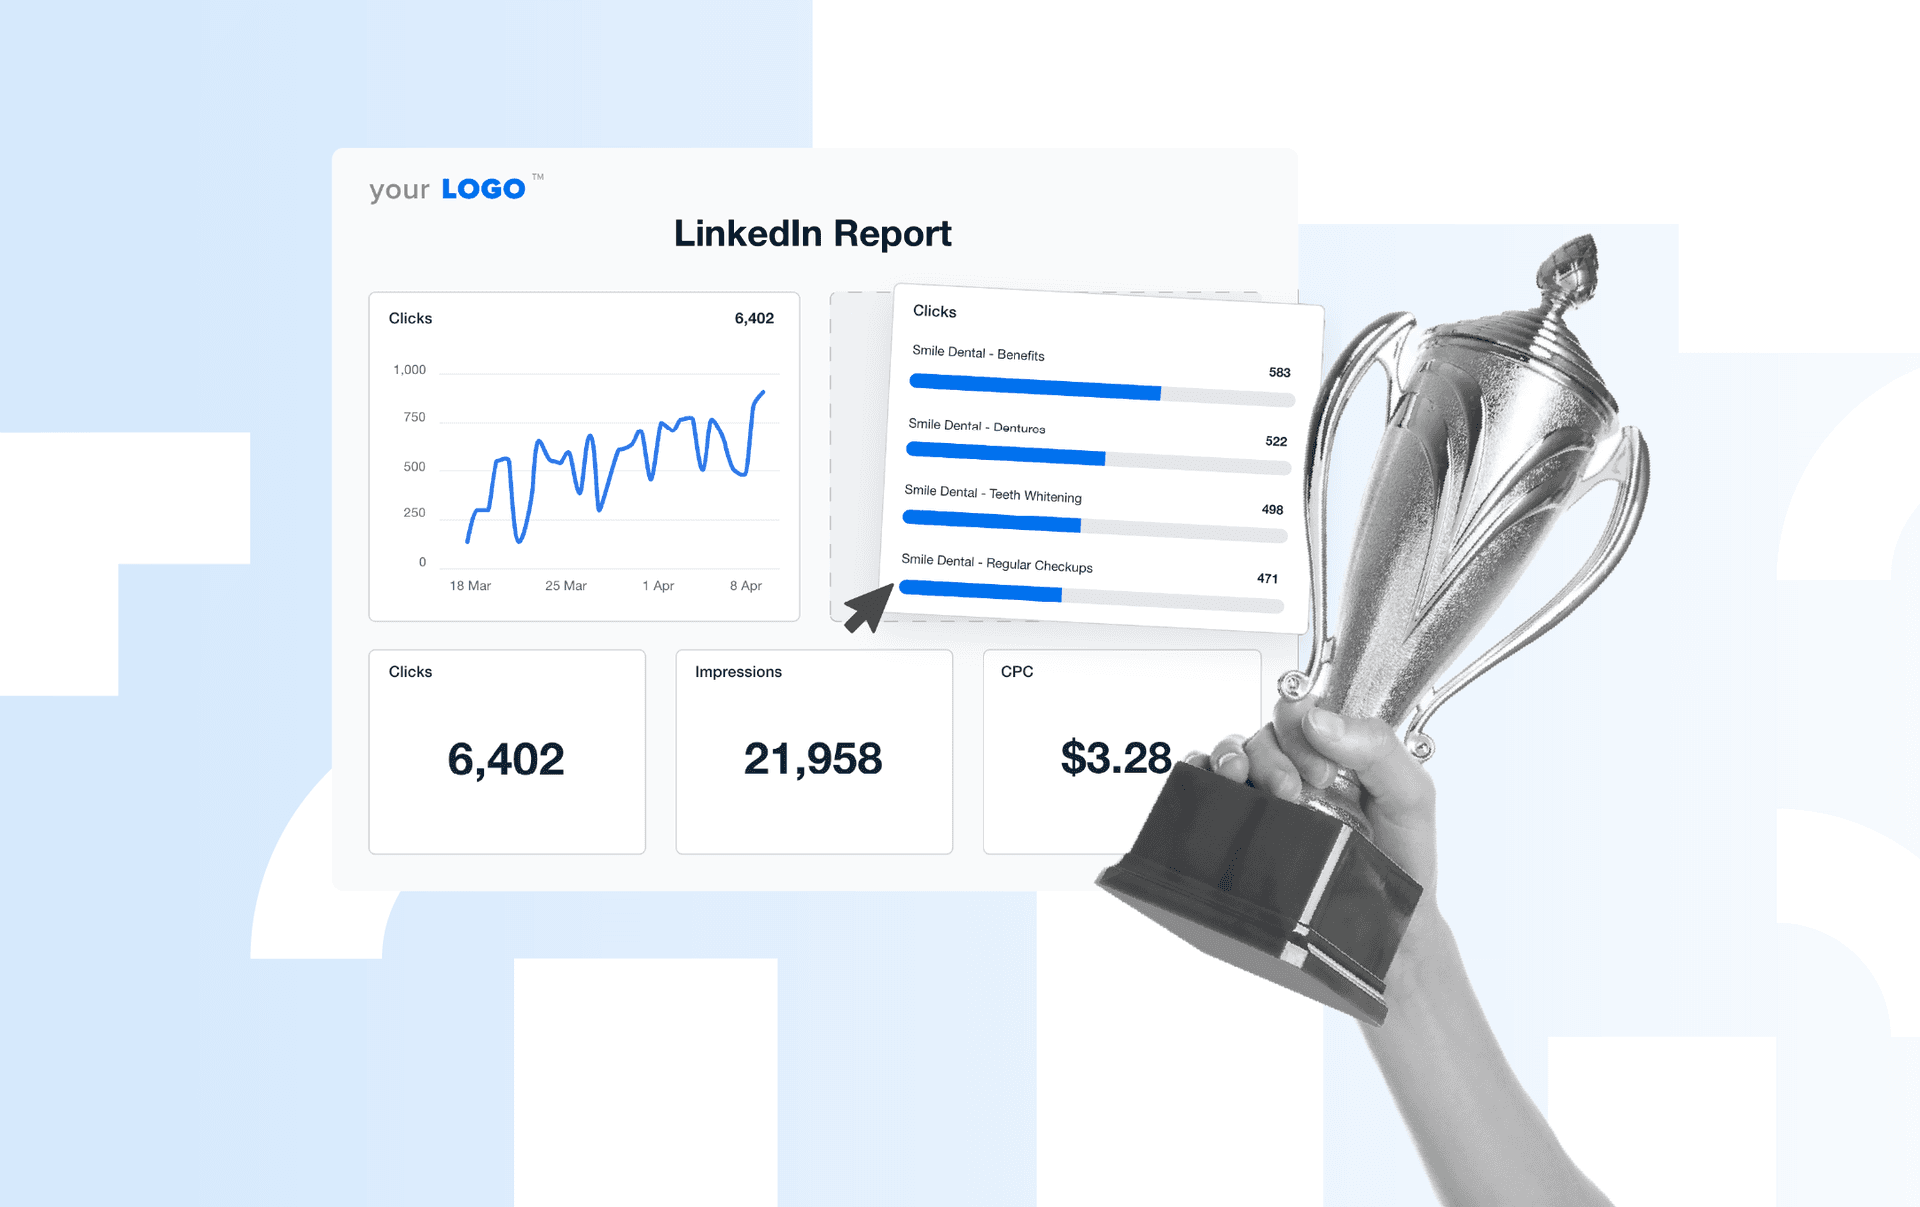
Data Visualization: Turn numbers into insights by using charts, graphs, and tables that make complex data easy to interpret at a glance.
Recommendations: Wrap it up with actionable tips and strategies to optimize future campaigns and drive even better results.
It's our job to tell a simple story through reporting to our clients. The report is the client’s proof that what we are doing is benefiting their business in a positive way.
Brian Ferritto, Partner, 42connect
For an in-depth overview of this platform, check out this detailed LinkedIn Ads guide.
Essential LinkedIn Ads Metrics to Track
You’ve got plenty of data points to choose from in your LinkedIn Ads reports, but the KPIs you choose to focus on should make sense according to your clients’ goals. Each metric in LinkedIn Ads offers a unique view of ad performance, making it crucial to know which ones matter most for your tracking.
To figure out which metrics to track, start by pinpointing your client's specific marketing goals. From there, it’s easy to zero in on the metrics that matter most.
Increase Brand Awareness: Impressions, Engagement Rate.
Encourage Consideration: Clicks, Click-Through Rate.
Drive Leads/Conversions: Conversion Rate, Cost per Conversion, Cost per Lead, Lead Gen Form Completion.
Let’s take a closer look at some of the metrics you’ll want to track to measure the network performance and demographics of LinkedIn Ads:
Cost per Mille (CPM): What you pay to get your client’s ad seen a thousand times.
Conversion Rate: The percentage of visitors who take action, like making a purchase.
Cost per Lead (CPL): How much it costs to snag a potential customer.
Leads Generated: The number of people interested in your product or service.
Ad/Campaign Spend: The total amount you've invested in an ad campaign.
Cost per Click (CPC): The coast each time someone clicks your client’s ad.
Conversions: Conversion tracking gives you insight into the total number of conversions by your LinkedIn audience network, like sign-ups or purchases.
Cost per Acquisition (CPA): The cost to turn a prospect into a paying customer.
Campaign Engagement: The total interactions with your client’s ad, including likes, comments, and shares.
Click-Through Rate (CTR): The percentage of people who clicked on your client’s ad after seeing it.
Impressions: The number of times your client’s ad was displayed, regardless of clicks.
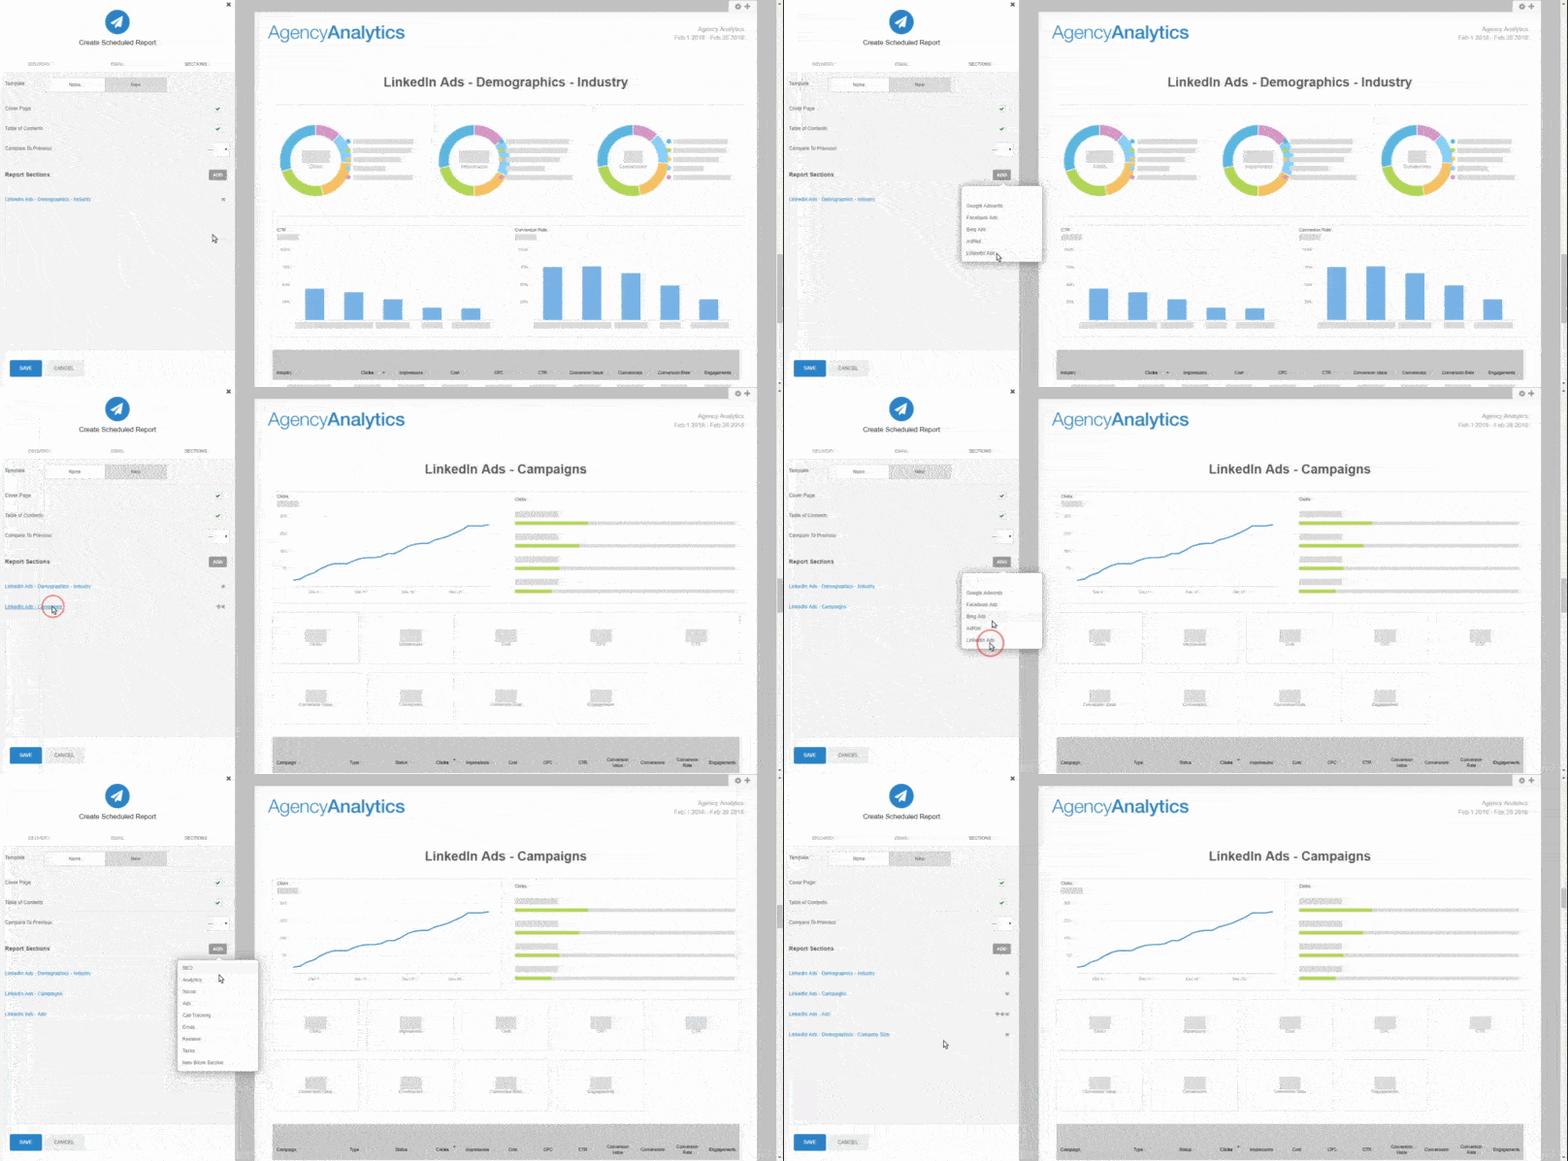
Create custom LinkedIn Ads reports in just a few clicks. Connect every platform where your client is running paid ads and monitor results from a single interface. Try AgencyAnalytics free for 14 days.
5 Common Challenges of LinkedIn Ads Reporting
The task of deciphering complex data along with the manual work of compiling the report in a way that’s accessible to clients can be a real time-suck.
We’ve put together this list of common challenges and how to tackle them to help you deliver standout LinkedIn Ads reports in no time.
Challenge | Description | Solution |
|---|---|---|
Clicks and Impressions | While these metrics indicate how often ads are viewed and clicked on, they don't reveal the quality of traffic or ad effectiveness. | Align ads with keywords, landing pages, and account campaign group goals. Use negative keywords to filter out irrelevant or low-intent queries, ensuring clicks are from interested and relevant audiences. |
Conversions and Attribution | Metrics showing how ads contribute to business objectives like sales or sign-ups are often tricky to measure accurately, especially with multiple channels and touchpoints. | Define conversion actions and values, track across platforms and devices, and use a holistic attribution model to reflect customer behavior. This ensures a comprehensive view of how different interactions contribute to conversions. |
Quality Score and Ad Rank | Quality score and ad rank indicate ad relevance and competitiveness, but these metrics are variable and context-dependent. | Regularly monitor and improve quality score and ad rank by optimizing keywords, ads, and landing pages. Adjust bids and budgets to stay competitive in the ad auction. |
ROAS and CPA measure campaign profitability and efficiency but can be unreliable due to industry, product, or seasonal variations. | Set realistic target ROAS and CPA based on business goals and margins. Use smart bidding strategies and optimization tools to achieve these targets, ensuring your ads generate sufficient revenue and cover expenses. | |
Data Discrepancies and Delays | Errors and delays occur when data sources don't match or update in a timely fashion, leading to inconsistent reports. | Regularly verify and reconcile data sources using consistent tracking codes, parameters, and definitions. Check for errors or anomalies in data collection and reporting systems to ensure accuracy and timeliness. |
By addressing these challenges, you’ll ensure that your agency is providing accurate, meaningful insights that drive better decision-making and boost campaign performance.
We leverage campaign data identifying opportunities and monitoring return on investment. Once we have collected enough data, we set a target Return on Ad Spend (ROAS) and adjust this accordingly. With this approach there is no limit to a PPC budget as long as the target ROAS can be maintained.
Tim Husband, Co-founder, Blue Flamingo Solutions
10 Best Practices for Building LinkedIn Ads Reports
1. Establish KPIs and Goals Upfront: Define specific campaign and ad-level performance objectives and align metrics to the campaign groups’ goals.
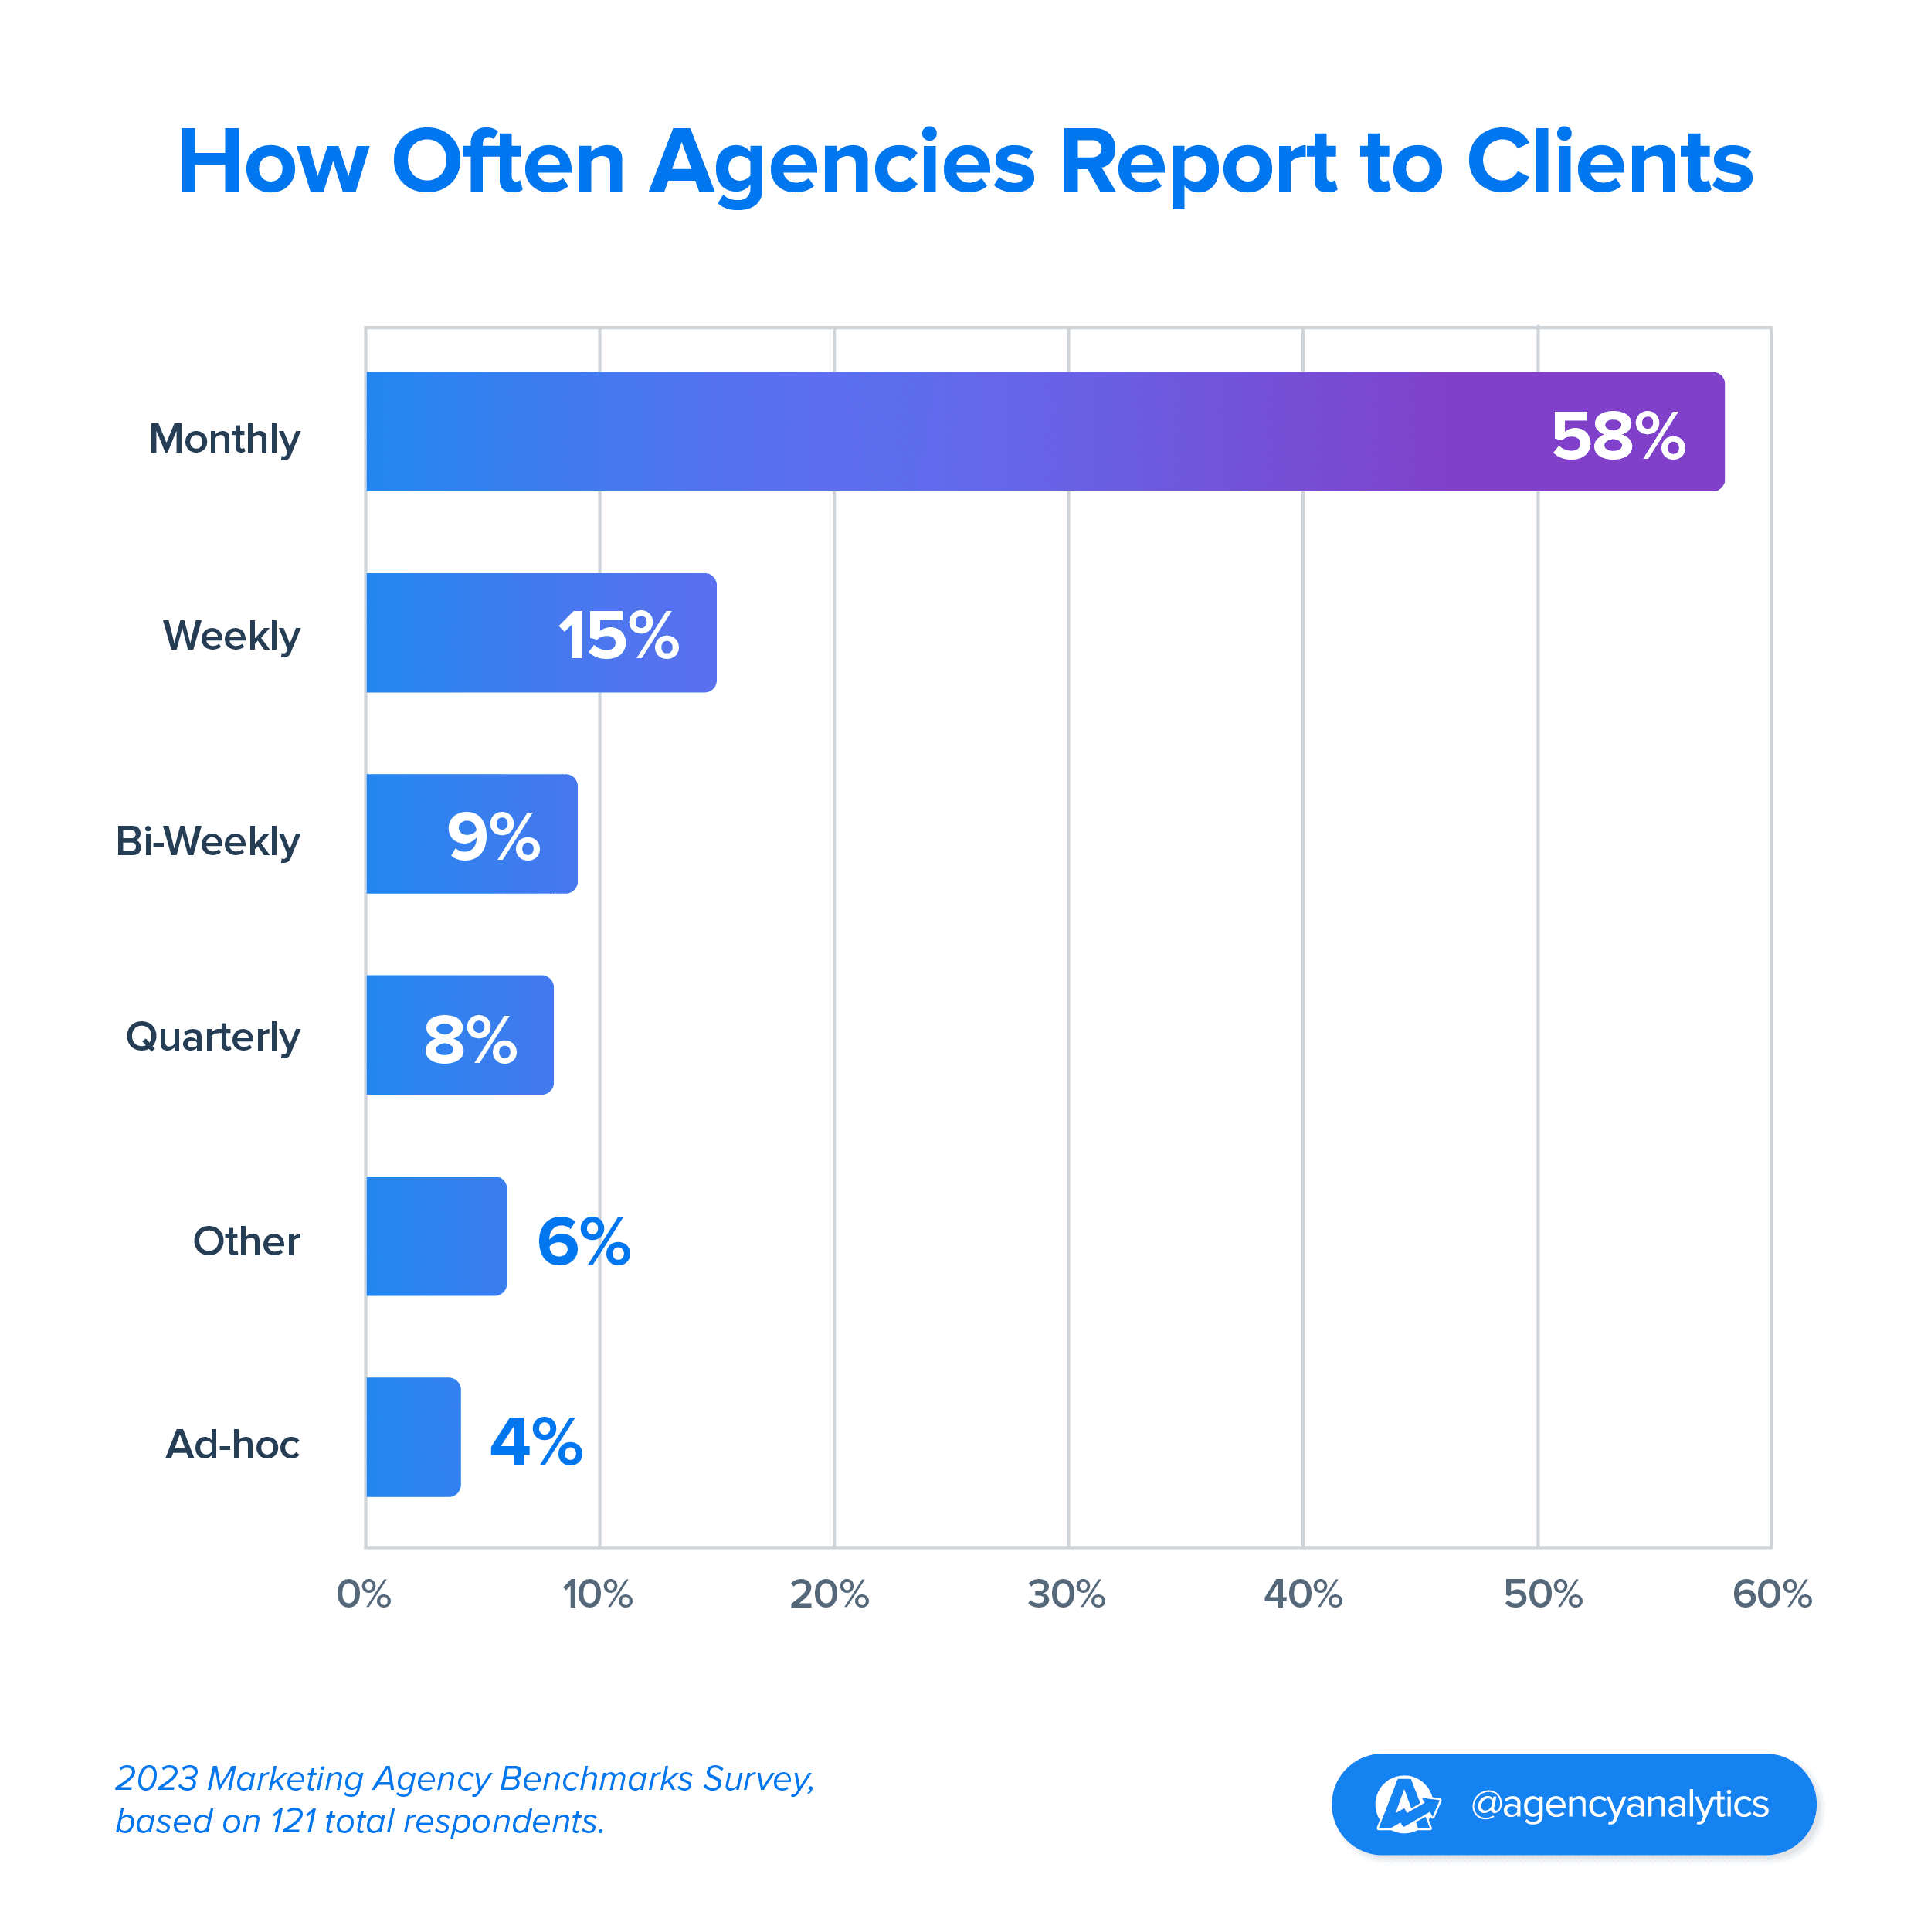
2. Choose a Consistent Reporting Frequency: Implement a regular reporting schedule (weekly, monthly) to track performance and adjust as needed. According to the AgencyAnalytics Marketing Agency Benchmarks Survey, the majority of agencies report on a monthly basis.
3. Custom-Build Your LinkedIn Reporting Template: Creating a LinkedIn Ads report template speeds up the process, maintains consistency, and delivers a polished, branded dashboard that groups campaigns and ads, summarizing the performance of ads and marketing tactics in a way that any campaign manager can appreciate.
4. Leverage Real-Time Data: Keep your clients in the loop with live metrics, paired with historical data for context.
5. Customize Your Reports With White Label Features: Customize reports with your clients’ logos and colors to reinforce their brand.
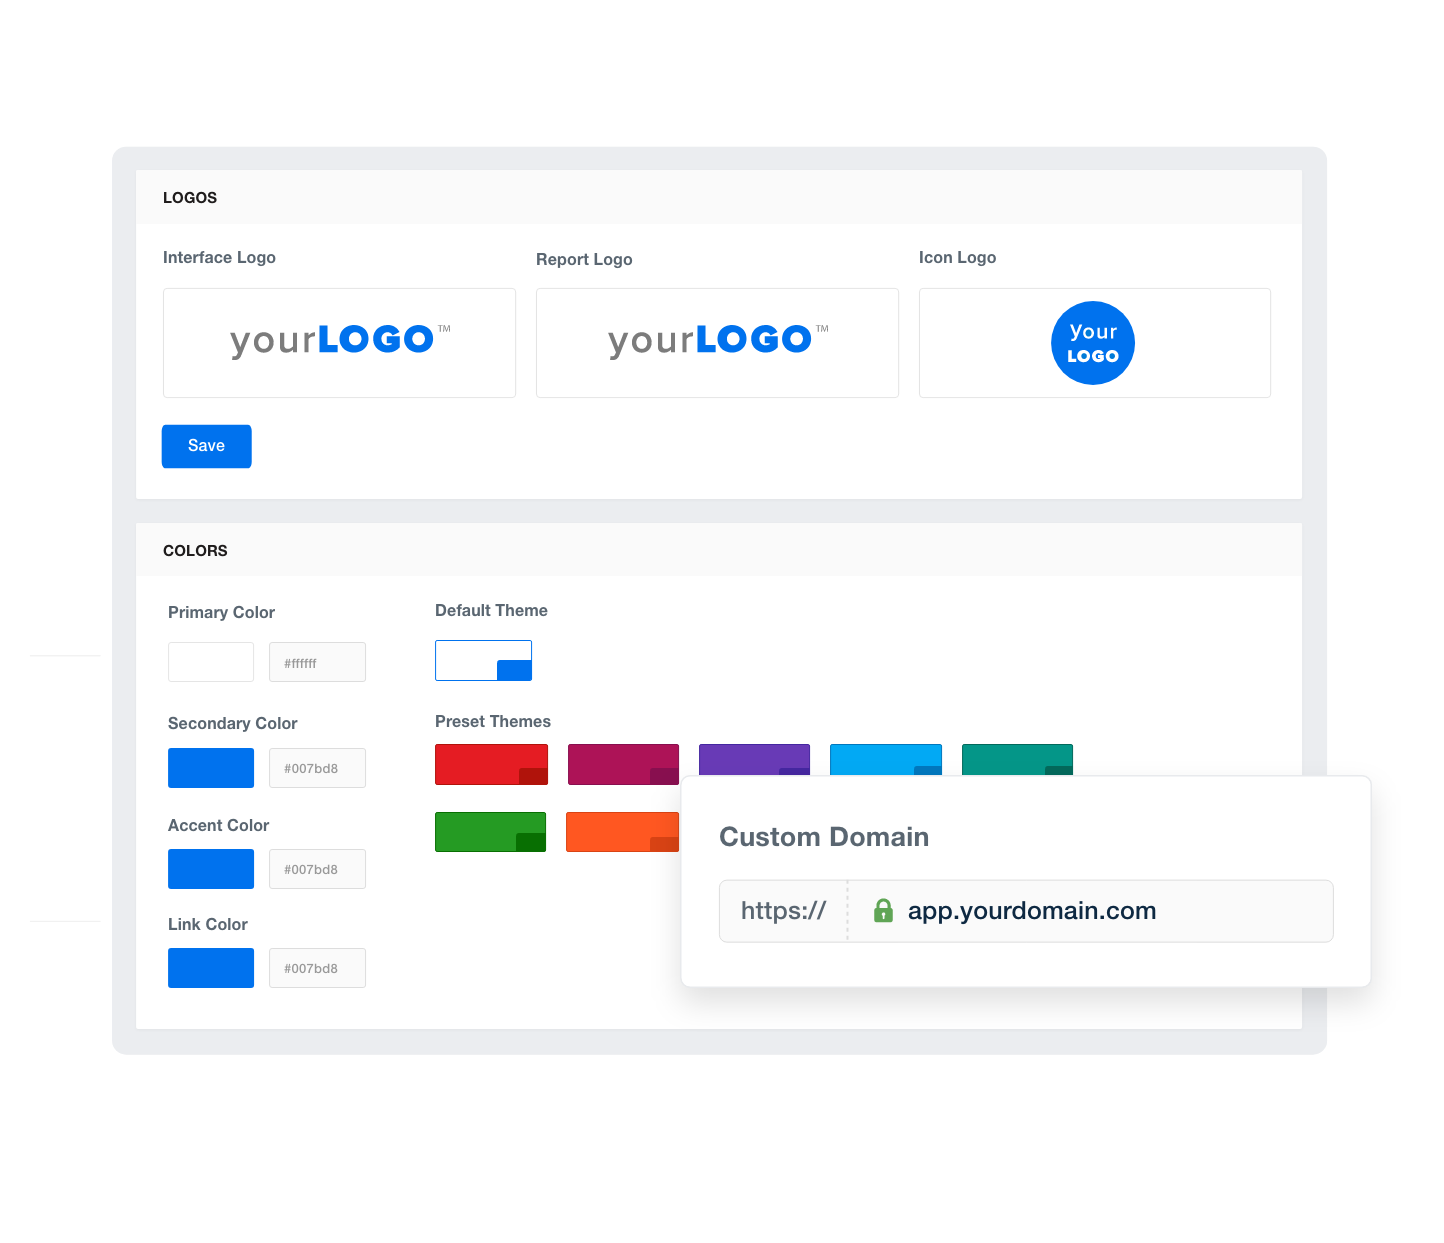
AgencyAnalytics’ suite of white label features including customizable widgets and the drag-and-drop report builder allows you to tailor your client reports with logos and brand colors. Try it free for 14 days.
6. Monitor the Right Metrics: Regularly track key performance indicators (KPIs) like CTR, CPC, and conversion rate.
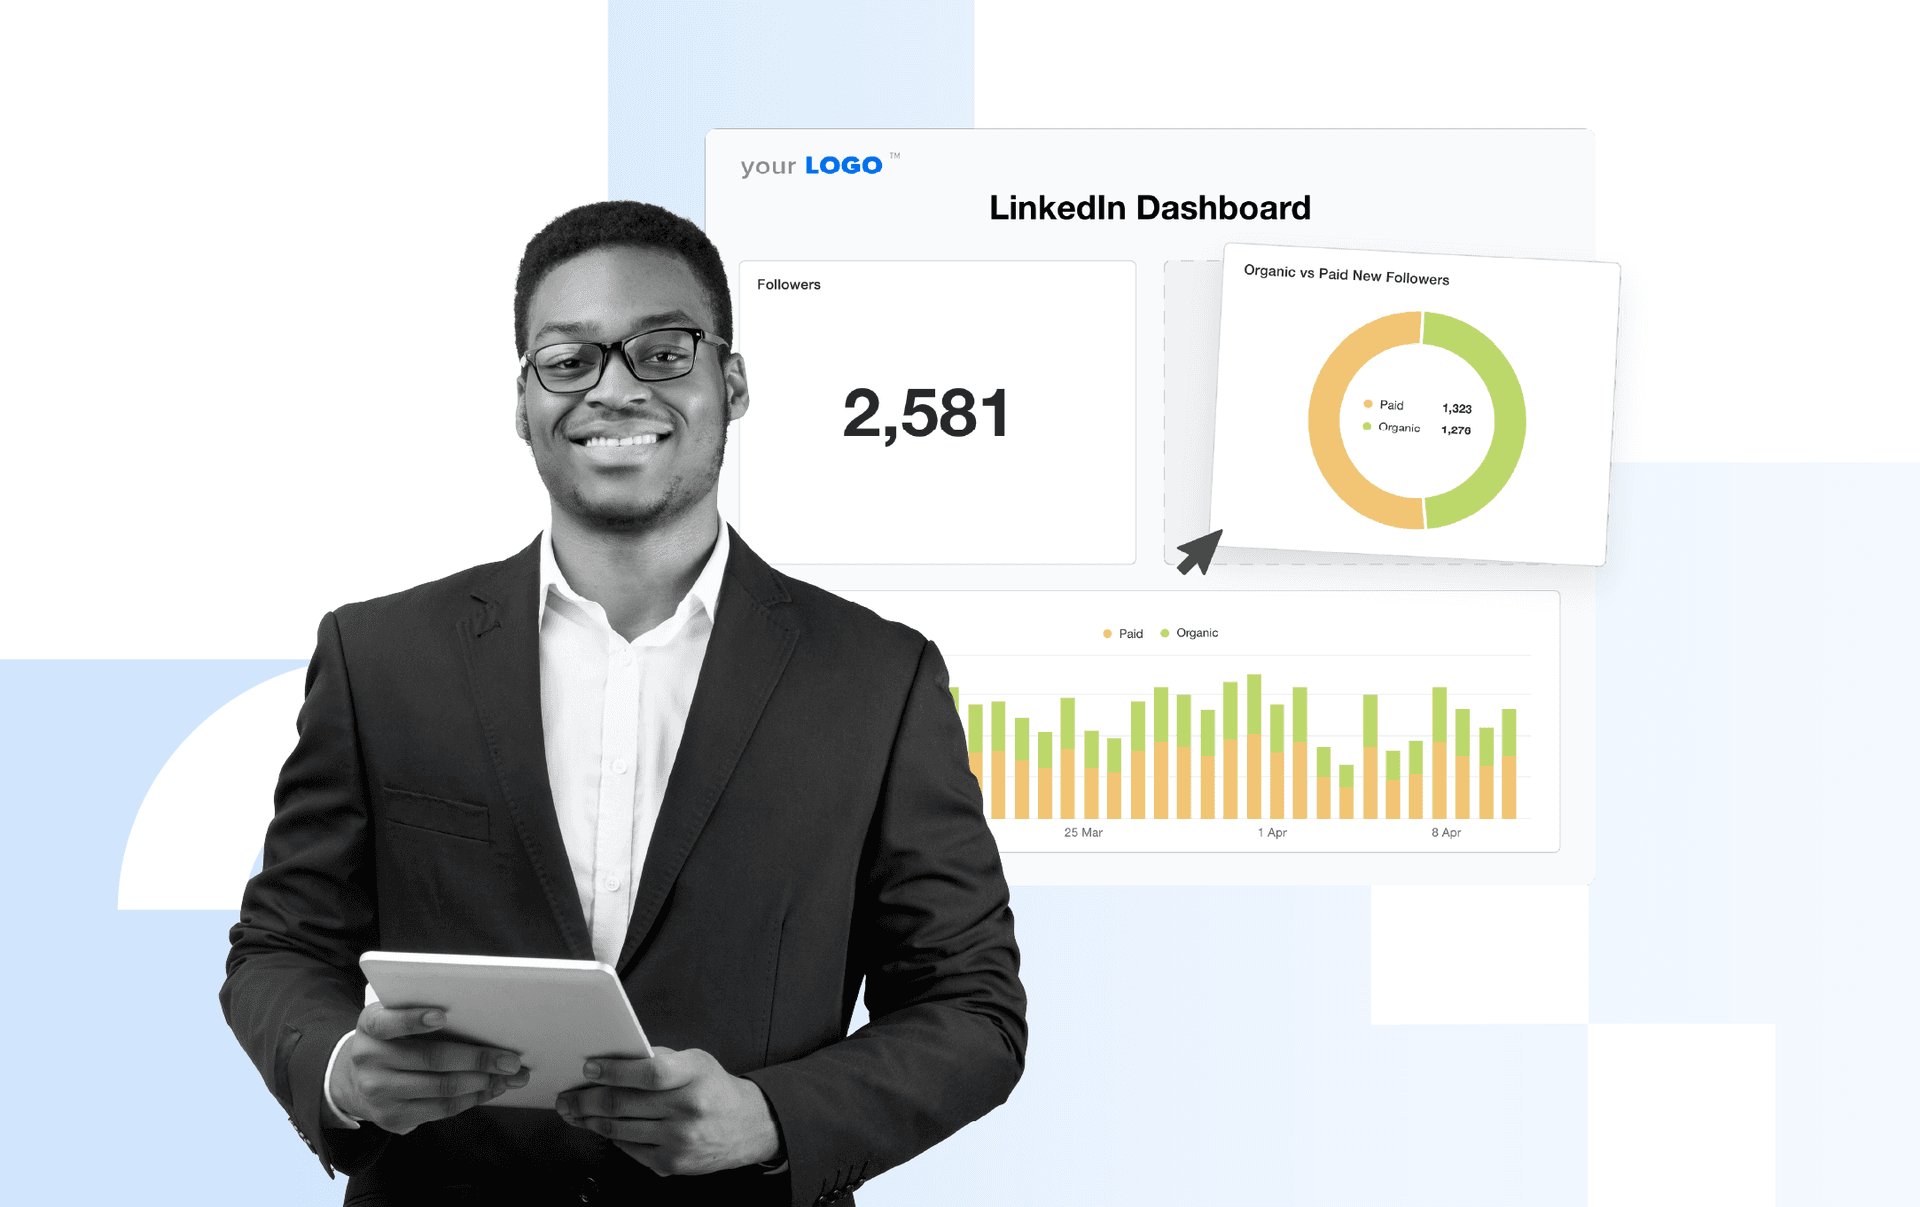
7. Data Visualization: Use visuals to make complex data easy to understand and impactful. Go even further by granting clients access to the LinkedIn reporting dashboard summarizing the performance. Provide the option to download reports, and demonstrate how they can go about exporting a report from Campaign Manager.
8. Dive Deeper for Advanced Optimization: Use detailed analytics to refine targeting, improve ad creativity, and allocate budget more effectively.
9. Add Goals and Annotations to Provide Additional Insight: Personalize each custom dashboard and report with annotations and goals along with your expert insights and recommendations.
10. Remain Agile and Make Adjustments As Needed: Continuously assess performance data, adapting your strategy to maximize ROI and respond swiftly to changes in campaign dynamics.
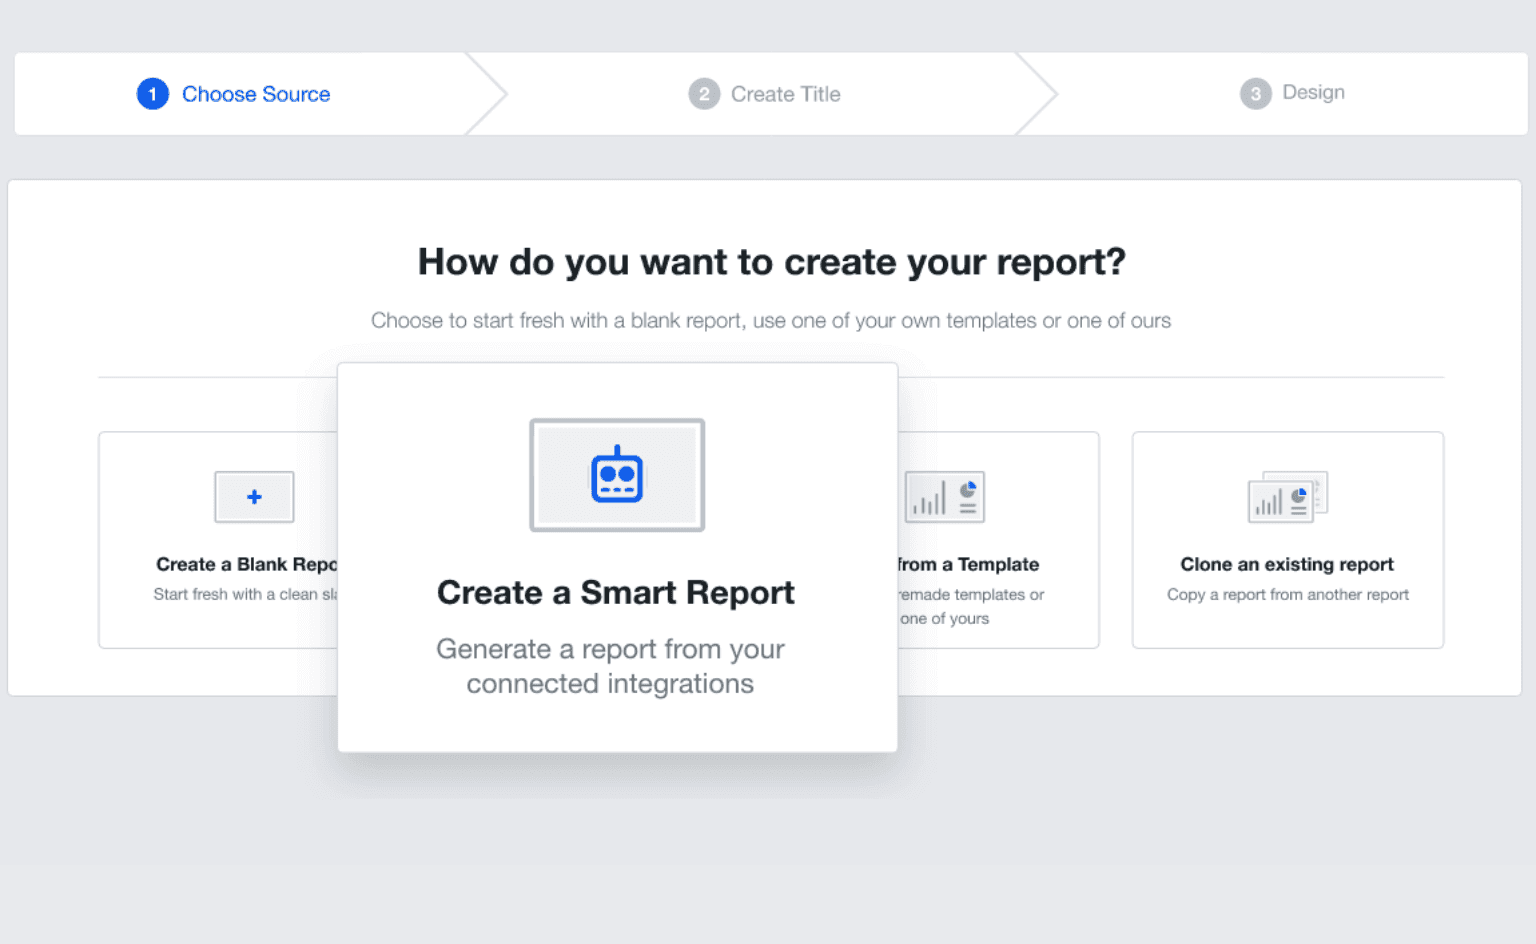
Create custom LinkedIn Ads reports in just a few clicks. Connect every platform where your client is running paid ads and monitor results from a single interface. Try AgencyAnalytics free for 14 days.
Revolutionize Your LinkedIn Ads Reporting With AgencyAnalytics
LinkedIn Ads reporting is a powerful tool for showcasing the impact of your efforts and building stronger client relationships.
With a precise and comprehensive reporting dashboard summarizing the results, you don’t just prove ROI—you transform raw data into compelling narratives that demonstrate your agency's value, and deliver actionable insights that drive smarter decisions to optimize campaign and ad performance.
Unlock the full potential of your LinkedIn Ads reporting with AgencyAnalytics: Streamline your process, save time, and deliver stunning, multi-channel insights—start your free 14-day trial today!

Written by
Anya Leibovitch is a B2B SaaS content marketing specialist. She partners with tech companies to design and execute their content marketing strategy. A writer first and foremost, she harnesses the power of storytelling to build and strengthen relationships between companies and the clients they serve.
Read more posts by Anya LeibovitchSee how 7,000+ marketing agencies help clients win
Free 14-day trial. No credit card required.


