FEATURE ALERT: Ask AI to turn client data into actionable insights.

TikTok Dashboard

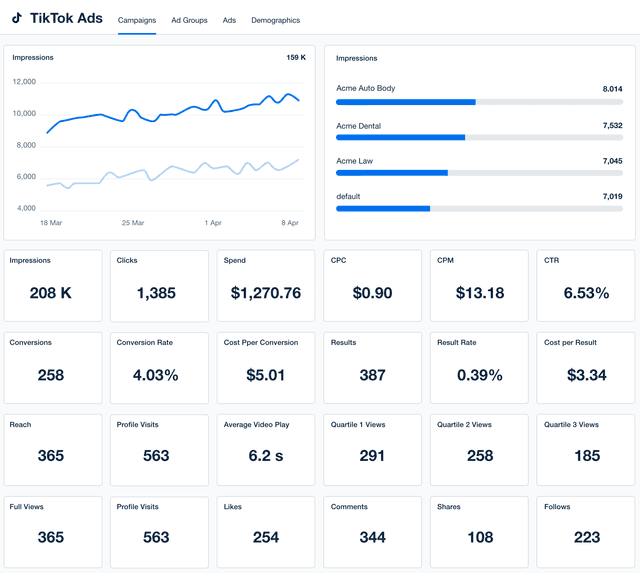
Streamline data management with a live TikTok dashboard. Monitor real-time performance, make optimizations as needed, and achieve campaign success. Create custom user profiles to maintain privacy and keep data transparency on the table. Ensure clients will have on-demand access to their data whenever they choose. Invest in a robust reporting solution and streamline your workflow.
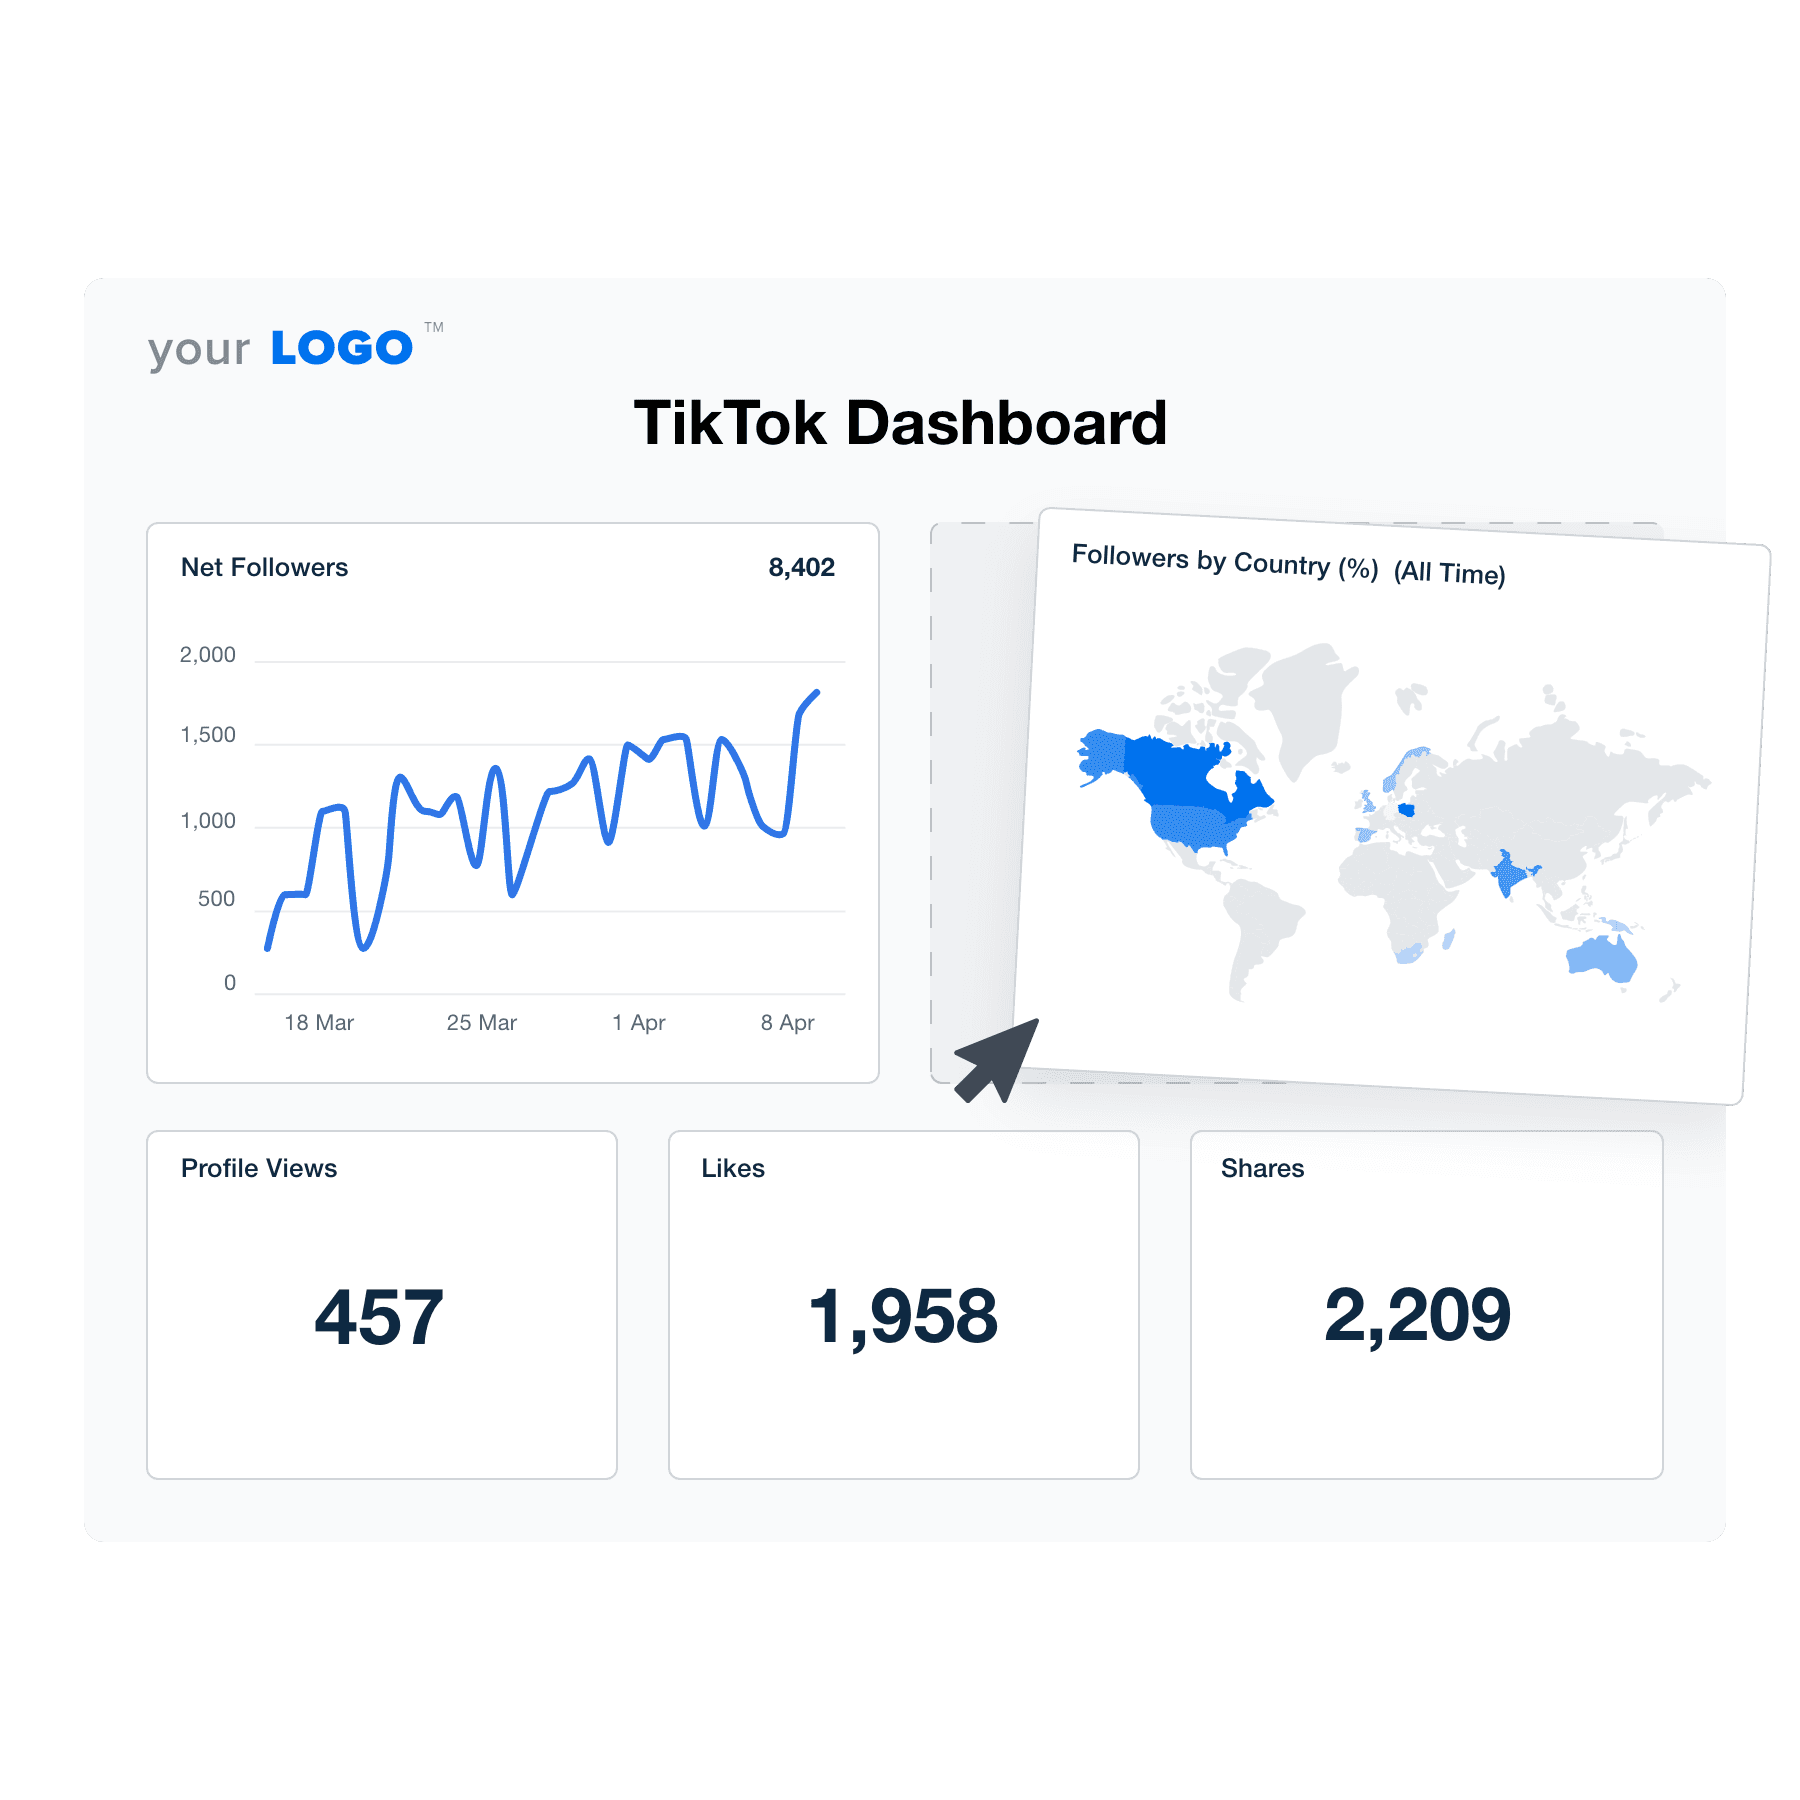
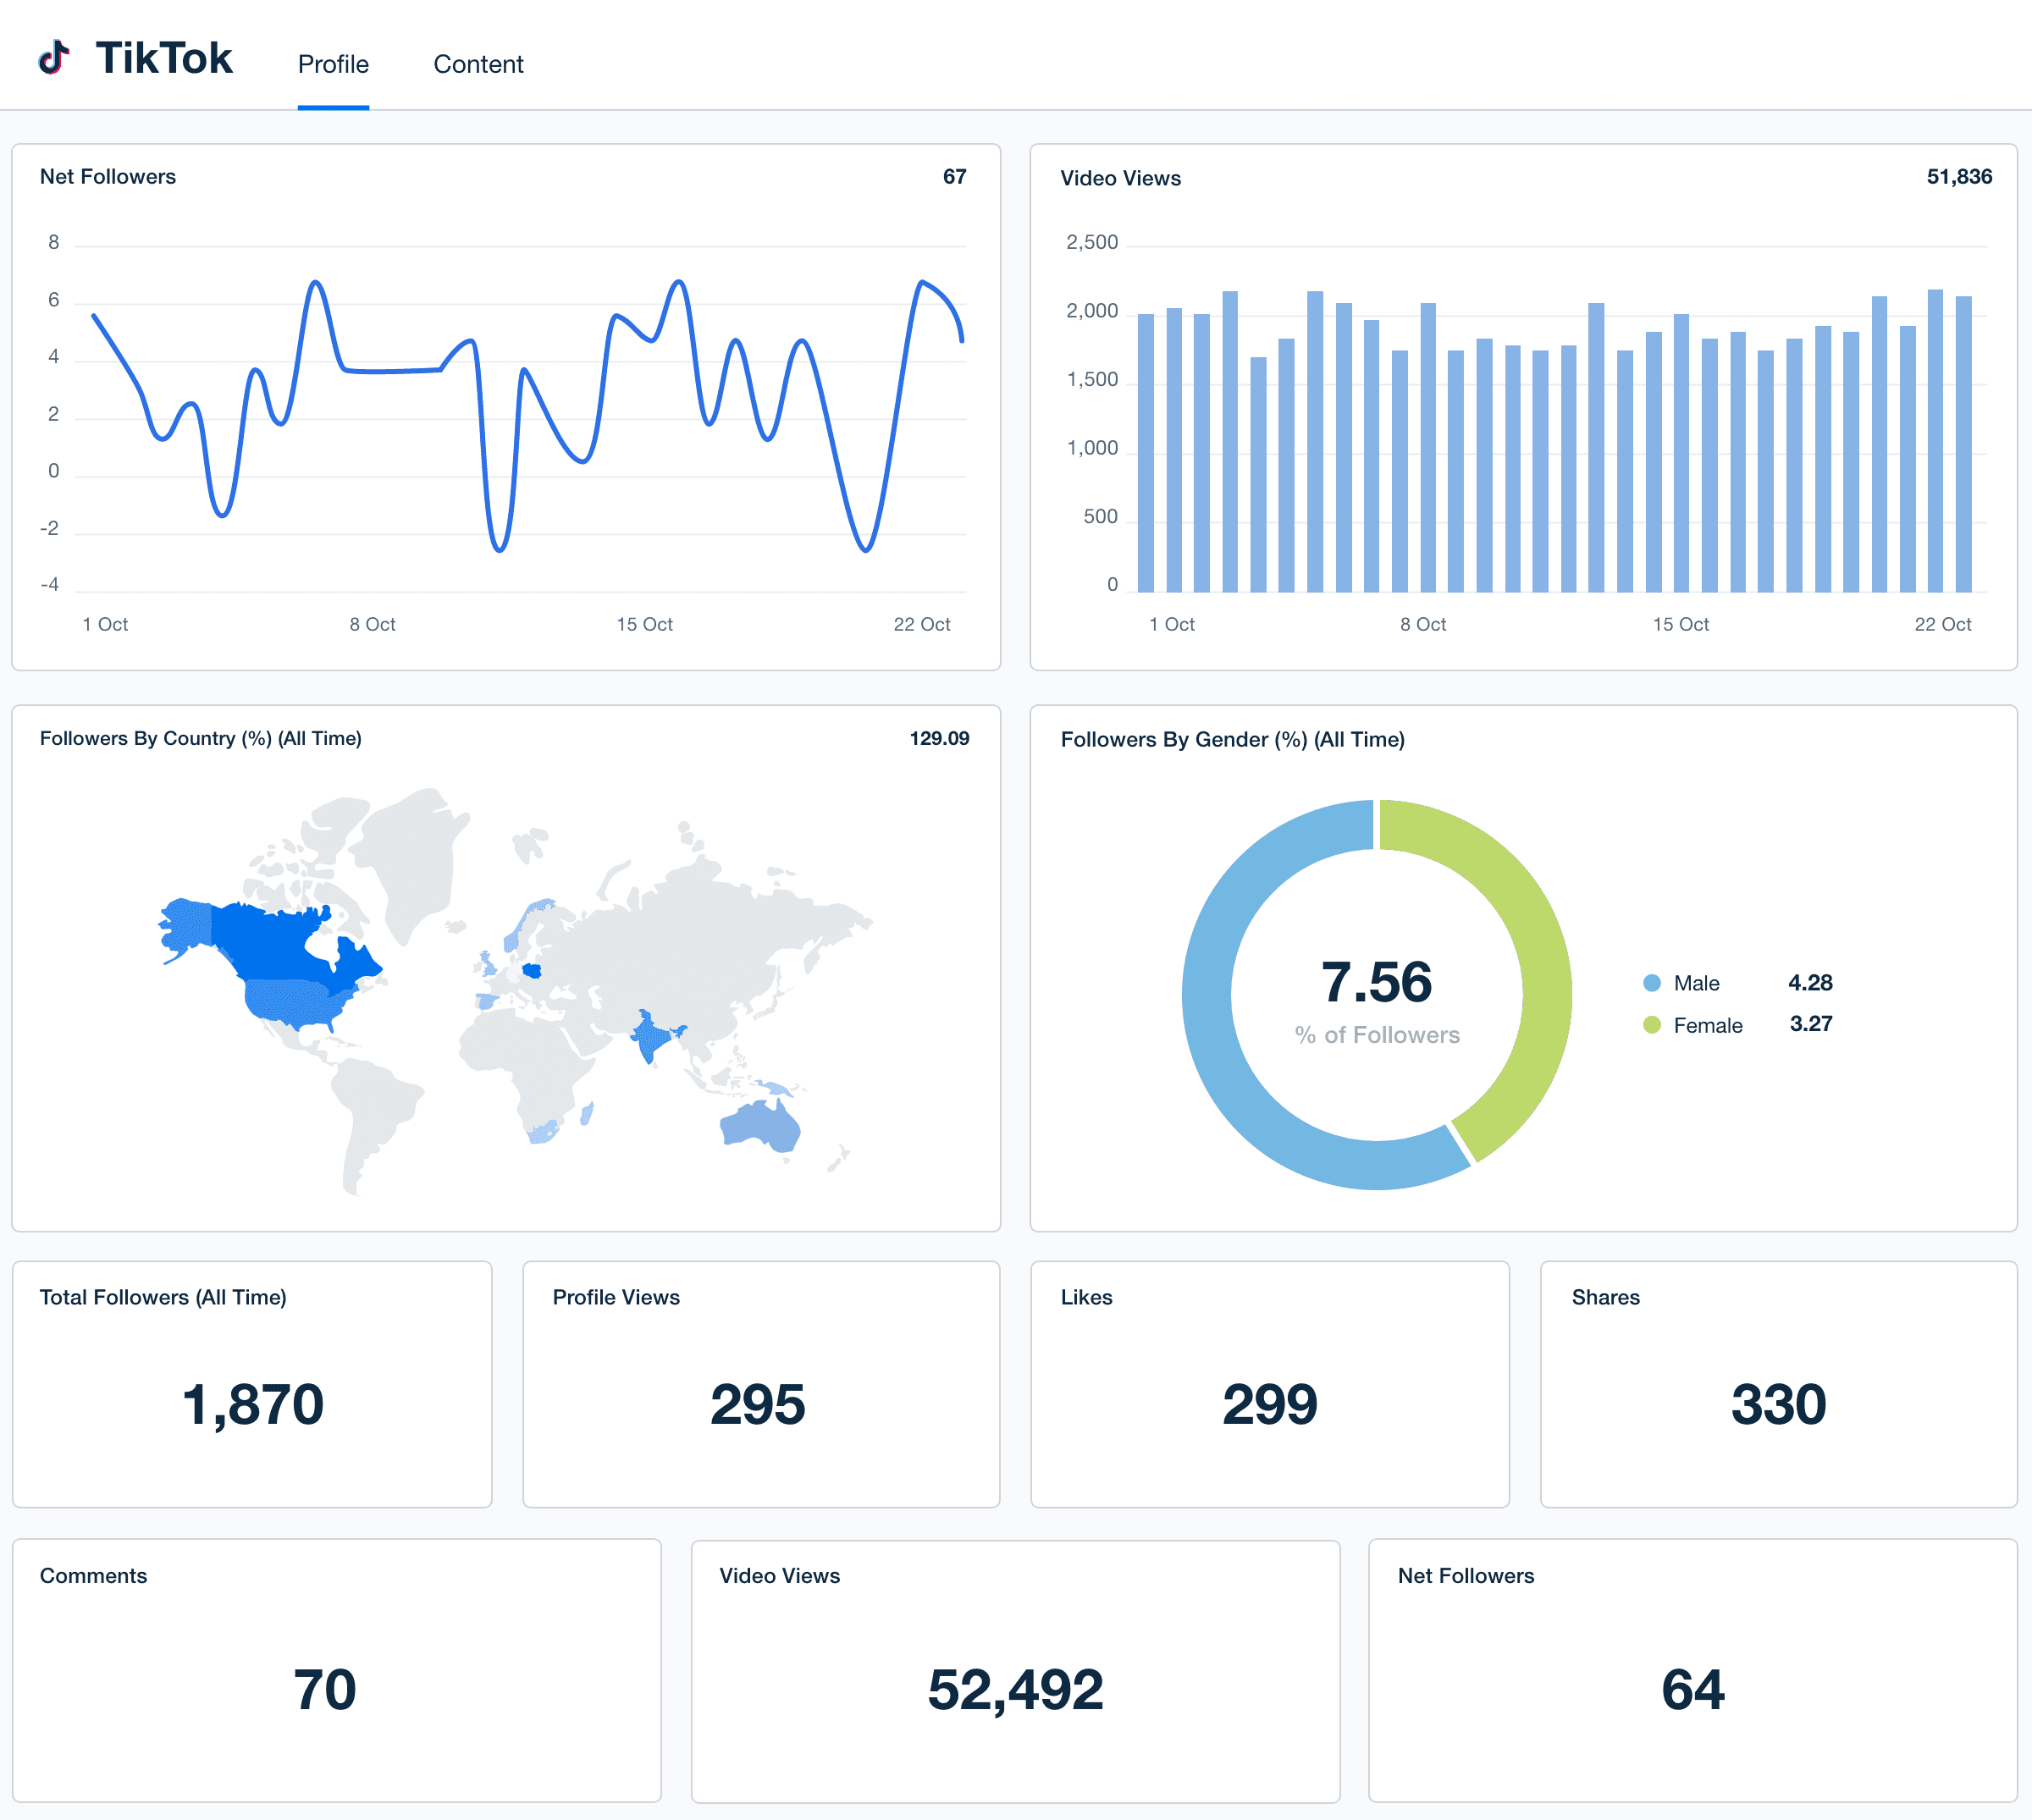
Tiktok dashboard template example

What Is a TikTok Dashboard?

A white label TikTok Dashboard is a customizable reporting tool designed to track and visually present metrics. By using the white label feature, it becomes more than a data-tracking system. It’s a way to create a branding touchpoint, set a high standard, and deliver a seamless reporting experience.

Quickly monitor video views, follower count, and other TikTok analytics–all without manual data collection. With all these insights in one place, it’s much easier to evaluate the success of TikTok strategies, analyze trends, and make informed recommendations.

In summary, a TikTok dashboard is more than a fancy interface. It’s a system that simplifies data management, enhances presentation, and provides valuable insights.

Why Your Agency Needs a TikTok Dashboard

Deliver precise, impactful data that clients care about most. A TikTok dashboard isn’t a one-size-fits-all tool, either. Customize widgets, toggle with data visualizations, and grant clients access to their live data–it’s all up to you.

Demonstrate professionalism and show attention to detail. In a few clicks, add your logo, custom brand colors, and some personalization. This simple touch sets a high standard, ensuring clients know what to expect when reviewing their data.

Client metrics aside, a TikTok dashboard removes the hassle of manual data collection. Instead of creating clunky spreadsheets or taking screenshots, your entire reporting process becomes streamlined. This frees up billable time for high-level activities and delivering results that matter.

Track real-time results, share data visualizations, and strengthen agency-client relationships with one tool. 

Create Professional TikTok Dashboards in Minutes
Start Your Free Trial Today

7 Sections To Include in a TikTok Dashboard
Organize dashboards into clear sections for maximum impact. Here’s a breakdown of key insights to include, which ensures clients will grasp key takeaways and understand their data. 

1. Video Views

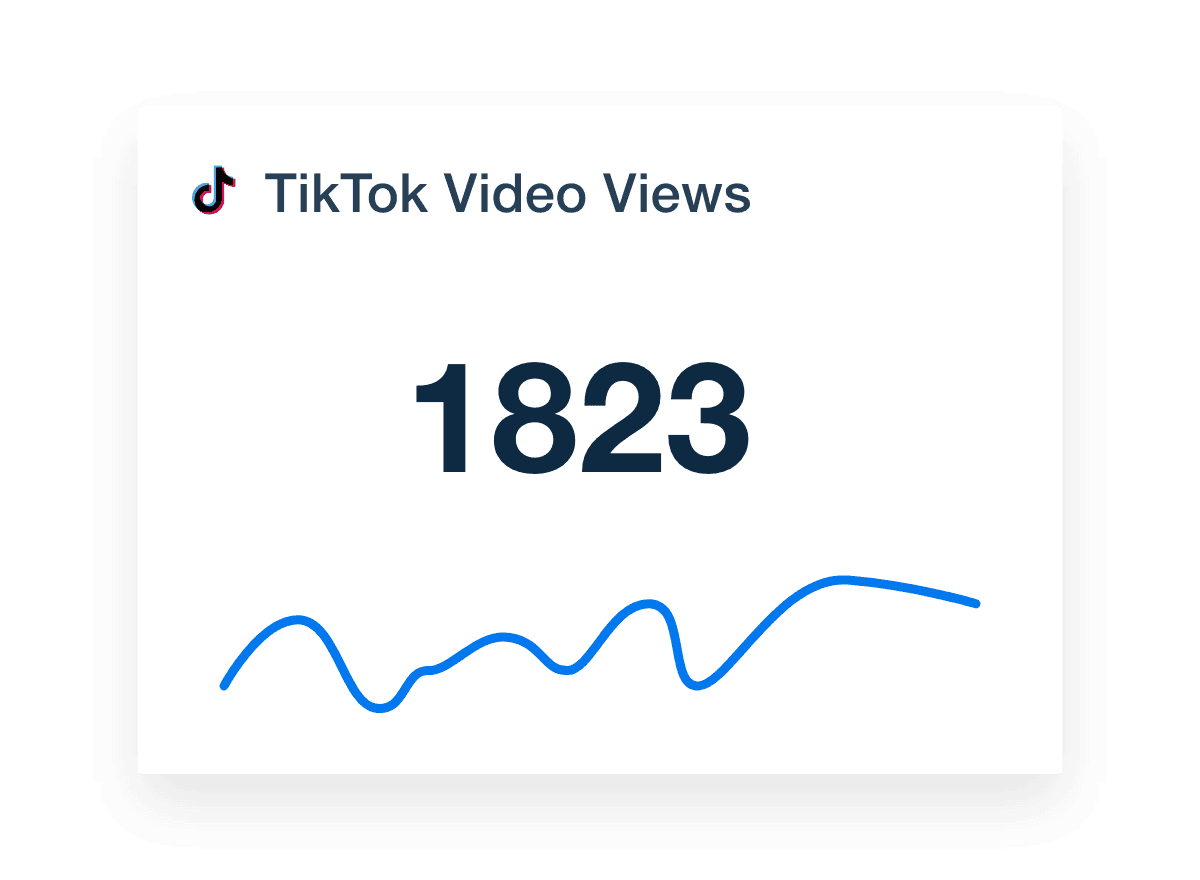
Video views are counted as soon as a TikTok video starts playing on a user’s screen. This metric helps agencies quantify the reach and appeal of a client’s content.

TikTok Video Views Metric Widget Example from the TikTok Report Template

A high number of video views means your client’s content is reaching many TikTok users, which could lead to more engagement. If views are low, try improving the thumbnail, adjusting the target audience, or posting at different times.

2. Total Followers

Total followers represent the number of TikTok users who have subscribed to your client's profile. This metric indicates audience interest and demonstrates your agency’s ability to build a solid audience base. 

Track and report on TikTok demographics metrics like Followers by Country and Gender.

A high follower count is a good sign; it shows that your client has a strong brand presence and engaging content. If this number is low or declining, consider creating more relevant videos, running targeted ads, or collaborating with relevant influencers.

3. Likes

Likes measure how many times TikTok users engage positively with a video by tapping the heart icon. In other words, it indicates how effectively your client’s content resonates with viewers.

TikTok dashboard metrics widget

If your client’s videos receive a significant number of likes, it suggests their content is hitting the mark. On the other hand, a low number may indicate adjustments are needed (e.g., experimenting with shorter video formats). 

Leave Manual Reporting Behind and Reclaim Billable Hours
Automate Your Client Reports and Focus on Delivering Results
Start Your 14-Day Free Trial

4. Shares

Shares track how often users forward your client’s TikTok video to others, which increases overall traction. Reporting on this metric demonstrates organic reach and the potential for some videos to go viral.

TikTok dashboard shares metrics

A high share count signals that your client’s content resonates in some way, encouraging viewers to spread the message. Alternatively, a low number could mean their videos aren’t entertaining or engaging enough. In this case, focus on emotive storytelling, creating a well-structured narrative, and eye-catching visuals. 

5. Average Time Watched

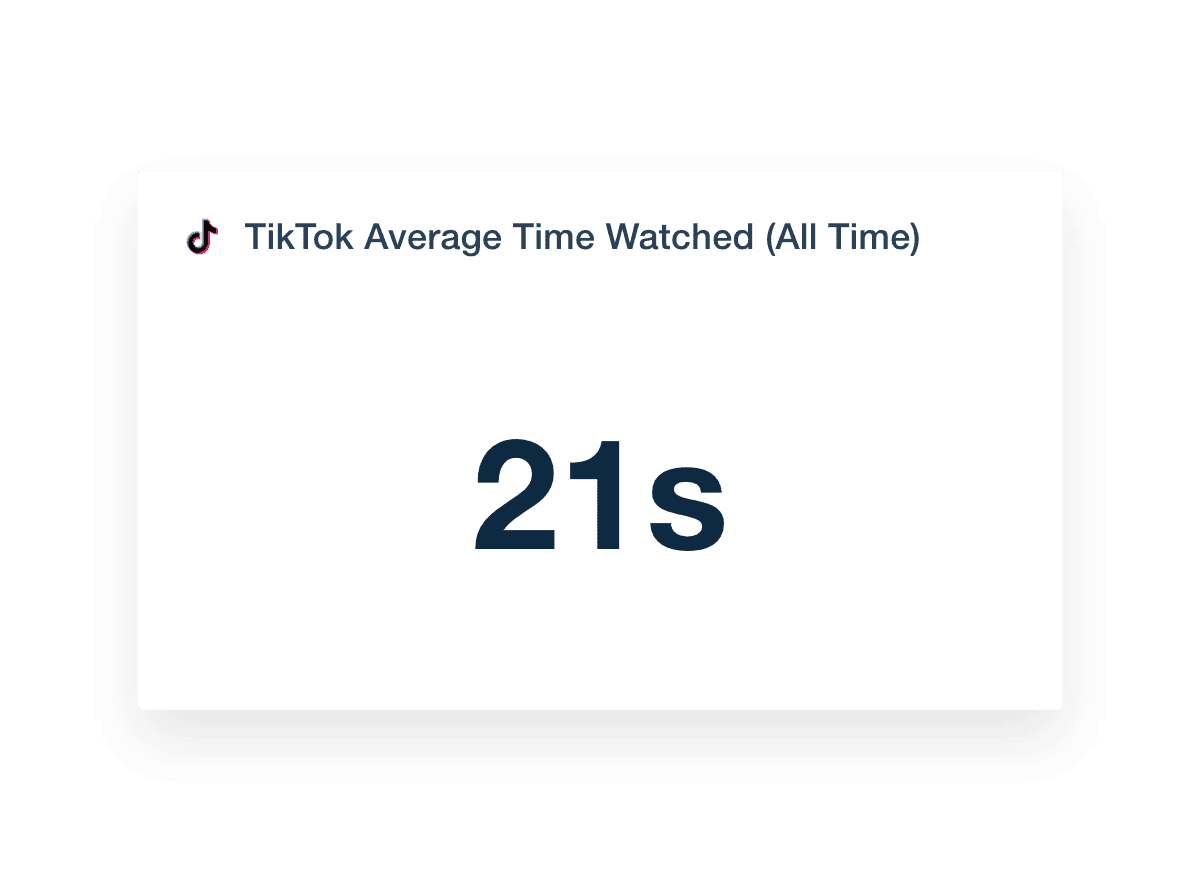
Average time watched measures the typical duration users spend watching a client’s TikTok video before exiting the app or scrolling ahead. Essentially, this metric shows whether your client’s videos effectively hold viewer attention.

TikTok Average Time Watched Stat Widget Example

Use this data point to pinpoint the most effective content formats and topic areas. To address a low average watch time, focus on incorporating hooks that encourage users to continue viewing.

6. Reach

Reach tracks the total number of unique users who see your client’s TikTok video, providing insight into content visibility and audience size.

TikTok reach metrics widget on reporting dashboard

A high reach suggests that content is successfully breaking out beyond followers and gaining traction with new viewers. On the other hand, low reach may mean targeting adjustments are needed (e.g., focusing on a broader audience).

7. Goal Tracking

A key part of reporting is monitoring progress. That’s where dynamic goal tracking comes in–use it to assess marketing performance, optimize campaigns, and share real-time insights. 

This feature adds an extra layer of transparency, highlights tangible results, and builds trust. It also helps clients understand whether their targets are on track, ensuring they’re equipped to make projections and plan ahead.

TikTok dashboard goal tracking example

Setting relevant goals is essential for aligning your efforts with client expectations. To get the  most from this exercise, be sure to:

  • Focus on metrics that are tied directly to business objectives.

  • Set KPIs that reflect both short-term wins and long-term growth.

  • Ensure KPIs are specific to each client’s unique needs and industry.

See the TikTok Dashboard Template in Action
Use This Template To Create Custom Dashboards in Minutes
View Template Demo

Streamline Reporting With TikTok Dashboards and Focus on What Matters

Why spend countless hours piecing together data?

With a professional TikTok dashboard, there’s no need to–easily consolidate metrics across TikTok and 80+ platforms with minimal effort. That way, you’ll have more time to focus on what matters: Building top-notch campaigns and delivering solid results.

It’s not a generic solution, either. With the intuitive drag-and-drop builder, it’s easy to move widgets around, choose different visualizations, and adjust formatting as needed. Present dashboards that are both aesthetically pleasing and data-rich–it’s really that simple.

Custom Dashboards TikTok

What if there was a way to up your efficiency even more? Guess what–there is! 

With the Smart Dashboard feature, your client’s unique metrics auto-populate into a professional and well-formatted interface in just a few seconds. The best part? It’s fully customizable, which means you can make tweaks and align this dashboard with your agency’s vision. 

Maximize your billable time, cut down on manual work, and focus on nurturing client relationships–that’s the power of investing in AgencyAnalytics.

Gorgeous interface. Simple, elegant, without sacrificing features. And SO MANY features. Plus, integrated marketing. Now we have a single platform to manage and report SEO, SEM, and Social Media.

Pete Nowicki
Pete Nowicki
Flylight Media, Inc.
Save Time on Reports and Gain More Time for Strategy
Automate Client Reporting and Free Up Hours Every Month
Start Your 14-Day Free Trial

Custom TikTok Dashboards as Unique as Your Agency

Track the Data That Matters

Instantly Access All Your Clients’ TikTok Data

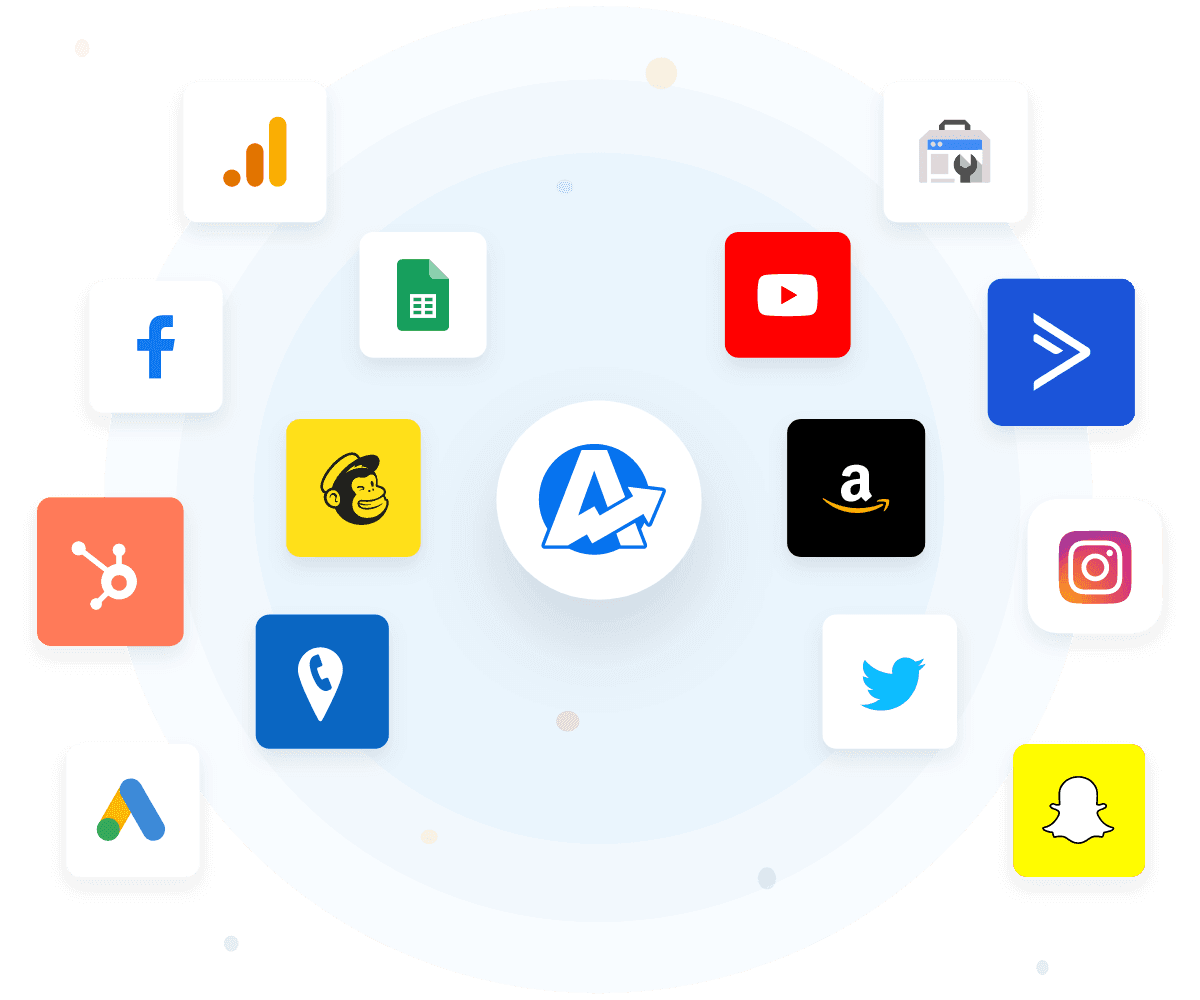
Client reporting doesn’t have to be a headache. Let AgencyAnalytics do the heavy lifting for you! Consolidate insights from 80+ platforms, including TikTok, Facebook, and more. 

No need to juggle multiple tools. This tool makes it easy to track performance, identify trends, and make data-driven decisions.

An example of the available marketing platform integrations AgencyAnalytics offers to connect your clients' marketing data
Add A Personal Touch

White Label Your TikTok Dashboards

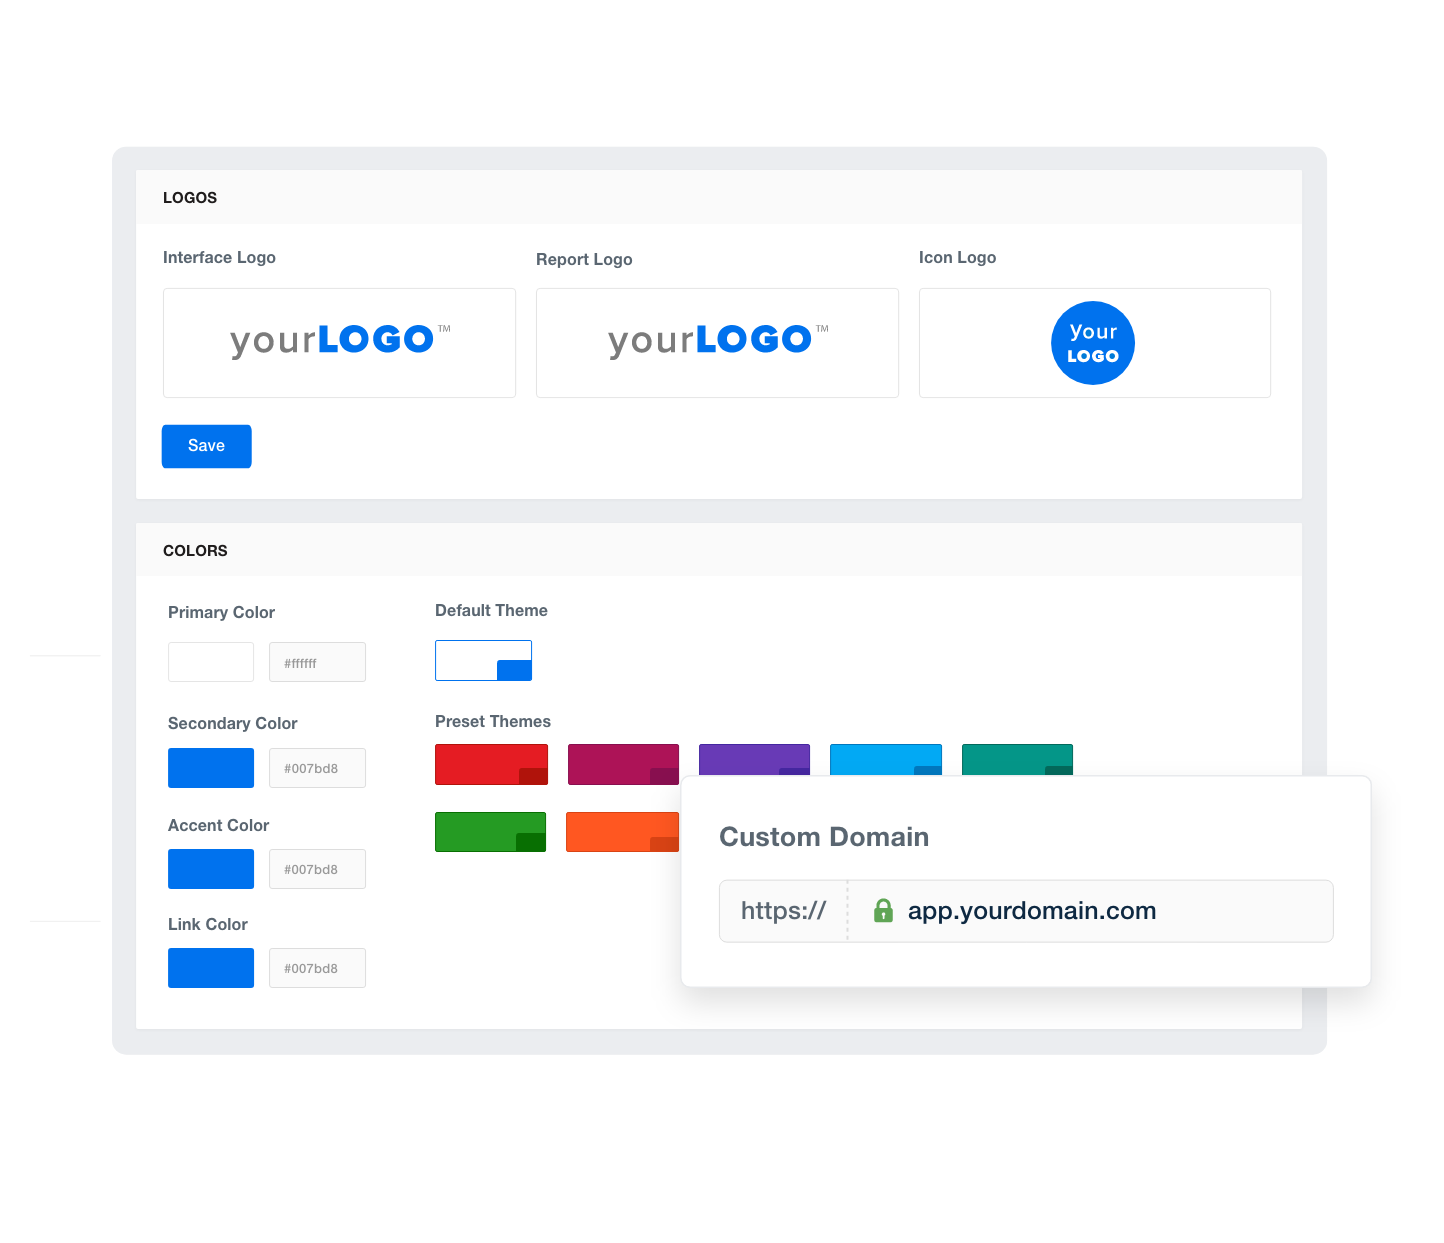
Elevate your agency's brand through white labeling. Deliver insights in a way that's uniquely yours, complete with your logo, colors, and custom domain. 

Create a reporting experience that reinforces your agency's expertise. Demonstrate your attention to detail and build client trust in the process.

Add Your Own Branding To Your Customizable SEO Reporting Software
Tailored Data Points

Provide Granular Insights With Custom Metrics

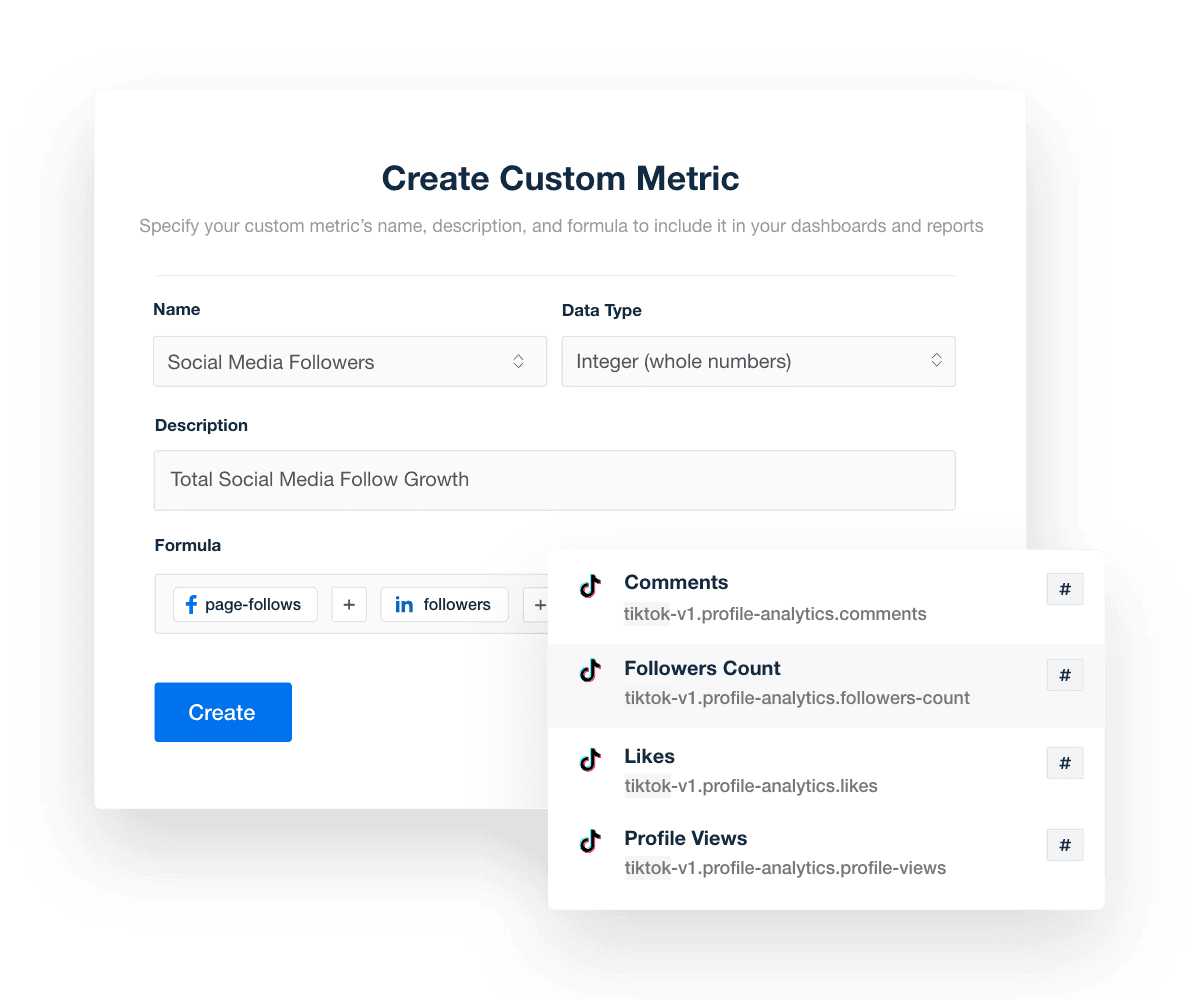
Combine insights from 80+ integrations and deliver the most comprehensive dashboards possible. Seamlessly blend data points into custom metrics that reflect your client’s goals.

Go beyond surface-level analytics. Demonstrate the value of your services by sharing what clients actually care about.

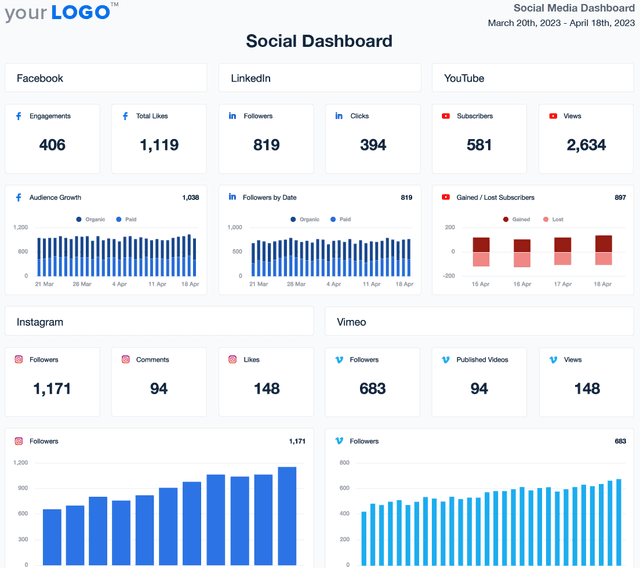
Combine and report on performance metrics across multiple social media platforms.
All In One Place

Monitor All of Your Clients at a Glance

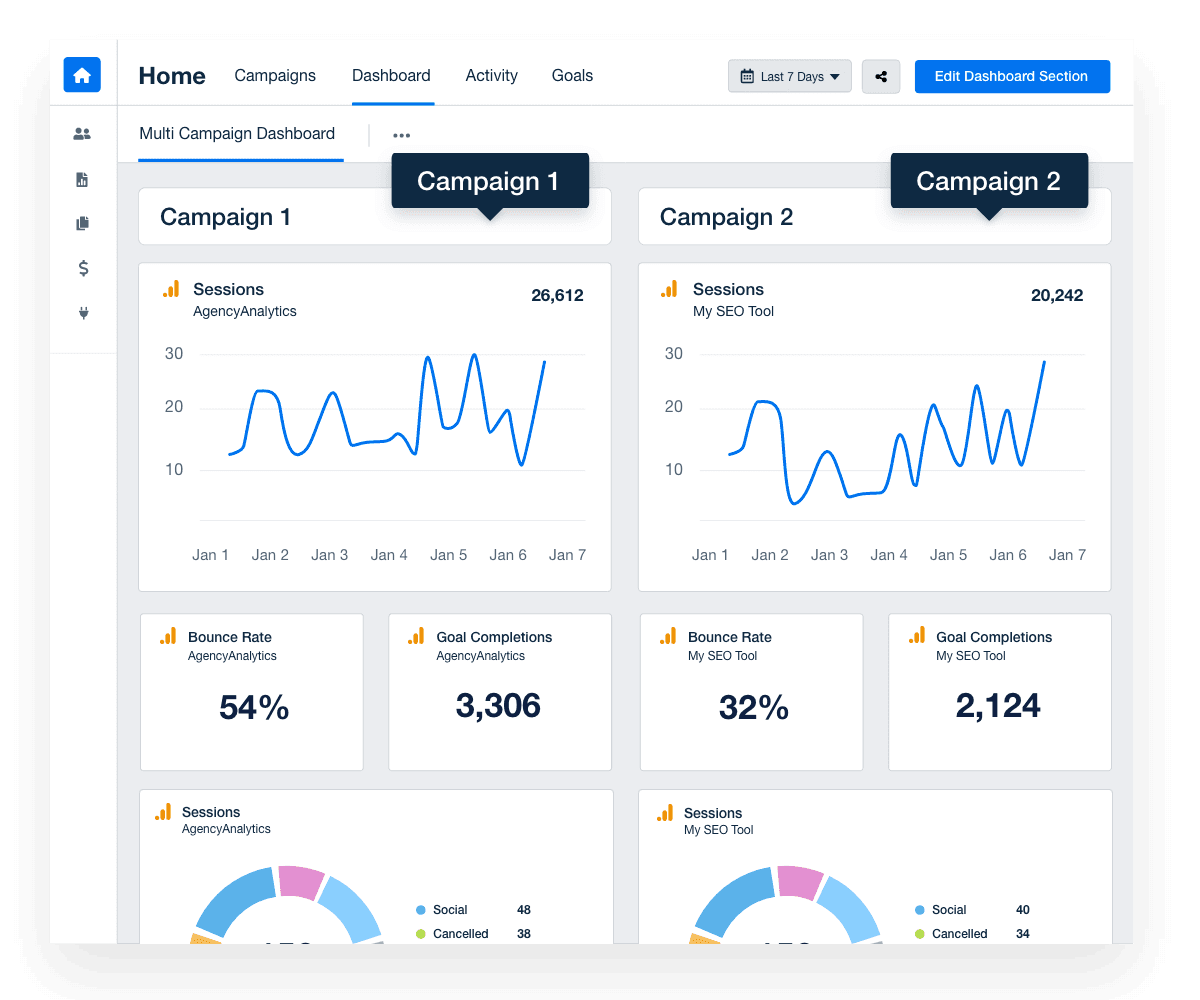
Create internal dashboards that bring your clients’ key metrics into a single interface. Monitor performance across multiple client campaigns without switching between accounts.

Have a bird’s eye view at all times. Spot opportunities, identify trends, and ensure each client gets the attention they deserve.

An Example of a Multi-Client Campaign Dashboard
Here When You Need Us

Customer Support is Our Top Priority

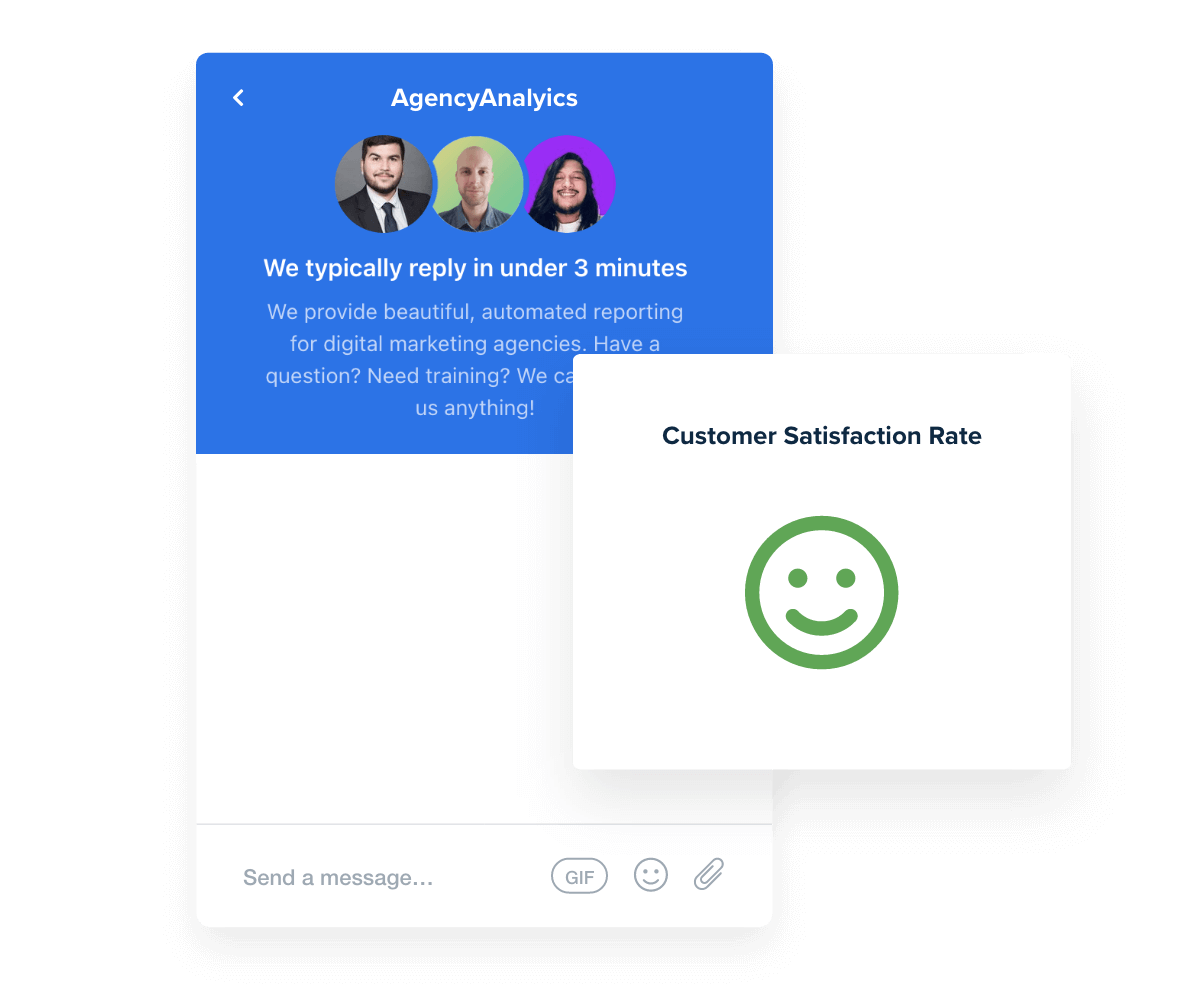
AgencyAnalytics is your partner in growth. Take advantage of our 24/5 live chat support, with average response times of under three minutes. Our team is always ready to assist with building dashboards, navigating the platform, and more. 

With a 95% satisfaction rate, we're committed to helping you deliver outstanding service, each and every time. You care about your client’s success. We care about yours.

Best in Class Customer Support
Give Your Agency Time To Grow

Report Smarter. Not Harder.

Create dashboards that give a holistic view of marketing performance. Pull data from TikTok alongside 80+ sources, all in a unified view.

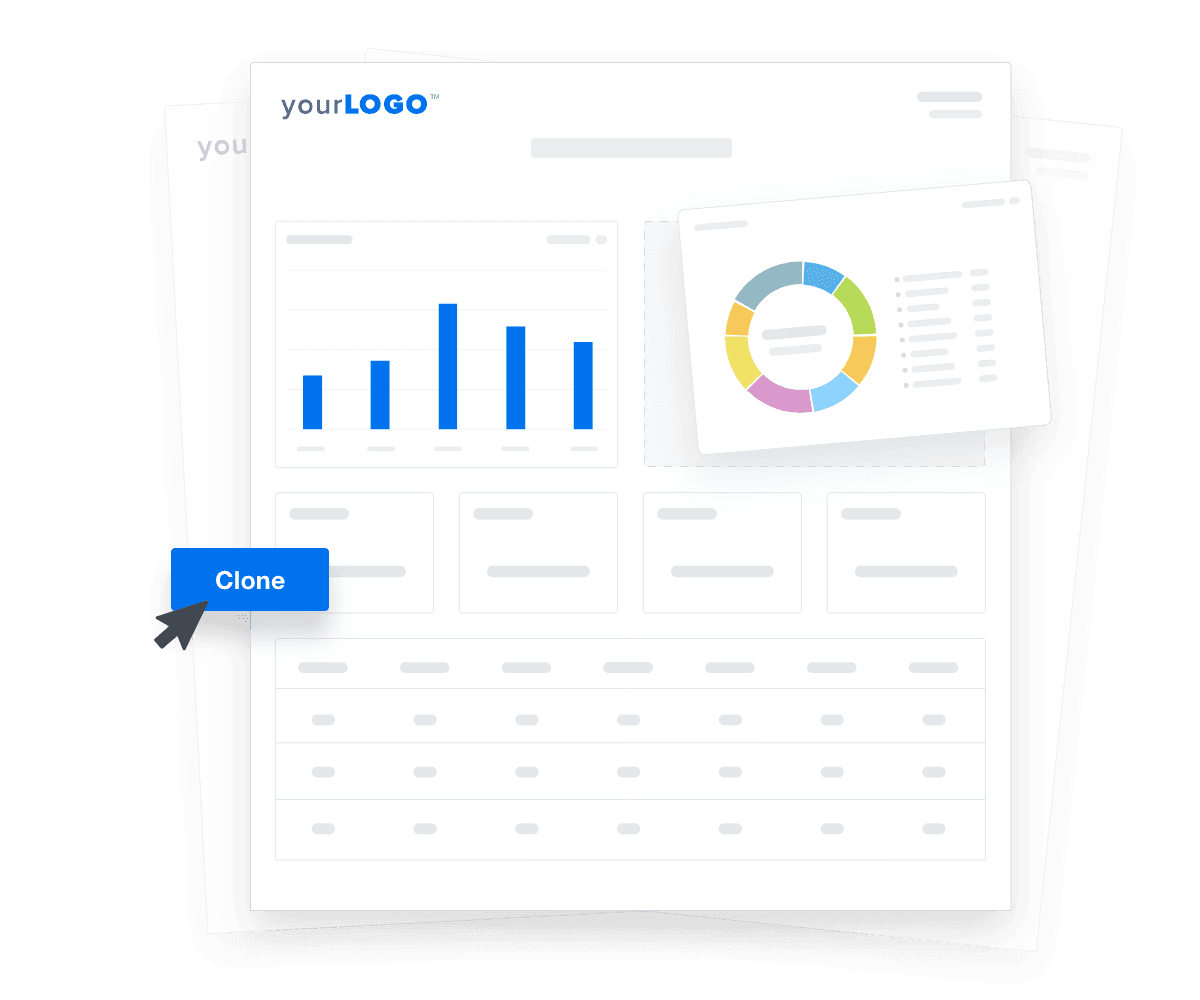
Focus on the bigger picture. Highlight the relationship between campaigns, clone dashboards, and even streamline the client onboarding process.

Smarter Client Reporting Platform
Client Reports That Are Ready in Minutes, Not Hours
Here’s Why 7,000+ Agencies Trust AgencyAnalytics With Their Client Reporting

Get Started for Free

Try AgencyAnalytics risk-free for 14 days. No credit card required.
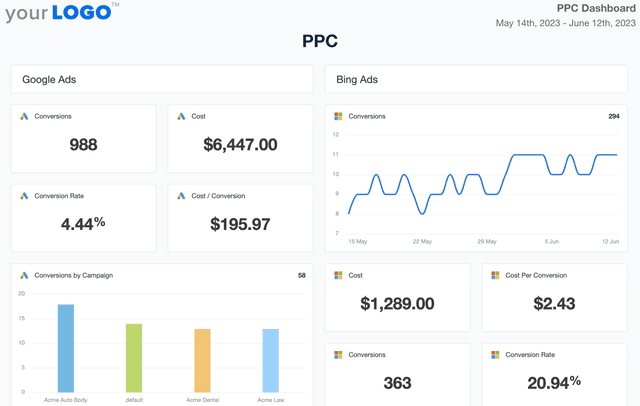
AgencyAnalytics Dashboard Preview