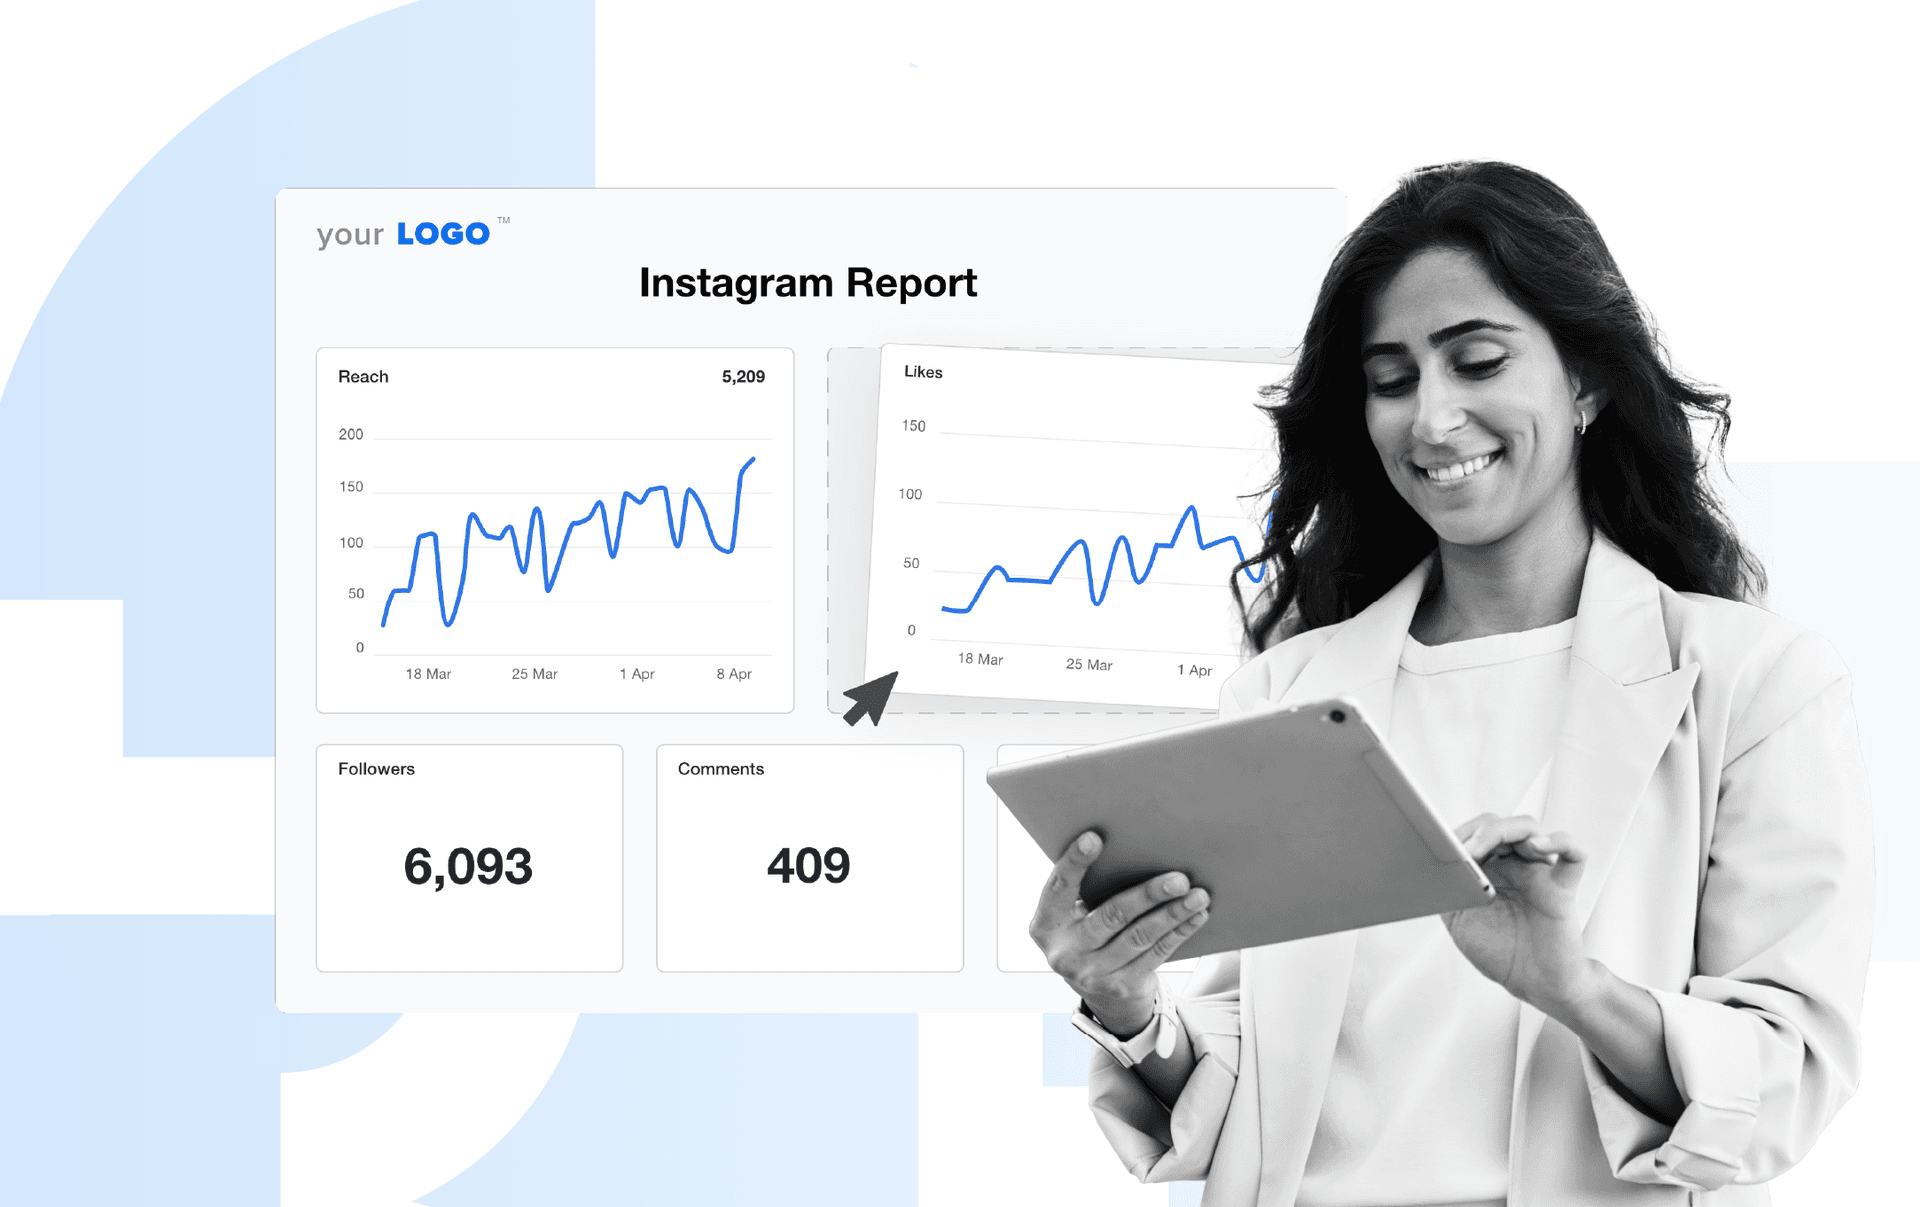
Social Media Conversion
Campaign Effectiveness
Identifies which social posts or ads drive meaningful actions.
Audience Targeting
Refines demographics and interests based on Conversion behavior.
Content Strategy
Informs what content types lead to more Conversions.
Client Reporting
Highlights ROI and results from social campaigns in client-facing reports.
Why Social Media Conversion Is Important
Social media Conversion shows whether social media efforts actually drive business results. It shifts the focus from Likes and Comments to desired actions—sales, signups, downloads, and more. This helps tie social media strategies and content directly to business outcomes.
Tracking Conversions from social media platforms highlights what’s working and where the gaps are. It brings clarity to whether the target audience is being reached and if social media content is strong enough to drive Conversions. Without this metric, it’s difficult to prove the true value of a social media presence beyond surface-level engagement.
Stop Wasting Time on Manual Reports... Get Insights Faster With AgencyAnalytics
How Social Media Conversion Relates To Other KPIs
Social Media Conversion directly depends on traffic sources, Click-through Rate (CTR), and Engagement. High Impressions and Clicks lose value if they don’t lead to Conversions, making this metric essential for evaluating whether social media campaigns are reaching the right audience and influencing customer behavior.
It also ties into cost-based metrics like Cost per Conversion and Return on Ad Spend (ROAS). A low social media Conversion Rate can signal wasted ad campaign budget or poor targeting. On the other hand, strong Conversion performance helps improve ROI and justify continued investment in social media platforms.
For organic social media content, Conversion tracking confirms whether posts are doing more than generating Reach and Reactions. Alongside Engagement and traffic metrics, Social Media Conversions paint a more complete picture of how well marketing strategies support Conversion goals and business outcomes.
Key Factors That Impact Social Media Conversion
Several factors influence whether social media users take meaningful action and turn into Conversions. Audience targeting is at the core—reaching the right audience improves the chances of converting social media users into potential customers. Poor targeting often leads to receiving engagement with little to no direct Conversions.
Creative quality also plays a major role. Messaging, visuals, and calls-to-actions need to be clear, relevant, and aligned with customer expectations. If the social media content misses the mark, even highly targeted traffic may not result in a strong social media Conversion Rate.
Landing pages are another frequent barrier. Slow load times, confusing layouts, or mobile issues disrupt the customer journey. Every step between the social media post and the desired action needs to create a smooth experience to maintain strong social media performance.
KPIs allow us, as the agency, to demonstrate our value to the client. There are basic KPIs such as spend, clicks, impressions, ranking, etc., but the real KPIs every client wants to know are leads and/or sales. We like to include both in our monthly reports. Ultimately, what is their ROI from our efforts? When you can clearly demonstrate this month over month, it increases your retention rate and keeps clients paying you month after month.
How To Calculate Social Media Conversion
Knowing how to accurately calculate Social Media Conversion Rate is key to understanding whether social media efforts are driving real results. A strong Conversion Rate means more value from existing traffic—without needing to boost ad spend. It’s a simple number that reflects how well messaging, targeting, and offers are working.
To calculate it, divide the number of Conversions (like signups, purchases, or downloads) that came from social media platforms by the total number of visitors from those channels, then multiply by 100 to get a percentage.
For example, if 2,000 visitors arrive from social media and 40 complete a desired action, the Conversion Rate is (40/2000) × 100, or 2%. This rate helps fine-tune social media strategies and improve campaign performance over time.
The same method applies when calculating Conversions across individual social media channels, ad sets, or specific social media campaigns.
What Is a Good Social Media Conversion Rate?
A strong social media Conversion Rate typically falls between 2% to 5%, depending on industry, audience, and marketing strategy. Paid social media campaigns with precise targeting, mobile friendly landing pages, and compelling calls often push to the higher end of this range.
What Is a Bad Social Media Conversion Rate?
Conversion Rates under 1% usually signal issues with targeting, engaging content, or user experience. If clicks aren’t turning into Conversions, the campaign might be reaching the wrong segment of the total audience or failing to meet customer expectations once they hit the page.
How To Set Social Media Conversion Benchmarks and Goals
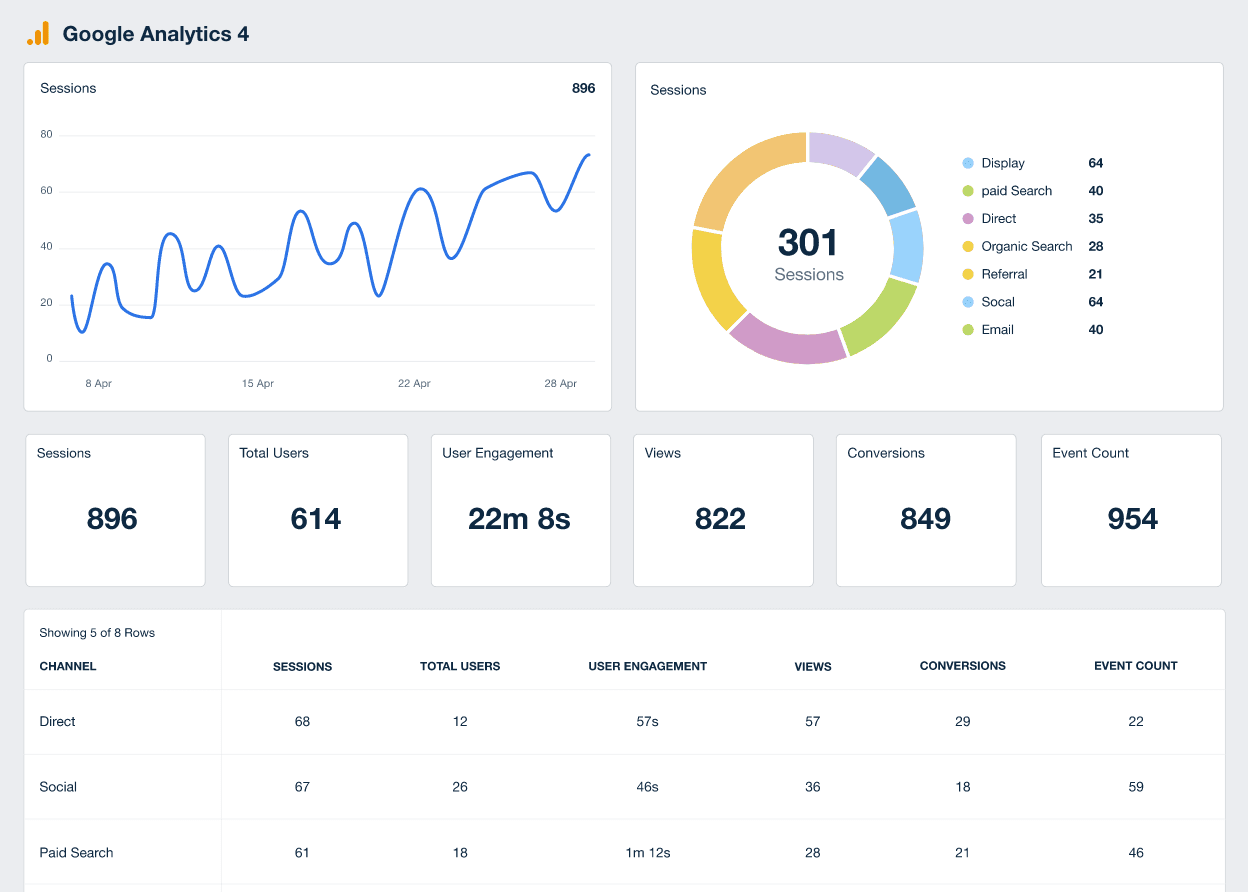
Track how changes in creative, video content, platforms, or spend affect Conversion Rates over time using analytics tools. Platforms like AgencyAnalytics—which integrates with Google Analytics and other key data sources—make it easy to monitor social media performance, visualize trends, and identify what’s driving Conversions.
On top of industry averages, use historical data from past marketing efforts to set internal benchmarks. To hit revenue goals, define the target revenue, divide by average order value, and calculate the number of Conversions needed. From there, work backward to determine the required traffic and ad spend based on current or projected Conversion Rates—a critical part of making data driven decisions that improve overall campaign performance.
Why Social Media Conversion Matters to Clients
Clients care about results that move the bottom line. Social media Conversion is a direct measure of how social media efforts contribute to real business outcomes—leads, purchases, bookings, or signups. It proves whether social media isn’t just generating buzz, but driving actions that matter.
Most clients invest in social media expecting clear, measurable returns. This KPI validates that expectation. High Conversion Rates signal that campaigns are connecting with the right users—often mobile users—and guiding them through a quick purchase process. Strong performance provides more than engagement metrics; it’s social proof that the strategy is working. It builds confidence, justifies budget, and highlights progress toward business growth and loyal customers.
Why Social Media Conversion Matters to Agencies
For agencies, Social Media Conversion is more than a performance stat—it’s a value metric. It shows clients that social media marketing efforts are doing more than generating reach or engagement—they're driving Conversions that support lead generation, new customers, and real business growth. It’s the KPI that connects creative, targeting, and social sales strategy directly to measurable outcomes.
It also helps refine social media strategies in real time. By tracking which social media posts, formats, or social media links lead to Conversion goals, agencies double down on what drives results and pivot away from what doesn’t. Using AgencyAnalytics, which integrates with tools like Google Analytics, makes it easy to consolidate performance data, uncover actionable insights, and guide a more focused, data-driven approach to campaign planning. This helps boost Social Media Conversions, justify spend, and build smarter strategies with every report.
Save Time and Streamline Your Agency’s Social Media Reporting
Best Practices When Analyzing and Reporting on Social Media Conversion
Analyzing Social Media Conversion from multiple angles helps reveal what’s driving results and where opportunities exist to improve. A surface-level glance at Conversion Rates misses critical context, such as platform differences, seasonal trends, or campaign goals. Dig deeper to spot patterns, correct inefficiencies, and report with confidence.
Compare Performance Over Time
Track Conversion Rates weekly or monthly to see if performance is improving, plateauing, or declining.
Break Down by Platform
All social media profiles should be reviewed to identify which perform best and where user behavior differs.
Review Individual Campaigns
Analyze campaign-level performance to understand which messages, formats, or offers increase Conversions.
Spot Patterns and Spikes
Look for sudden changes in Conversion Rates and dig into factors like landing pages, audiences, or timing.
Use Benchmarks for Context
Compare results to internal benchmarks or the average Conversion Rate in the industry to gauge overall health.
Add Qualitative Context
Use social listening insights or feedback from user generated content to uncover why users convert—or don’t.
Professional reports help communicate the results of marketing campaigns, website performance, and other key metrics to stakeholders such as clients, management, and investors. This helps demonstrate the value of the work being done and provides a clear picture of progress towards goals and objectives.
Google Analytics Dashboard Example
Related Integrations
How To Improve Social Media Conversions
Small changes to messaging, targeting, and landing pages can lead to big gains in Conversion performance.
Refine Audience Targeting
Focus on segments most likely to take action based on past behavior and engagement.
Test Different CTAs
Try variations in CTA text, placement, and color to see what drives more clicks.
Simplify Landing Pages
Remove friction by making pages clean, fast, and focused on one clear call to action.
Related Blog Posts
See how 7,000+ marketing agencies help clients win
Free 14-day trial. No credit card required.


