Table of Contents
QUICK SUMMARY: What do real users think of Whatagraph? We dug into the reviews, explored the platform, and broke down the pros, cons, and use cases so you can decide if it’s the right fit for your agency, or if it's time to consider a smarter alternative.
If you're looking into Whatagraph to handle your marketing analytics, you might want a transparent look at what real users say about the platform. Or, if you're checking out AgencyAnalytics vs. other tools, maybe you're curious about how Whatagraph stacks up.
Whatever your reasons, we've analyzed Whatagraph's features and capabilities, as well as real user reviews and community feedback, to give you a clear picture of what the reporting software has to offer. This article rounds up all that information to help you understand the pros, cons, and best use cases for Whatagraph, to help you decide if it's right for your agency.
What Is Whatagraph?
Whatagraph is a marketing reporting tool that helps marketing teams pull data from multiple sources into one platform. It’s designed to simplify report building and automate reporting workflows using templates, visual widgets, and cross-channel data connections.
Used by both in-house marketers and marketing agencies, its flexibility aims to support businesses that want to customize reports, blend data, and scale their reporting processes.
Who Is Whatagraph Best For?
Whatagraph is built for marketers who need to unify and visualize performance across many platforms. It's most commonly used by mid-sized agencies and by in-house teams running cross-channel advertising. It stands out for the visual appeal of its reports, which give users design control to build creative, on-brand layouts.
While it does cater to agencies, Whatagraph isn’t designed exclusively for agencies. Users who switch from Whatagraph to more specialized tools often cite pain points like unreliable data syncs and limited flexibility when creating multi-client views. Plus, users report friction with managing separate logins instead of using custom domains or client-specific permissions.
Here’s a quick look at the types of users that are a strong match for Whatagraph, and those who may be better served by a Whatagraph alternative:
Good Fit for Whatagraph
In-house marketing teams reporting results to leadership
Mid-sized agencies serving a smaller client list
Businesses with strict brand guidelines or high design standards
Agencies producing a few highly customized reports manually
Single-client teams with unique formatting or branding needs
Not a Great Fit for Whatagraph
Agencies managing 25+ clients who need consistent reporting across accounts
Content-focused teams that need strong SEO tools within their reporting solution
Agencies who want built-in alerts, anomaly detection, or benchmarking
Teams who need advanced automation and low-friction report updates
Agencies seeking verified, multi-platform data accuracy across every campaign
Whatagraph Review Summary (Pros & Cons)
So, what are real users saying about Whatagraph? We dug through actual user reviews to bring you some real-world perspectives.
Many users appreciate its clean, easy-to-use dashboards and note that it saves them time and reduces manual work. People also definitely like the visual design features:
I don't have to play Dr. Frankenstein with 7 different platforms and then spin the screenshots through Canva to "prettify" the data.
Brinda G. Content Writer
On the flip side, reviewers frequently report stability issues and inaccurate data. Data connectors occasionally break, prompting manual reconnections, and sourcing key data isn't always easy:
Many times the connectors for the different marketing platforms get disconnected. This becomes a pain to keep relinking.
Great idea that is full of bugs and just doesn't deliver real value.
Joseph H. President of Marketing and Advertising
Costs are also high for smaller teams, with some users deeming it poor value for money. Reviews have pointed out the complexity of its pricing structure:
I found its pricing structure to be somewhat complex, especially for larger teams or agencies. More transparent and flexible pricing options would enhance the overall user experience.
Roberto G. ITI Project manager
Ultimately, some users have recommended looking at other options on the market:
My advice to all considering is to fire into Google alternatives as this providers service is not only slow, unreliable and hugely overpriced. It is met with (what they deem a USP of personal service) which I have received a completely inhuman and generic response to a billing query. It makes me struggle to understand their position or value in today's fierce marketplace.
Whatagraph Reviews on Reddit
Beyond the traditional software review sites, lots of users have also shared their thoughts about Whatagraph on Reddit. Here are a few things Reddit users have said:
Whatagraph served us for years and I was happy to have the tool, it did pretty much everything we needed! But I think there can be some improvements on the data visualization and user experience.
Pretty solid visualization options when you need to impress clients who are visual learners. Their templates are decent time-savers.
Limited functionalities and a bit quirky in the way it works. It is not intuitive in the way you filter campaigns and stuff like that.
Whatagraph Pros & Cons
Let's break down the most frequently cited pros and cons in user reviews of Whatagraph:
Whatagraph Pros
Clean, intuitive dashboard builder with drag-and-drop widgets
Seamless scheduling and automation of client-ready reports
Strong support and white labeling options
Native integrations with key channels: Google Ads, Meta, TikTok, LinkedIn
Helps eliminate manual reporting workflows
Whatagraph Cons
Data disconnects requiring manual re-authentication
Limited customization in formatting and layout (e.g., widgets, date controls)
Pricey, especially for smaller or growing teams
Occasional UI glitches, particularly with collaborative editing
Whatagraph Features Breakdown
To get a sense of whether Whatagraph is right for you, you'll want to know more about its features and functionalities. We've outlined each feature for not just its capabilities, but also its strengths and areas for improvement:
Whatagraph Ease of Use
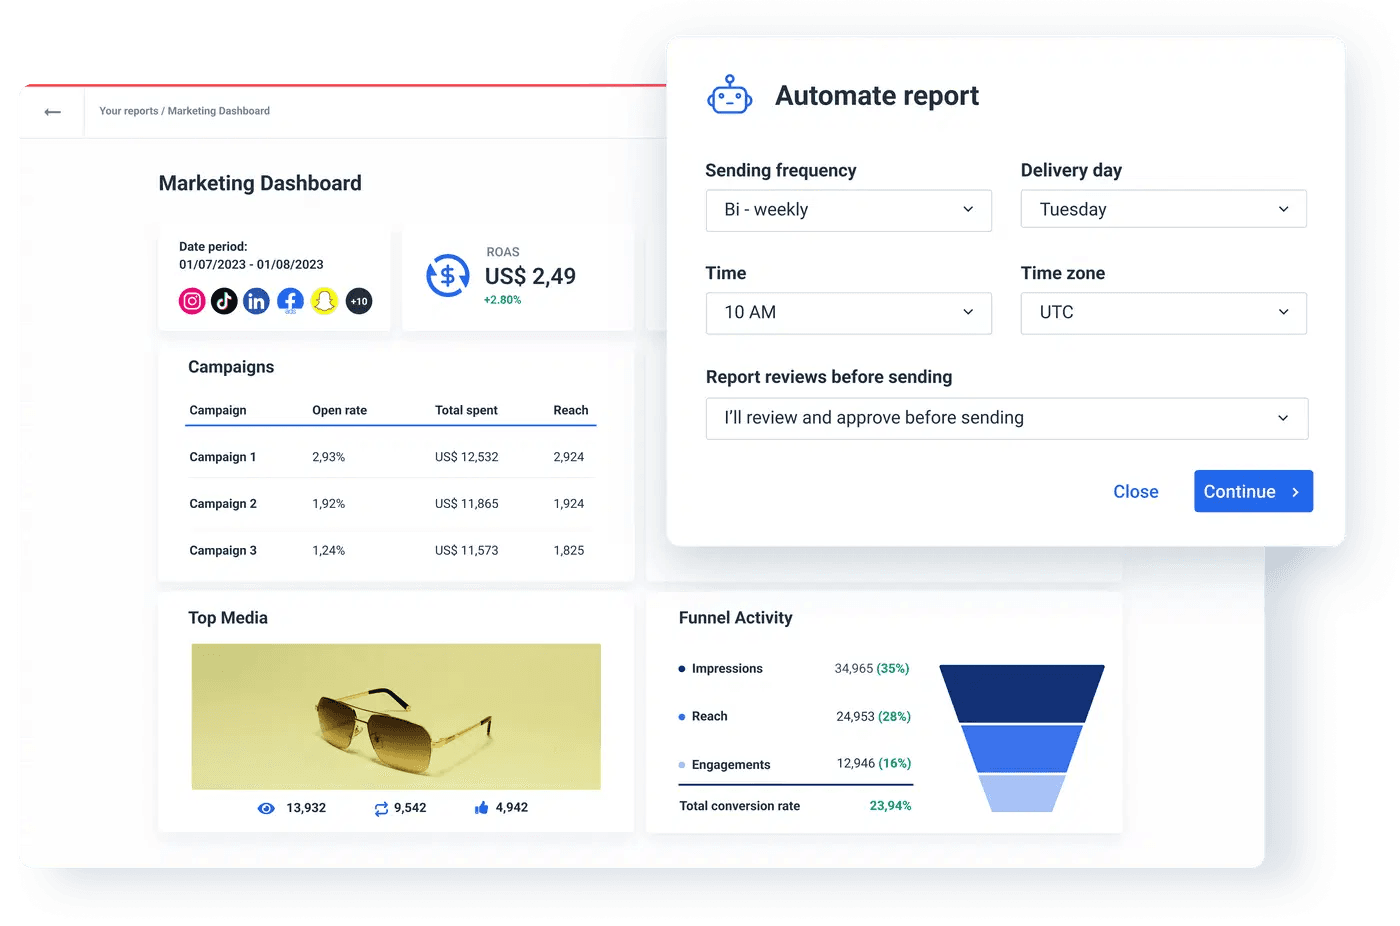
Users report that setting up Whatagraph is relatively straightforward. It has a 4.1 ease of use rating and a 3.9 ease of deployment rating on Capterra. The onboarding flow guides you through linking your advertising channels and other data sources in a few steps.
However, there are some glitches reported in the software that get in the way of its usability. Whatagraph's main interface is a drag-and-drop canvas where you pick widgets (charts, tables, KPIs and metrics, etc.) and position them visually. Some of the customization options with these widgets are finicky.
One user who switched from Whatagraph to AgencyAnalytics shared:
Whatagraph has a setting where you can change the day that your week starts. So, we would try to put it on a Sunday, but it’s actually glitchy for them, and we manually had to go change our reports and all our widgets, like every week. So, that’s been quite frustrating with that platform.
Additionally, when multiple users edit a report simultaneously, some layouts glitch, creating disruptions or losing widget settings. This is likely why it only has an 83% satisfaction rating for its co-editing capabilities on G2.
If two people are editing a report at the same time, the widgets can glitch or break which is frustrating on tight deadlines.
Bruhith I. Digital Marketing Specialist
What Works Well
Simple onboarding and setup
Drag-and-drop widgets streamline report creation
Clean visual layout makes client-ready reporting fast
Opportunities for Improvement
UI glitches when multiple users edit or change dates
Date-picker issues cause display lag
Bottom Line: Accessible for businesses that need to build one-off reports, though it shows strain under collaborative use and granular date manipulation.
Whatagraph Integrations
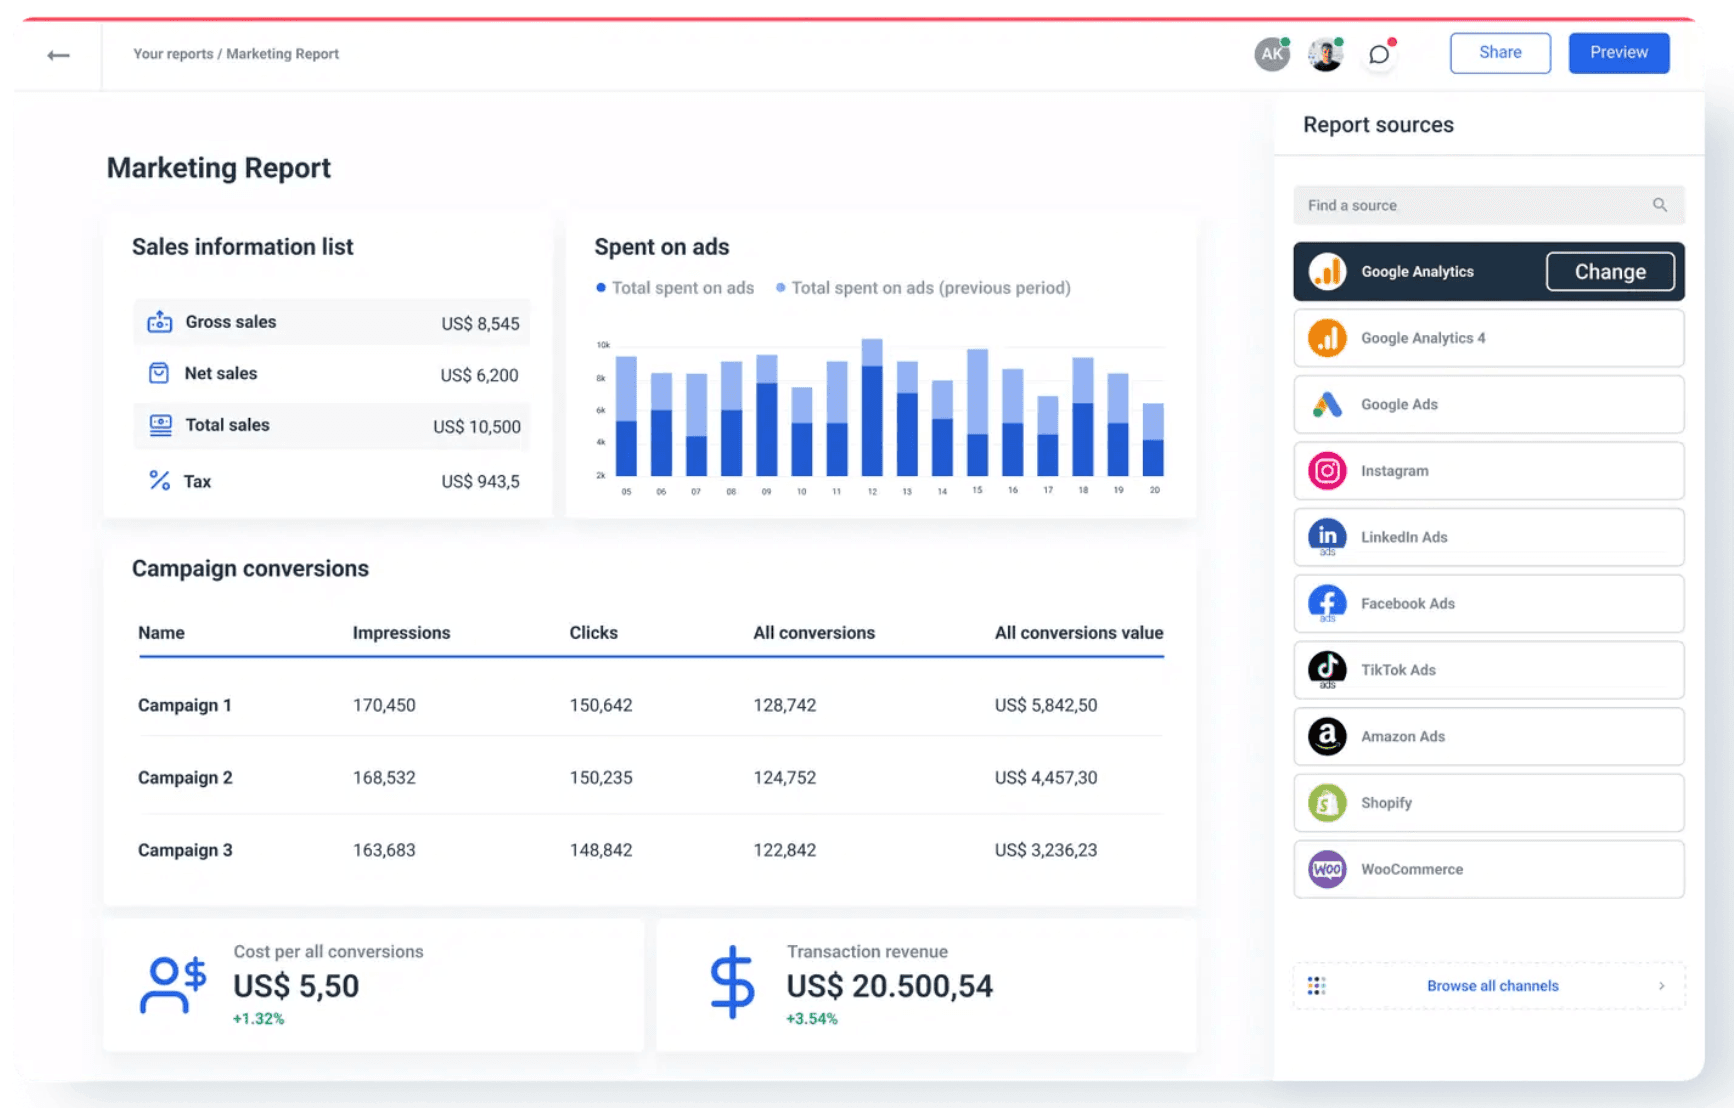
Whatagraph integrates with major ad and analytics tools including Google Ads, Facebook, LinkedIn, TikTok, and others. Its native connectors pull campaign metrics, costs, conversions, and impressions into its centralized reporting hub. It also supports data imports via API, BigQuery, and Google Sheets, which helps teams include offline sources or proprietary systems in their dashboards.
Users appreciate this breadth, but note that connections aren't always reliable and may drop unexpectedly and repeatedly. One Capterra reviewer reported "data sources being randomly disconnected for no apparent reason", and another said:
Even if the source is connected, there is no guarantee that it will not be disconnected for no reason.
Adina M. Social Ads Strategist
One user who opted to switch to AgencyAnalytics shared:
We were using Whatagraph for monthly reporting and it was fine, but things tend to change pretty rapidly with them. Metrics drop in and out. Things are always moving and we got to the point where we weren’t 100 percent happy with it.
Plus, platforms like X Ads or special campaign types may not be available, so you may need to use workarounds or ignore certain data channels. One user review notes there are "troubles with connecting social media channels."
What Works Well
Native integrations with major platforms
Custom API, BigQuery, and Sheets options help extend compatibility
Opportunities for Improvement
Manual reconnection may be required when data drops
Gaps exist for less mainstream sources
Bottom Line: Good coverage for most needs, but agencies that rely on full-spectrum consistency or specific platforms may find gaps and disruptions.
Whatagraph Reports and Dashboards
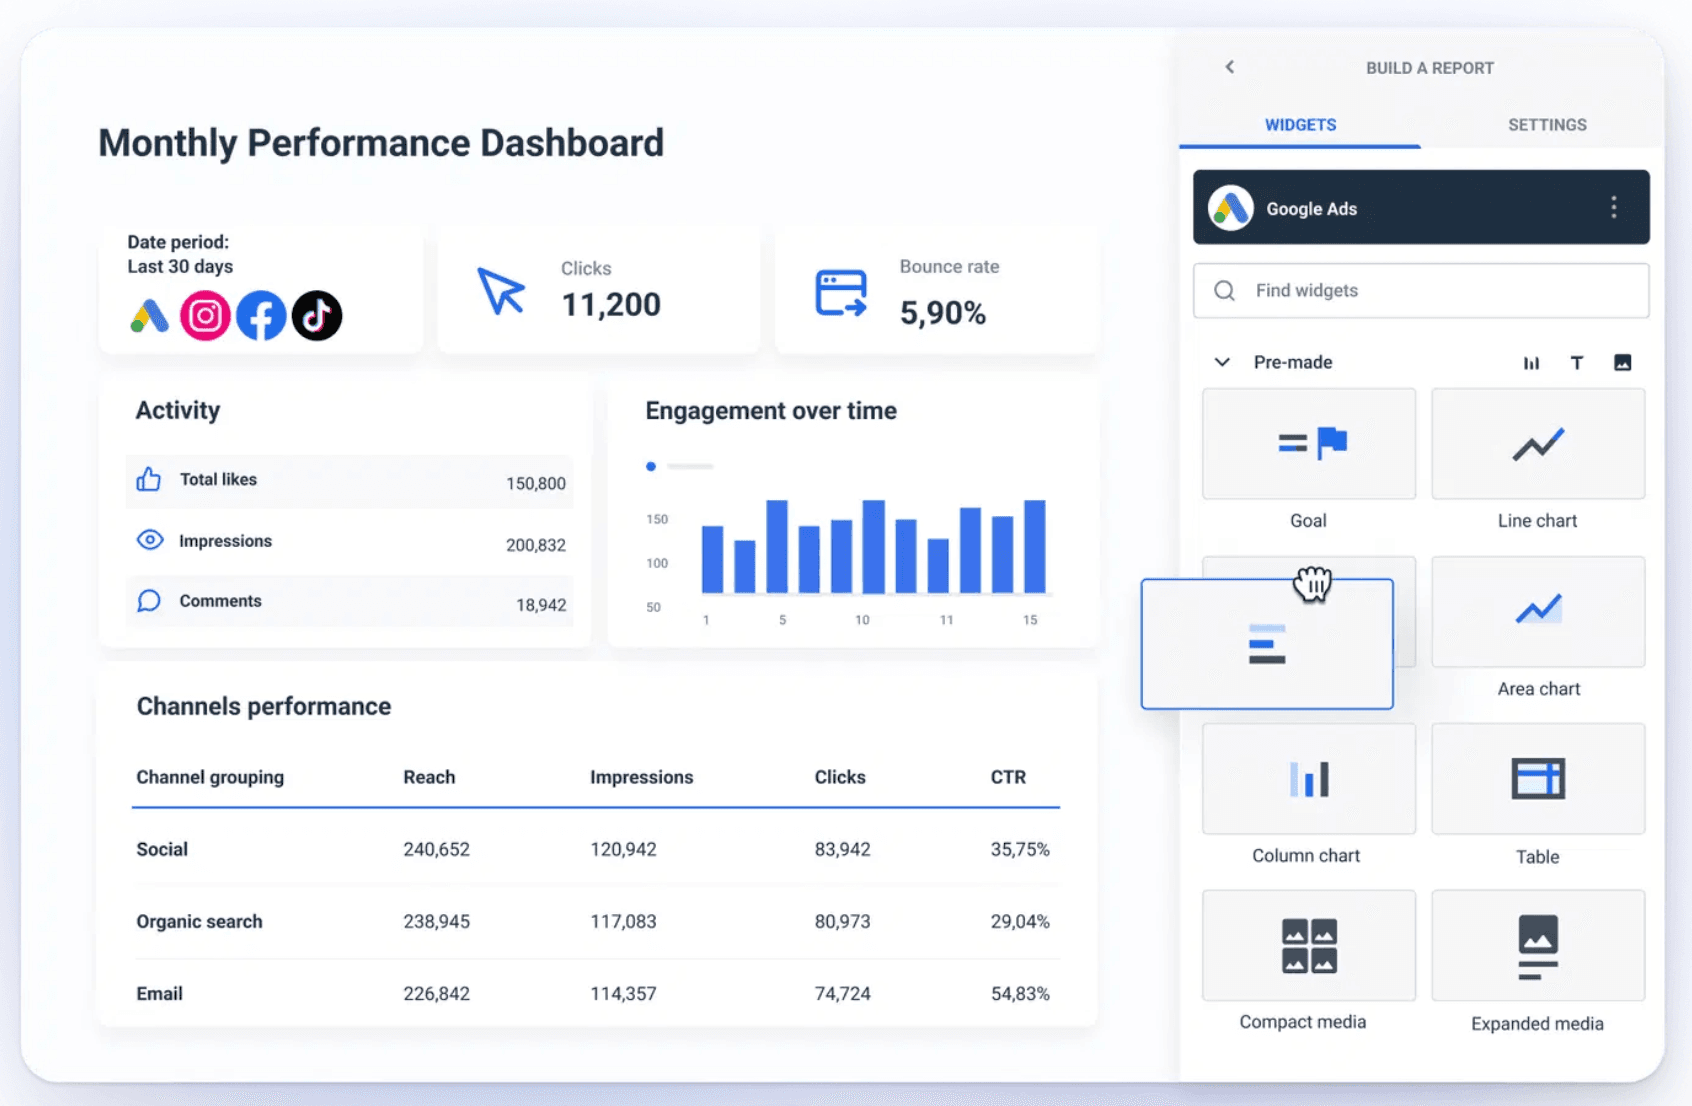
Whatagraph offers over 100 customizable report templates, and scheduled report delivery is available via email and client portals. However, customizing report layouts (like reordering widgets or resizing charts) is limited. One user review expressed that there's "not enough freedom in the size and design of widget."
This is reflected in its 3.5-star rating for customizable reports on Capterra, and its 86% satisfaction rating for dashboards on G2. Another Whatagraph review expressed:
While I genuinely appreciate Whatagraph's capabilities, there are moments when I wish the customization options for visualizing data were a bit more flexible. Occasionally, I find myself wanting to present information in a unique way that the platform might not fully support.
What Works Well
100+ templates and widget options
Automated report scheduling and delivery
White label branding support
Opportunities for Improvement
Drag-and-drop layout is less flexible than advertised
Report edits may break export links or require manual adjustments
Bottom Line: Great for visually polished scheduled reporting, but if you need fast updates across dozens of clients, you may find it cumbersome.
Whatagraph Insights Features
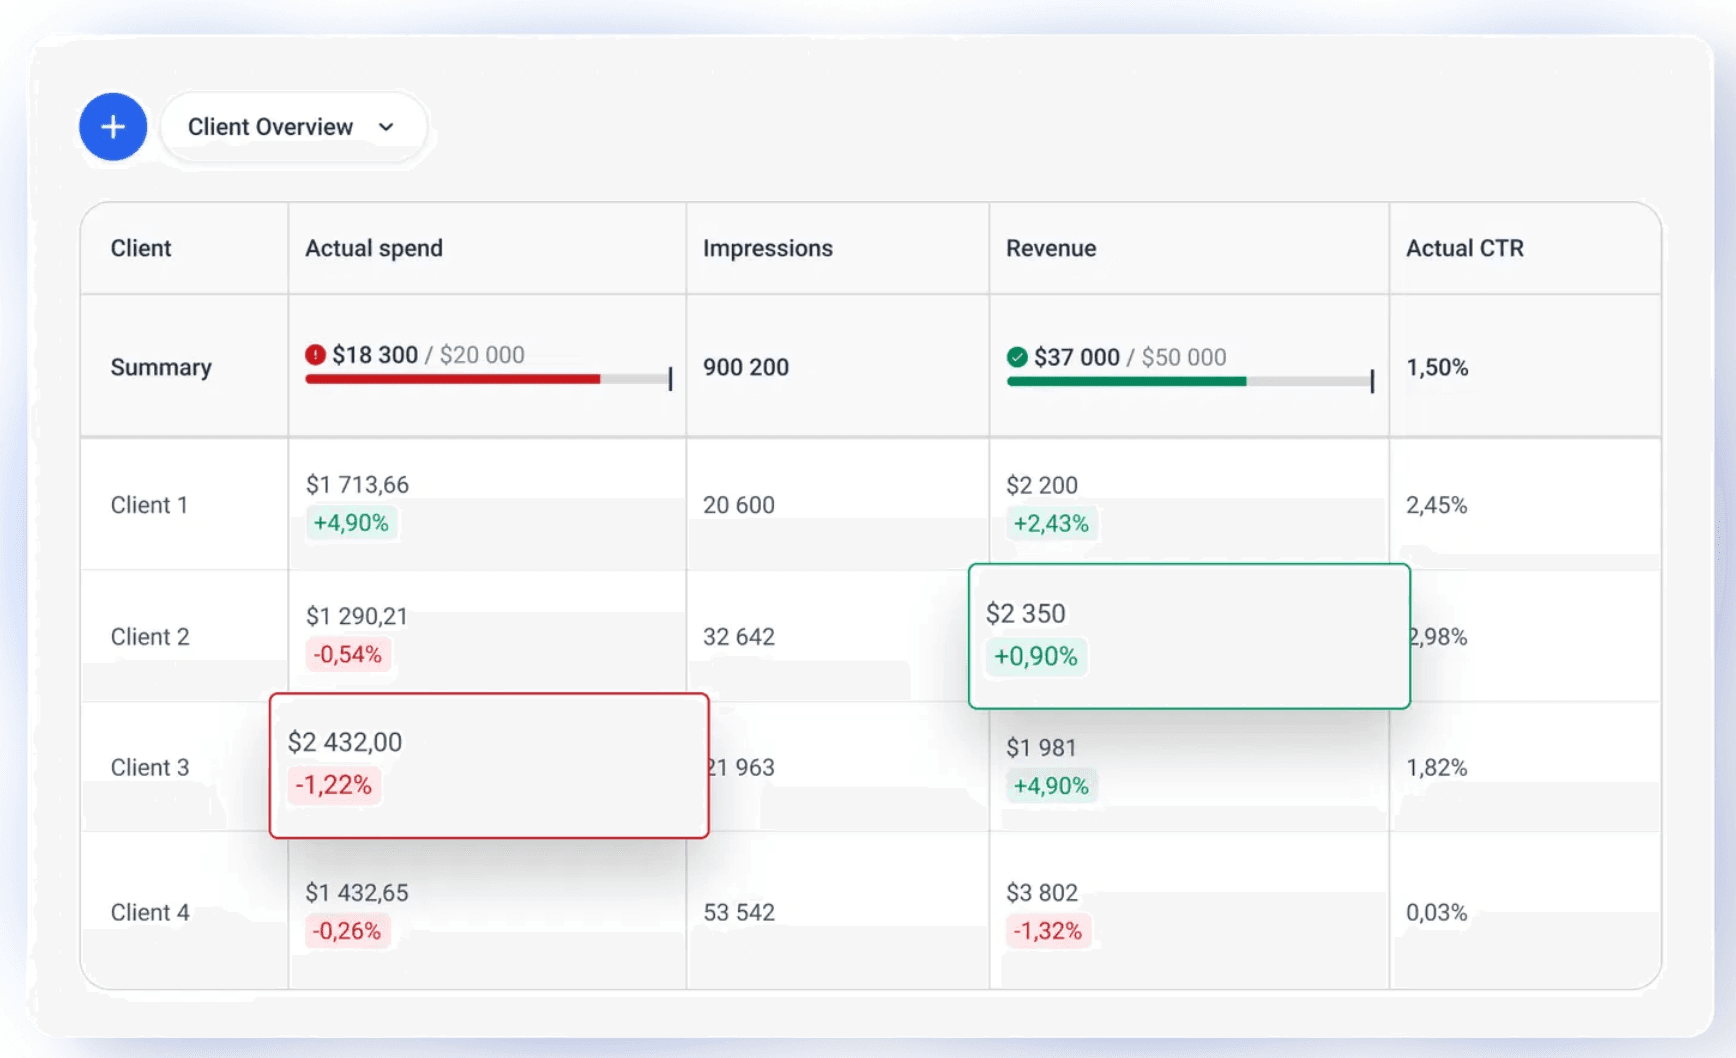
Many automated reporting tools have AI-driven analytics capabilities built in, which provides more context around the data and helps users extract meaningful insights. Whatagraph has basic AI summaries that highlight high-level trends within a report, helping to call out changes like cost increases or conversion dips.
However, features like proactive anomaly detection, industry benchmarking, and alerting on significant shifts are not built in. This takes away from the software's ability to truly turn data into meaningful information. As one reviewer put it:
Not a true data analysis tool. If you want to drill into your data and get a deeper understanding look elsewhere.
What Works Well
Basic AI text summaries and trend detection assist with context
Some data blending and custom metric capabilities
Opportunities for Improvement
No built-in alerts or anomalies
Missing industry benchmarks and metric alerts
Bottom Line: Suitable for tracking trends and basic commentary, but it doesn’t cover real-time alerts or benchmarking needs, making for more manual data review.
Whatagraph Customer Support
Users of Whatagraph have access to live chat support, and a Customer Success Manager (CSM) is assigned with every plan. The option to speak with a real human is definitely useful for complex support needs or if your company needs a more personal service.
Many reviews state that chat response times are fast and staff are knowledgeable about workflows and integrations, but one reviewer did point out that live chat is not available 24/7:
Live chat support is not 24/7 but they do reply to you very fast during their operating hours.
That said, some reviews reported unhelpful customer service experiences and generic responses. Another user review mentioned long wait times to receive an answer when contacting customer support:
[I]f you have a data reporting issue […] you have to contact support and wait a few days for them to get back to you.
Shannon R. Blogger
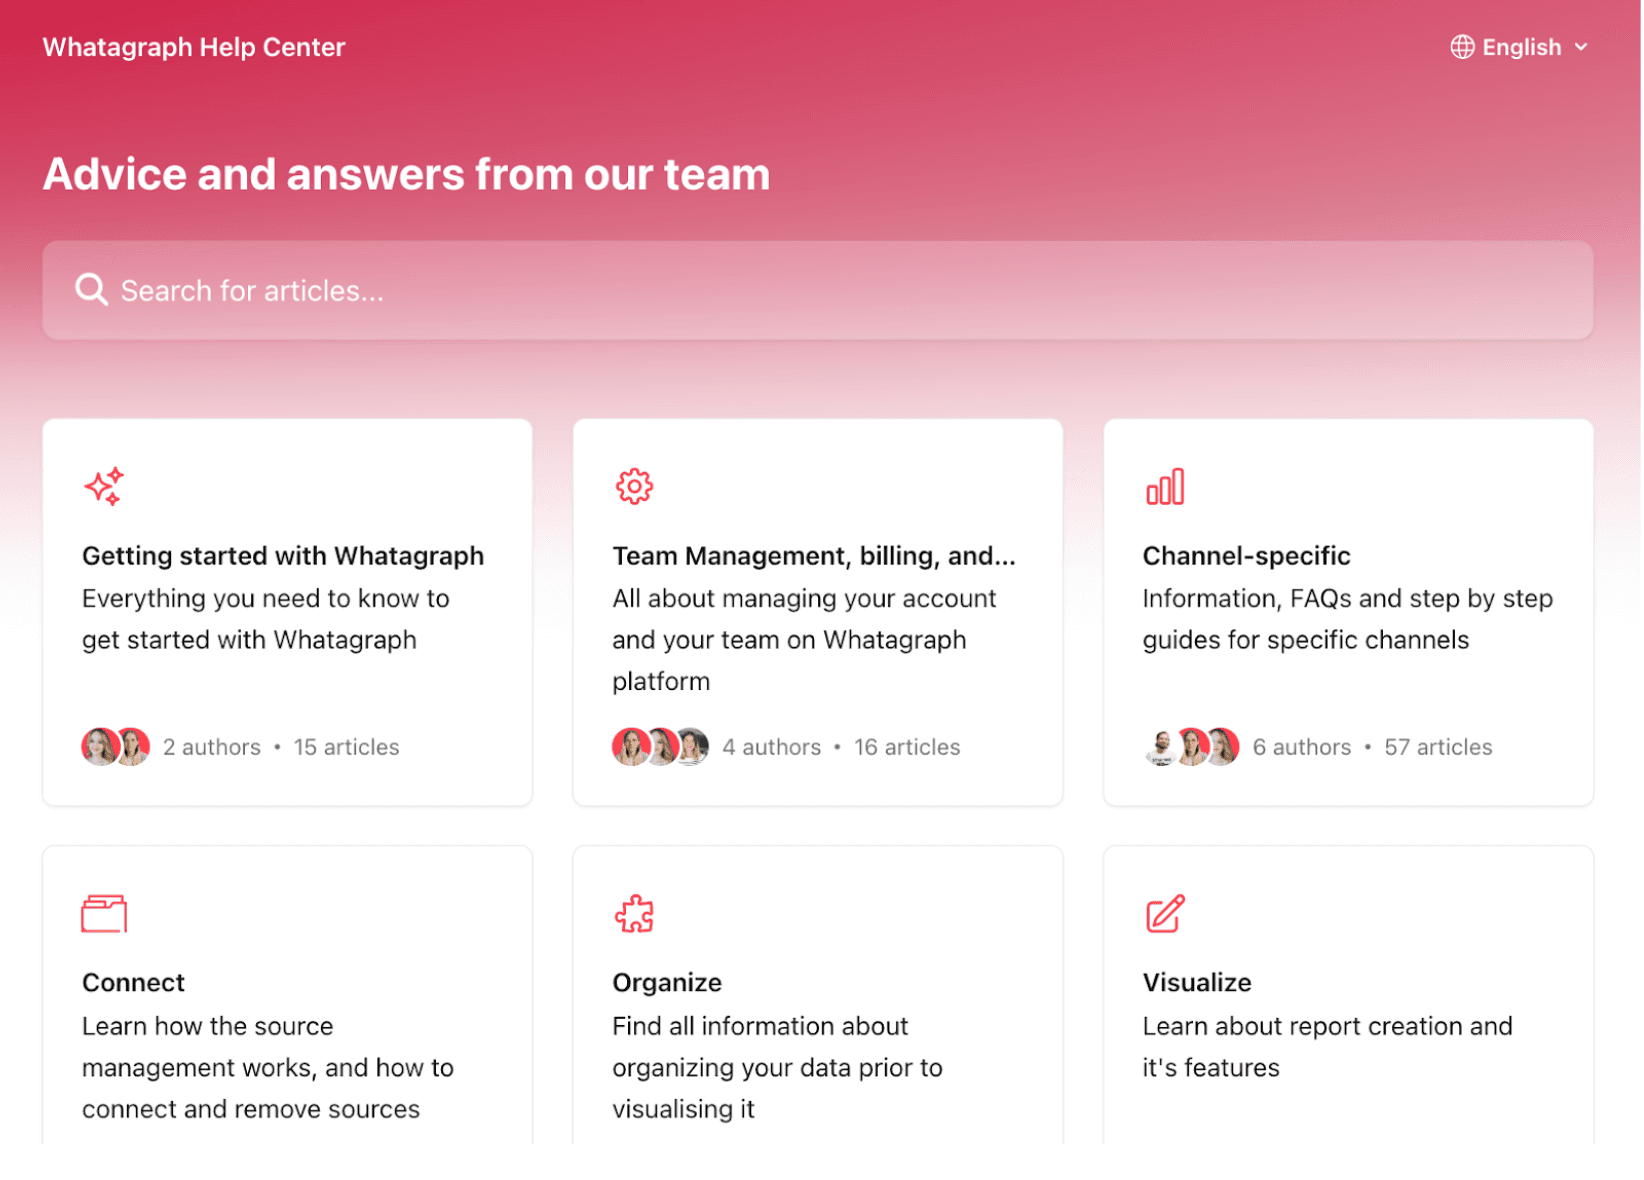
Aside from these support channels, a self-serve help center is also available for troubleshooting basic issues. For a billing query, this might suffice–but for getting dropped data sources reconnected quickly, it might not be enough.
What Works Well
Fast live-chat response during operating hours
Professional CSM support from knowledgeable account managers
Comprehensive help docs and onboarding support
Opportunities for Improvement
Escalations may be slow
Billing issues sometimes need follow-up
Bottom Line: Good everyday support, but for complex issues or rapid troubleshooting, companies may prefer tools where comprehensive support scales with plan tiers.
User Ratings Across Platforms
Whatagraph is rated between 3.8 and 4.5 across review sites like G2, Capterra, and TrustPilot. Here are the exact star ratings it has on various sites, and the number of reviews that those ratings account for:
4.5 on G2 based on 277 reviews
4.4 on Capterra from 84 reviews
3.8 on TrustPilot from 15 reviews
4.5 on Endorsal from 300 reviews
Digging in deeper on specific features and functionality ratings, here's how Whatagraph stacks up:
User Interface: The reports interface has an 89% satisfaction rate on G2 from 93 reviews.
Data Sources: On Capterra, Whatagraph's data connectors earned 4.3 stars, its data import and export functionality got 4.1 stars, and its ability to manage data from multiple sources was given 3.3 stars.
Real-Time Updating: On G2, the ability to track data in real time with Whatagraph has an 84% satisfaction rate from 31 reviews.
Customizable Reports: The ability to adjust the layout of reports only has 3.5 stars on Capterra, and white labeling gets an 85% satisfaction rate from 67 reviews on G2.
AI Capabilities: Whatagraph's AI text generation gets an 83% satisfaction score, and its AI text summaries get an 83% satisfaction score on G2.
Whatagraph vs. Alternatives
If you're exploring Whatagraph, chances are you're also weighing it against other reporting tools. From agency-specific platforms like AgencyAnalytics to generalist BI tools like Looker Studio (formerly Google Data Studio) or Klipfolio, each option comes with its own benefits and trade-offs.
Here's an overview of some of the most popular reporting tools you might be interested in:
AgencyAnalytics: Purpose-built for marketing agencies, it offers robust automation, reliable data connections on more than 80 integrations, and client-focused features like role-based permissions, anomaly alerts, and industry benchmarks gathered from 150,000+ campaigns. Plus, strong SEO features like keyword rank tracking.
Google Data Studio (Looker Studio): Free and highly customizable, it's ideal for data-savvy teams that want full design control and are comfortable setting up third-party connectors to expand functionality.
Databox: Real-time dashboards and goal tracking, with a strong mobile experience and performance alerts designed for ongoing monitoring, not just static reporting.
Whatagraph vs. Alternatives: Feature Comparison
Beyond a high level overview of the key players on the market, you probably want to consider how these different tools compare in their features and capabilities. Let's break down how Whatagraph stacks up against the competition, to help you pick out the best reporting tool for your company:
Criteria | Whatagraph | AgencyAnalytics | Other Alternatives |
Target User | Built for both agencies and in-house teams | Built specifically for marketing agencies | Looker Studio (in-house teams), Klipfolio (technical users), DashThis (freelancers) |
Ease of Use | Intuitive, drag-and-drop interface; fast setup | Clean UI with prebuilt templates and drag-and-drop tools | Looker Studio requires technical skills; DashThis is plug-and-play |
Integrations | 45+ native integrations; some reliability issues reported | 80+ integrations, consistently rated as stable and reliable | Klipfolio supports many data sources but may require manual setup; Looker Studio depends on connectors |
Cross-Channel Reporting | Allows metric blending and cross-channel comparisons | Strong on SEO (rank tracking and keyword reports) and PPC cross-channel visibility; includes advanced KPI tracking | Klipfolio allows deep custom metrics; Looker Studio supports blending but requires manual work |
Customization | Good visual customization, flexible widget layout | White label options, branded portals, and templating for scale | DashThis has limited customization; Tableau offers advanced design (but complex) |
Insight Features | AI summaries, basic insights; lacks real-time alerts | Anomaly detection, benchmark data, metric alerts, Ask AI and AI Summary | Looker Studio has no built-in AI; Tableau offers deep insights but needs setup |
Automation & Scale | Manual updates needed across reports; linked templates help but limited | Fully automated reporting, linked templates, bulk changes | Looker Studio lacks automation; DashThis offers basic scheduling |
Client Portals | Branded portals with limited access control | Granular access control, multiple client logins, white labeled marketing dashboards | DashThis includes portals; others may need external tools |
Customer Support | Mixed reviews: responsive for basics, slower on complex issues | Highly rated for 24/5 agency support, median response time of 1 minute 40 seconds, and dedicated CSMs on higher plans | Klipfolio and Tableau have tech-heavy support; DashThis is praised for simplicity |
Pricing | Tiered by user and data source volume; adds up quickly at scale | Tiered by number of clients; better value for multi-client agencies | Looker Studio is free; Klipfolio and Tableau are priced for power users |
Final Verdict: Is Whatagraph Worth It?
Whatagraph offers a user-friendly reporting dashboard with lots of visual appeal. For in-house marketing teams or smaller agencies focused on high-level campaign visibility, it covers the basics well, especially if you want to connect your data sources and build visually engaging reports quickly.
The truth is though, for many marketing agencies, the reality is more complex. Data that drops out, metrics that don’t match the source, and setups that need frequent fixing quickly turn into wasted billable hours. When you're managing lots of clients and campaigns, even small glitches in reporting create real problems.
If you're looking for a reporting tool that helps you actually grow your business, and not just create reports that are nice to look at, you need more than automation. You need reliability, flexibility, and a customer service team that understands how agencies operate. With that, you get to stay focused on strategy and delivering client value, not tech troubleshooting.
In short: Whatagraph works well for some companies, but many agencies eventually hit a wall. When the cracks start to show, it’s not just the software you’ll struggle with—it’s your reporting workflows, your ability to verify performance and make smart calls quickly, and ultimately, the relationships you have with your clients.
If you’re looking for a better solution, check out AgencyAnalytics instead–the only reporting platform purpose-built for marketing agencies.


Written by
Kyra Evans is the Manager of Content Marketing at AgencyAnalytics. She has over 15 years of experience writing content for SaaS, tech, and finance brands. Her work has been featured by HuffPost and CBC, and she serves an engaged social media readership of over 30,000 community members.
Read more posts by Kyra EvansSee how 7,000+ marketing agencies help clients win
Free 14-day trial. No credit card required.


