Table of Contents
QUICK SUMMARY:
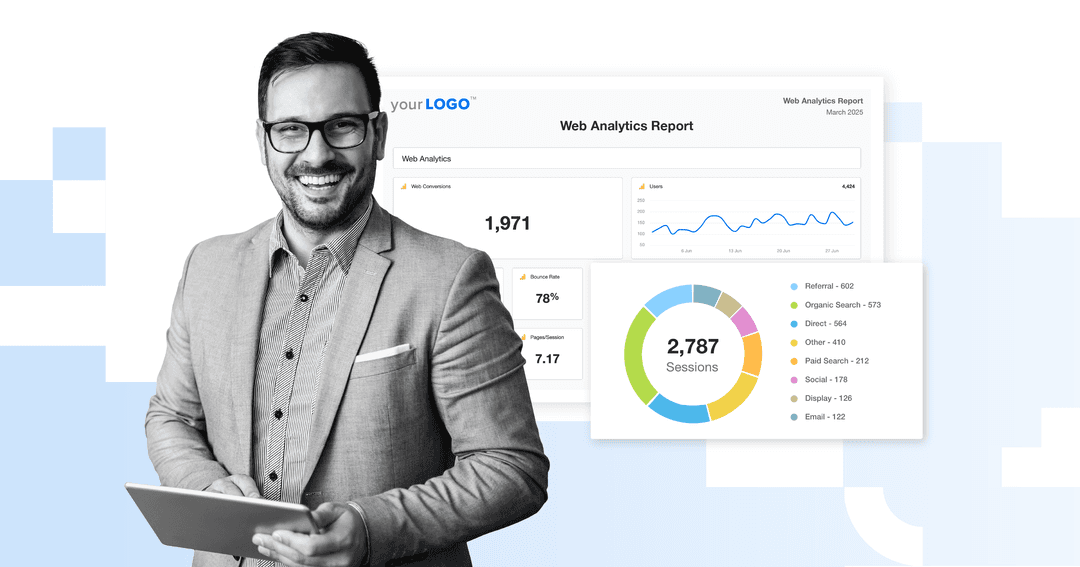
Web analytics reports track website performance, user behavior, and conversion metrics across key channels. They turns raw data into actionable, data-driven insights—helping agencies measure marketing impact, improve SEO efforts, and connect results to business goals. This guide breaks down the seven most essential web analytics report types with fresh examples and free templates to streamline analytics reporting and uncover deeper insights.
“We’re not getting enough traffic. How can we improve our website?”
Clients ask this all the time, but the answer requires more than guesses or shallow data–it boils down to web analytics. Whether it’s analyzing traffic sources or assessing user behavior, these valuable insights reveal what’s working, what’s not, and where to optimize.
But manually compiling these insights? That’s a time-consuming hassle no agency wants.
Here’s a solution: Use web analytics reports instead. These professionally designed templates streamline the preparation process, eliminating the need for excessive formatting or manual data consolidation. This way, you’ll have more time for high-level activities that matter, like actually executing client deliverables and driving real results.
In this article, we’ll explore the top seven web analytics report examples your agency should know. We’ll also share a free web analytics report template to save time and deliver actionable insights.
What Is Web Analytics and Why Does It Matter?
Web analytics refers to the process of collecting and interpreting data that shows how visitors interact with a website. Modern tools like Google Analytics 4 now focus on event-based tracking, providing clearer insights into how users engage, convert, and move through each stage of the customer journey.
These analytics reports give agencies the clarity to identify traffic sources, measure engagement, and make confident, data-driven decisions that drive measurable results.
Rather than guessing what’s working, this data is used to answer critical questions like:
Where is traffic coming from?
Which pages keep visitors engaged, and which ones have higher exit rates?
Are marketing campaigns driving conversions?
Is there any technical issue that’s affecting marketing performance?
Monitoring web analytics empowers your agency to answer these questions. It provides data-driven insights to make any necessary improvements and ensure a client’s website remains in tip-top shape.
With privacy-first analytics and shifting attribution models, understanding how visitors interact and why they convert matters more than ever. Web analytics reporting now connects multiple data points—SEO, ads, conversions, and behavior—to help agencies tie digital activity directly to business outcomes.
What Are Web Analytics Reports?
A web analytics report organizes this key data into a clear, structured format. Instead of presenting a jumble of metrics, it’s a way to deliver actionable insights that clients will easily understand (and appreciate).
Web analytics reports compile website data into organized, visual formats that reveal how different elements of a site contribute to performance. Instead of overwhelming clients with numbers, effective web analytics reporting highlights what matters—where visitors come from, how they engage, and which actions lead to conversions.
Here’s exactly what a strong web analytics report should include.
Section | Description |
|---|---|
Executive Summary | Provide a high-level snapshot of website performance, key findings, trends, and next steps. That way, busy clients grasp the takeaways at first glance. |
Website Performance Overview | Share a breakdown of overall site activity, including traffic trends, user behavior, engagement levels, and site health. |
Key Metrics | Include critical website analytics data such as bounce rate, session duration, page views, conversion rate, and goal completions. |
Data Visualization | Use visual aids like charts, graphs, and pie charts to make data more digestible. Quickly identify trends, compare performance over time, and spot anomalies. |
High-quality web analytics reports also help agencies benchmark success over time, identify weak pages, and evaluate the ROI of campaigns—from SEO efforts to Google Ads performance. With the right data visualization tools, agencies easily communicate progress and keep clients aligned on business goals.
By using web analytics reports, you’ll maintain a consistent format, present data with a professional finish, and build long-term client trust.
Agency Tip: To speed things up, invest in a dedicated reporting tool that offers AI-generated insights. That way, it’s much easier to pinpoint not-so-obvious wins, create narratives between campaigns, detect campaign issues, and share relevant recommendations–all in a few seconds.
Why Some Reports Matter More Than Others
Every client measures success differently. One may prioritize lead generation, while another focuses on average order value or engagement metrics. That’s why one-size-fits-all reporting no longer works.
Modern web analytics reports must be customized—aligning key metrics and insights with each client’s specific goals, campaigns, and date range.
That’s why customization matters. It shows that your agency considers client needs on a case-by-case basis and prioritizes important web analytics metrics, not irrelevant or generic data.
To ensure your reports hit the mark, keep the following in mind:
Focus On Outcomes: Numbers mean nothing without context. Each report should connect website data to key performance indicators, like achieving a specific number of leads or conversions.
Don’t Fall Into the Vanity Metrics Trap: High page views might look impressive, but they don’t always tell the full story. Focus on metrics that provide additional context, like engagement rates, time on page, or conversion rates. That way, clients see real business impact, not just big numbers.
Use Replicable, Customizable Templates: A strong report structure saves time while ensuring consistency. For best results, customize templates based on individual client needs. This keeps reports relevant without starting from scratch each time.
At the end of the day, it isn’t about sharing all the metrics from a web analytics platform.
Instead, highlight relevant data that clients care about. Add context where needed, tie results into business goals, and build a scalable reporting process for best results.
The 7 Most Important Web Analytics Reports
Now that we’ve covered the basics, it’s time to move on to web analytics report examples.
The best part? They’re easy to create in the AgencyAnalytics platform! Create one from scratch, customize an existing template, or even tweak a Smart Report that’s generated in just 11 seconds–simply sign up for a risk-free 14-day trial.
Below are seven must-have web analytics reporting formats that every agency should master. These examples combine clear metrics, meaningful visuals, and contextual storytelling to help clients understand how visitors engage and where to focus optimization efforts next.
1. Website Performance Overview Report
This type of report gives a high-level view of website performance, showing whether traffic is increasing, decreasing, or staying the same.
This is your go-to snapshot for assessing overall site health. A strong overview report highlights total sessions, new users, traffic trends, and conversion rates—making it easy to spot performance shifts or opportunities for improvement.
It details where visitors are coming from, how engaged they are, and whether they’re taking meaningful actions, such as completing a purchase or filling out a form. It’s perfect for monthly web analytics reporting and client presentations.
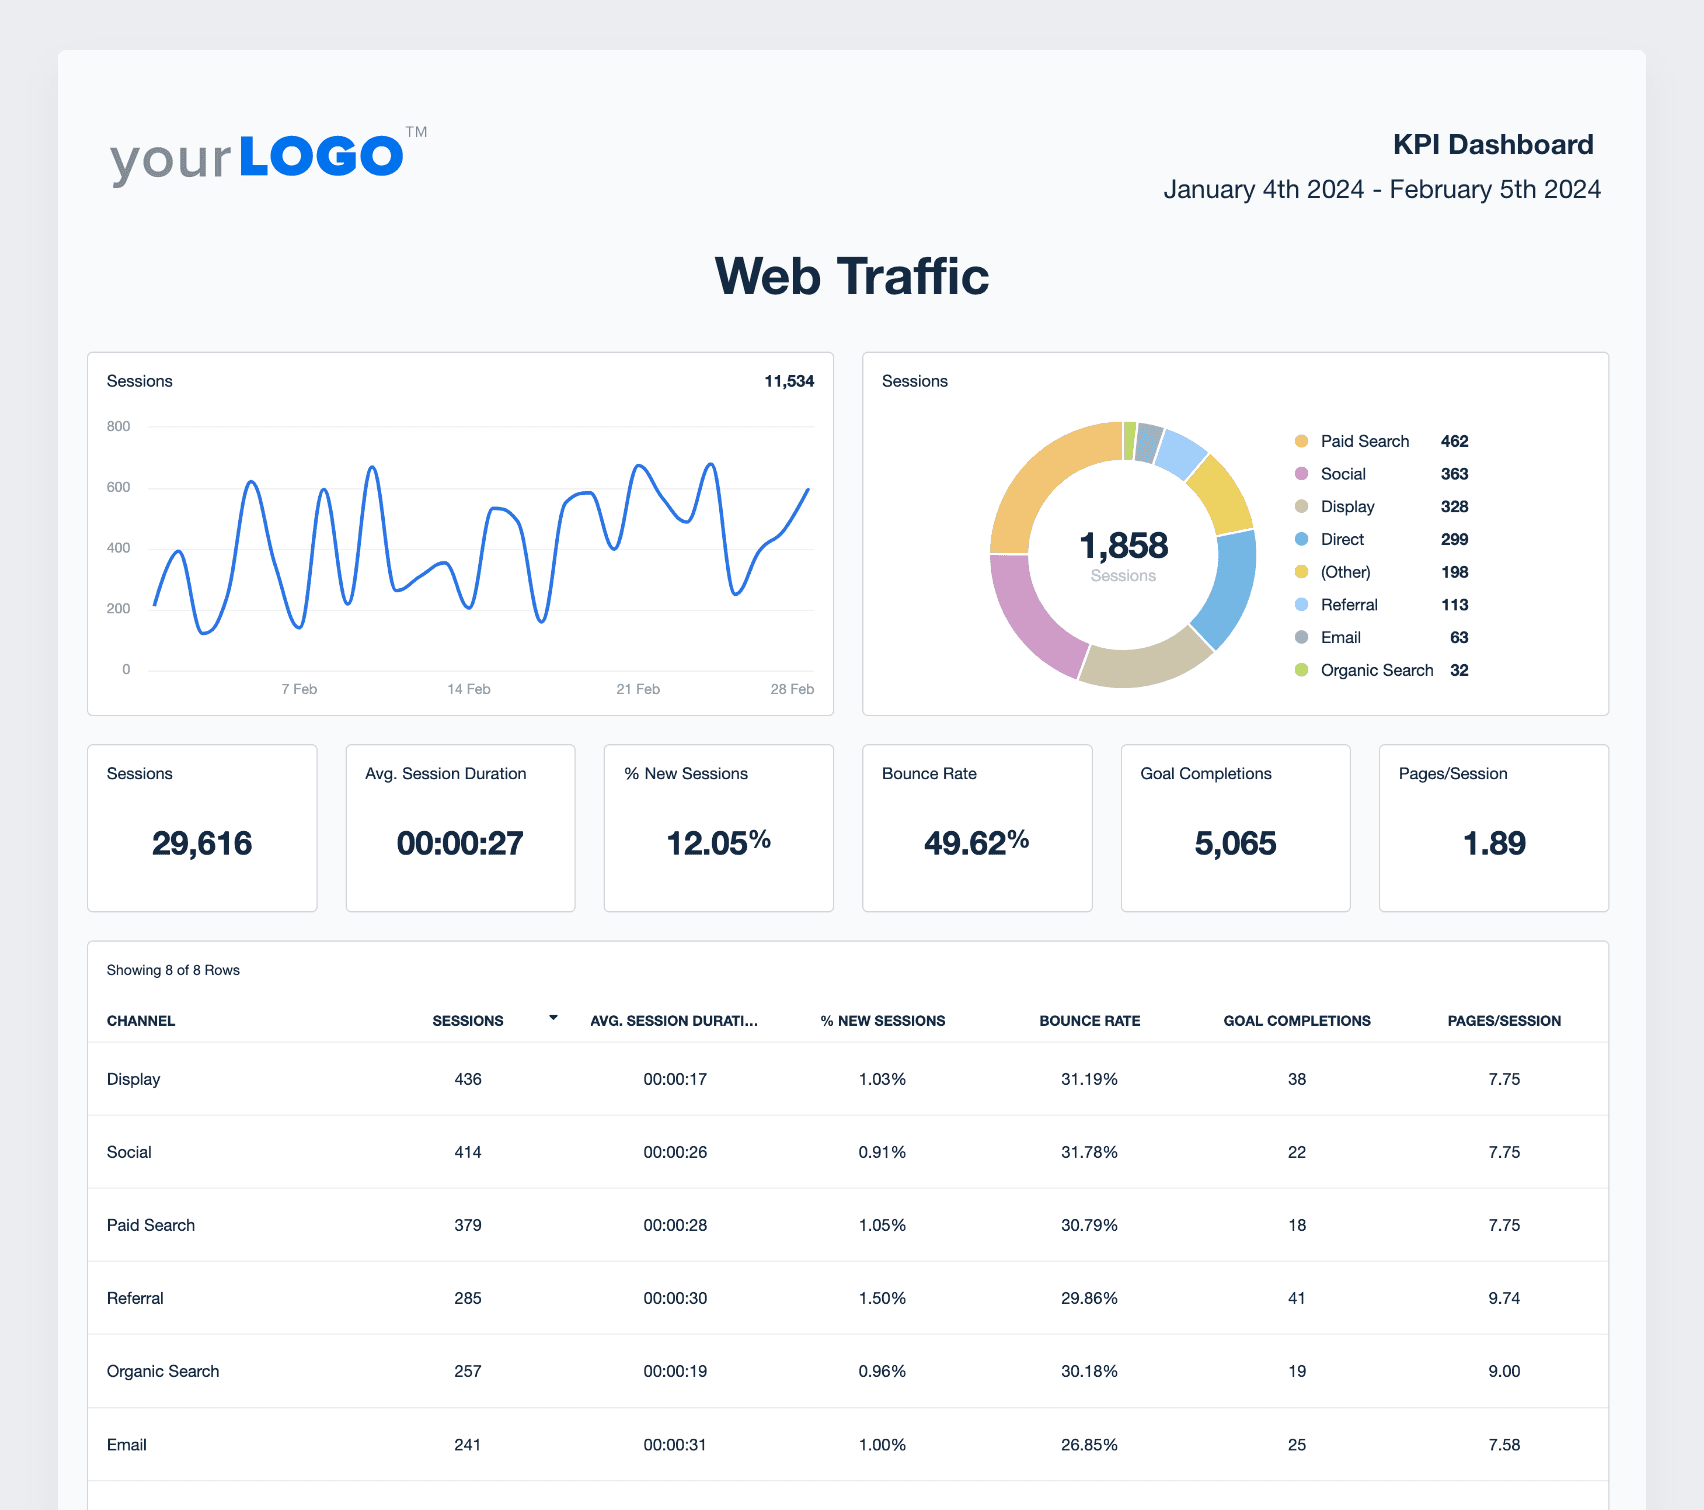
Consolidate metrics across multiple web analytics tools. Create impactful reports, share accurate data, and monitor marketing efforts with ease–try AgencyAnalytics today, free for 14 days.
This format is ideal for monthly reporting, campaign reviews, and identifying traffic trends over time. It also helps diagnose performance issues, such as sudden traffic drops or declining user engagement.
2. Traffic Acquisition Report
Traffic acquisition reports break down exactly where visitors land from—organic, referral, social, paid, or direct channels. They reveal which marketing efforts attract the most engaged users, allowing agencies to prioritize high-performing sources and optimize ad campaigns or content strategies for better ROI.
It also pinpoints which channels drive the most engagement and conversions. With these insights, it becomes easier to focus on what drives visibility and refine what doesn’t.
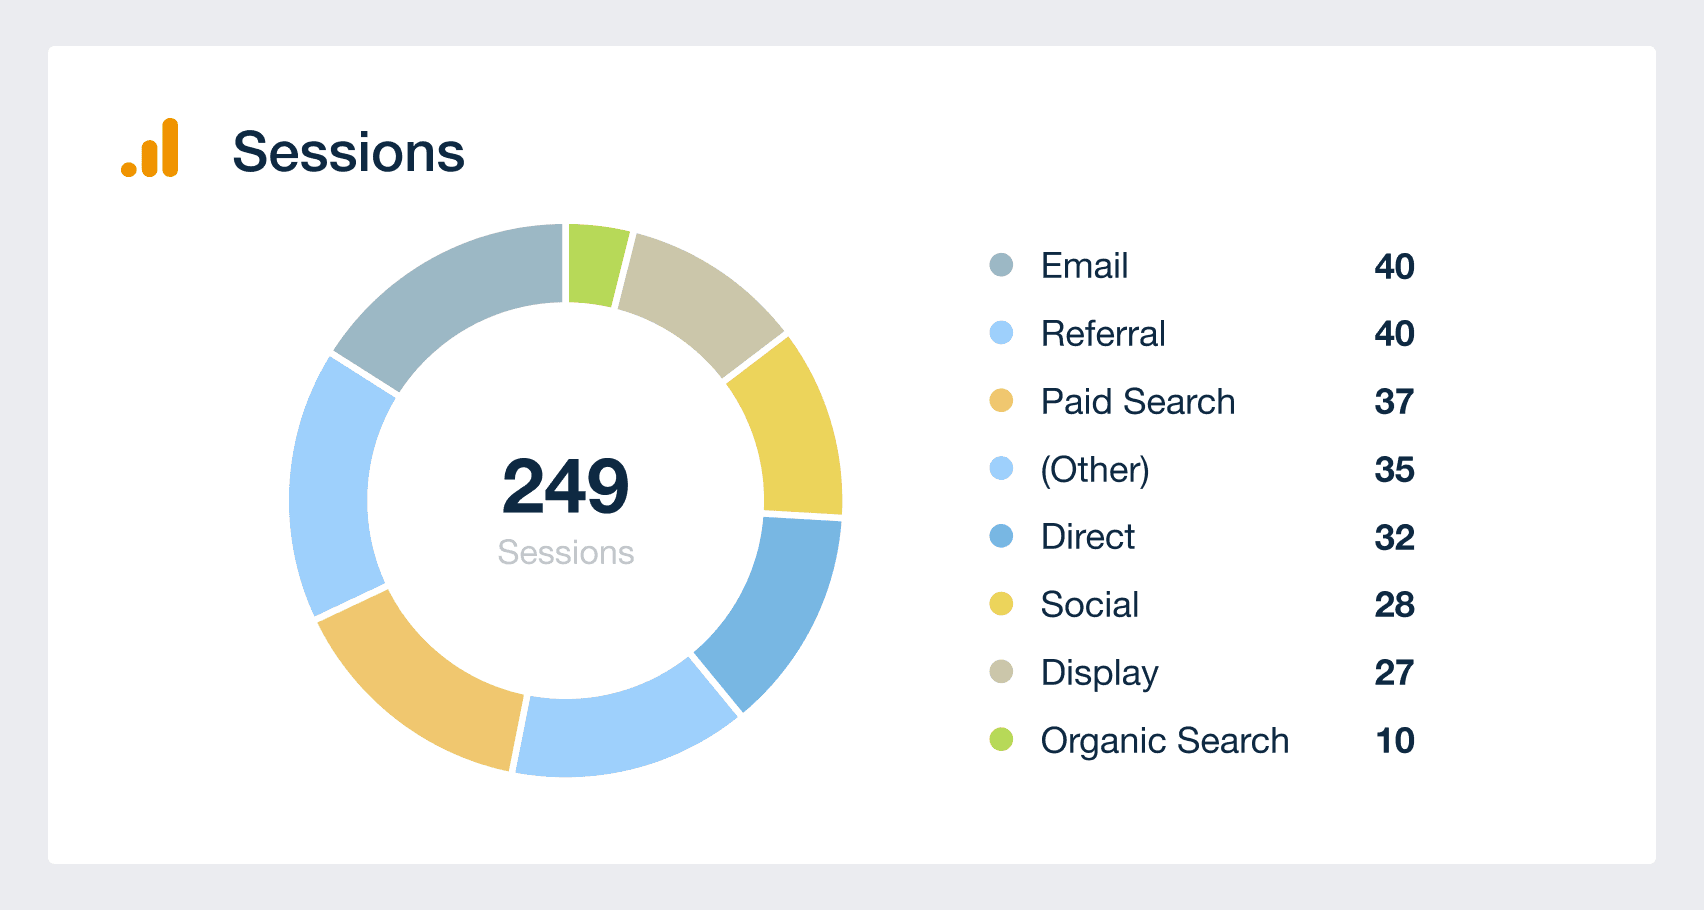
This report format works well for clients looking to increase organic reach, improve paid ad performance, or optimize referral traffic.
It identifies which channels bring in high-value visitors, where drop-offs occur, and whether there’s enough website traction.
3. User Behavior Report
Once visitors land on a client’s website, their next steps are just as important as how they got there.
This report identifies what attracts the most traffic, which content types keep visitors engaged, and how many users exit a specific page. Use this data to improve weak pages and address UX issues (e.g., slow load times could lead to higher bounce rates).
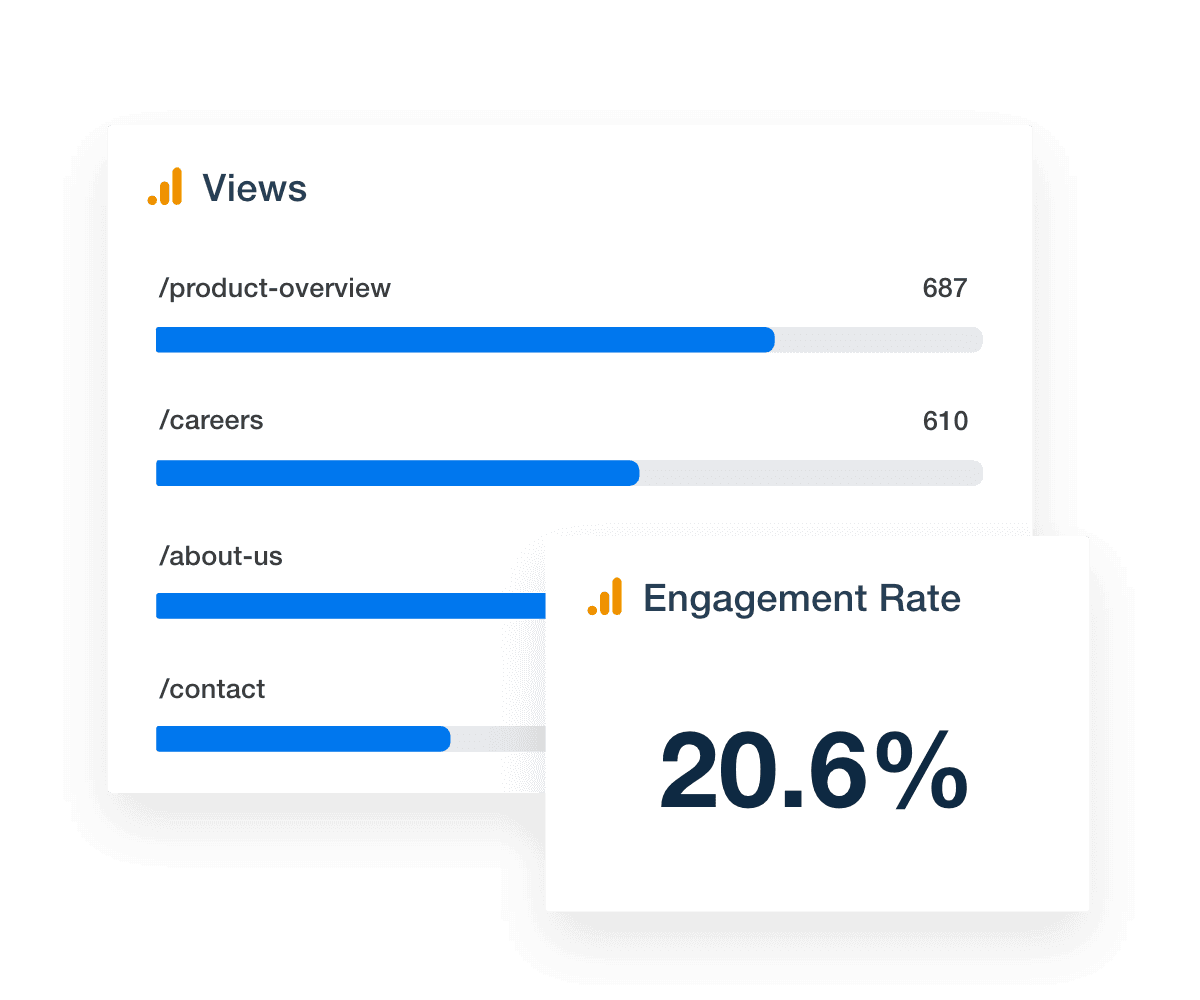
The user behavior web analytics report focuses on how visitors interact with your client’s website once they arrive. It highlights navigation paths, engagement time, and drop-off points—providing insight into which content keeps users engaged and which pages need optimization. By pairing behavior data with engagement metrics like scroll depth or event completions, agencies can identify weak pages and refine the user experience.
This report type is useful when your client’s site attracts website visitors who don’t become leads or follow through on conversions.
It’s also handy before a website redesign–pinpoint which pages need improvement and identify the ones that are already performing well.
4. Conversion and Goal Tracking Report
Most times, clients expect engagement to drive tangible business results.
A goal tracking report measures how effectively visitors complete key actions—purchases, sign-ups, or lead submissions. With custom dashboards, agencies monitor conversion funnels and pinpoint friction points that slow performance. This web analytics report example ties site behavior directly to revenue impact and provides data-driven clarity to scale what works.
This type of report shows what’s driving conversions and whether there may be potential bottlenecks in the customer journey.

This report is ideal for clients focused on conversion metrics, revenue targets, or other user interactions (like completing event sign-ups). Use this data to identify which channels bring in high-value leads, spot friction points in the sales funnel, and help clients reach their business goals.
5. Landing Page Performance Report
Speaking of landing pages, some drive conversions… while others fall short.
Landing page reports reveal how individual pages contribute to conversions and engagement. They combine data-driven insights like bounce rate, average time on page, and conversion percentage. By examining how visitors interact with different CTAs or form placements, agencies continuously refine page design to meet business goals and boost average order value. This report, with built-in paid search analytics, identifies what’s working—like strong messaging, design, or CTA placement—and where tweaks are needed to boost performance.
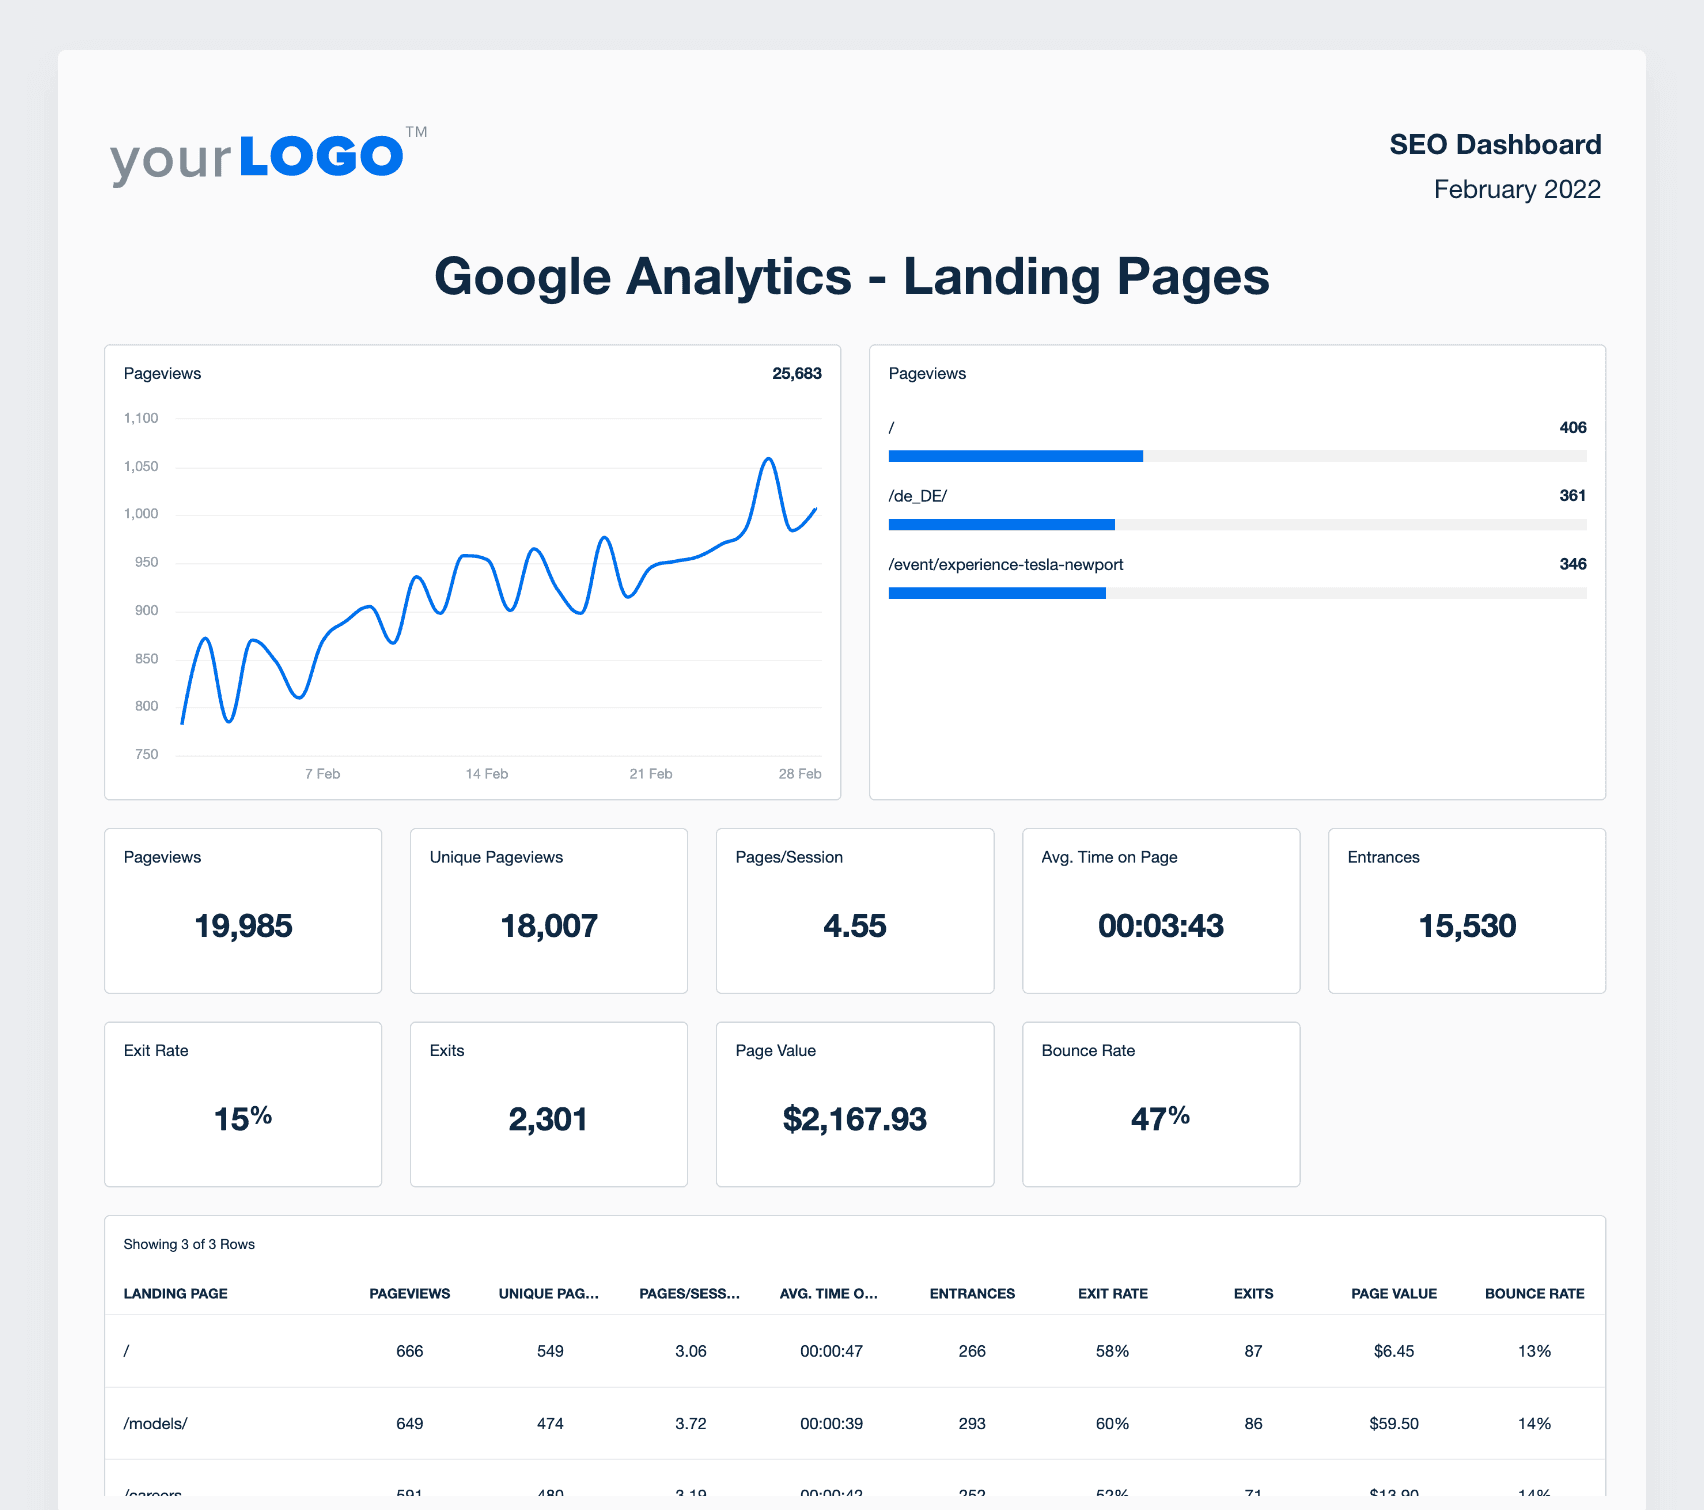
Stream landing page data from your client’s Google Analytics account into a professional, readymade report. Explore everything AgencyAnalytics has to offer–sign up for a free 14-day trial. Use this format when clients rely on landing pages for lead generation, product promotions, or paid ad campaigns. Assess whether a page is effectively converting website visitors–if not, it could mean optimizations are needed (like adding more CTAs).
6. Search Visibility Report
This report tracks visibility and rankings across organic search. It provides an overview of keyword positions, impressions, and click-through rates to measure how SEO efforts influence traffic and visibility. Agencies use this analytic report to connect search performance with content strategy and demonstrate tangible progress toward higher visibility in SERPs.
Opt for this report type if you’re tracking visibility trends over time or trying to determine whether impressions lead to actual traffic. It’s especially useful for evaluating content performance after algorithm updates or other external shifts.
7. Audience Demographics Report
Different audiences interact with a website in different ways.
Audience reports segment users by demographics, location, and device type—helping agencies understand how different audience groups engage. This web analytics reporting format is especially useful for refining ad targeting or personalizing content for new users.
It’s one of the best ways to uncover deeper insights and align campaigns with real user behavior. More specifically, this report will reveal how various groups engage with content and navigate the site.
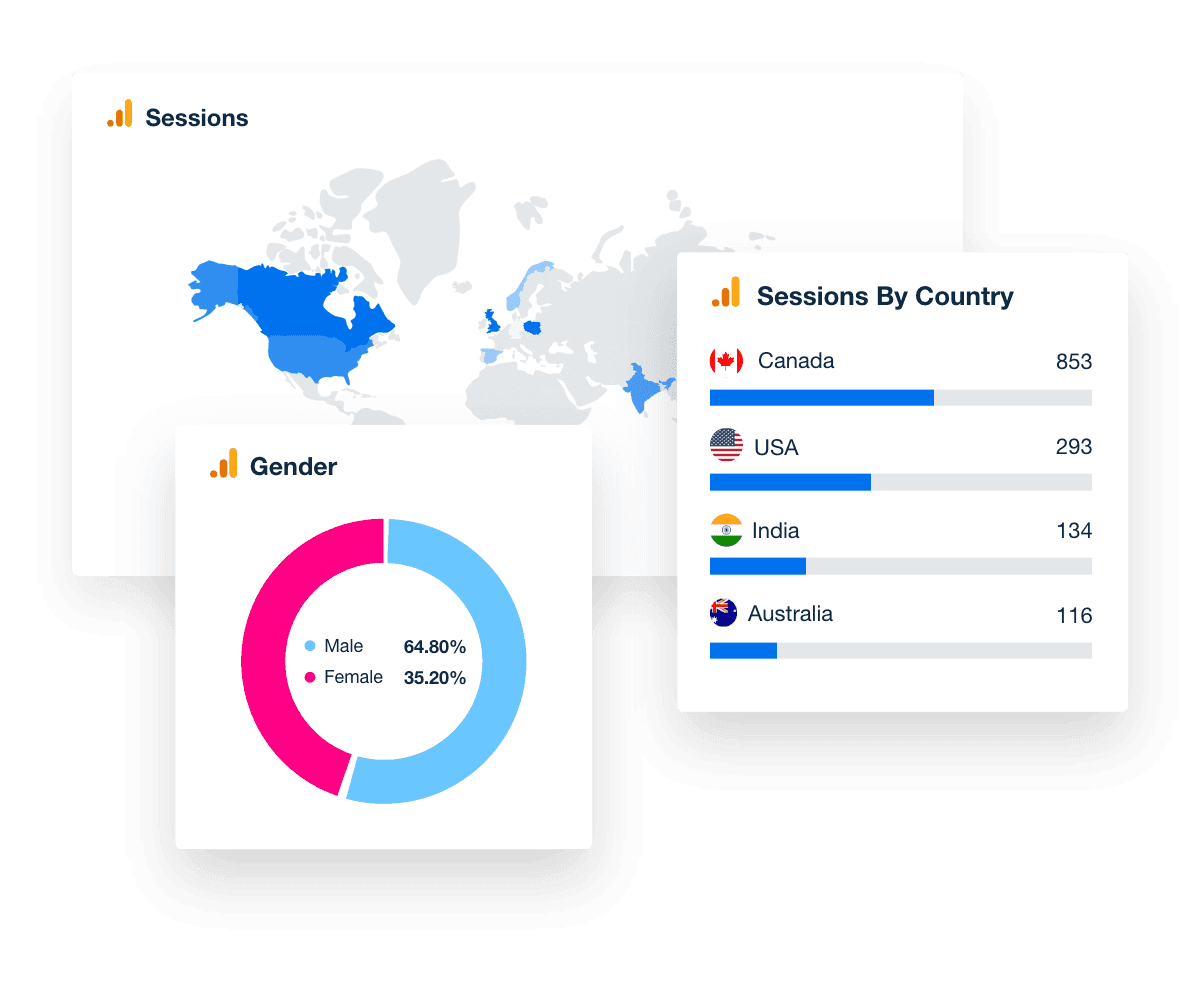
Digging deeper into visitor data is powerful—it may highlight engagement gaps and uncover opportunities to refine targeting. Additionally, this report type is useful for clients who are targeting new markets or exploring untapped segments.
5 Web Analytics Report Examples
Now that we’ve covered examples of web analytics reports, it’s time to explore some handy pre-built options.
Here are five ready-to-use web analytics report examples inside the AgencyAnalytics client reporting platform. Each one helps agencies create consistent, professional reports that transform complex data into simple, visual stories clients understand instantly.
All templates are customizable and integrate directly with 80+ platforms—Google Analytics, Google Ads, and social media included—so agencies build reports faster and act on data-driven insights sooner.
1. Web Analytics Report — All-in-One Web Performance Overview
It doesn’t get more straightforward than this.
The Web Analytics Report Template makes it easy to analyze user behavior, visualize data, and track essential metrics—all in one place. From device usage to user acquisition sources, deliver detailed insights in an intuitive and well-organized format.
The response from our clients has been overwhelmingly positive. They appreciate the convenience of having data from Google Analytics, Google Search Console, and search engine rankings in a consolidated format. This eliminates the hassle of logging into multiple platforms and navigating through complex interfaces.
Alexa Rees, SEO Manager, seoplus+
This foundational template provides a single view of all website metrics—traffic, engagement, acquisition, and conversions. It automatically pulls data from multiple sources into one custom dashboard, eliminating the need for manual reporting.
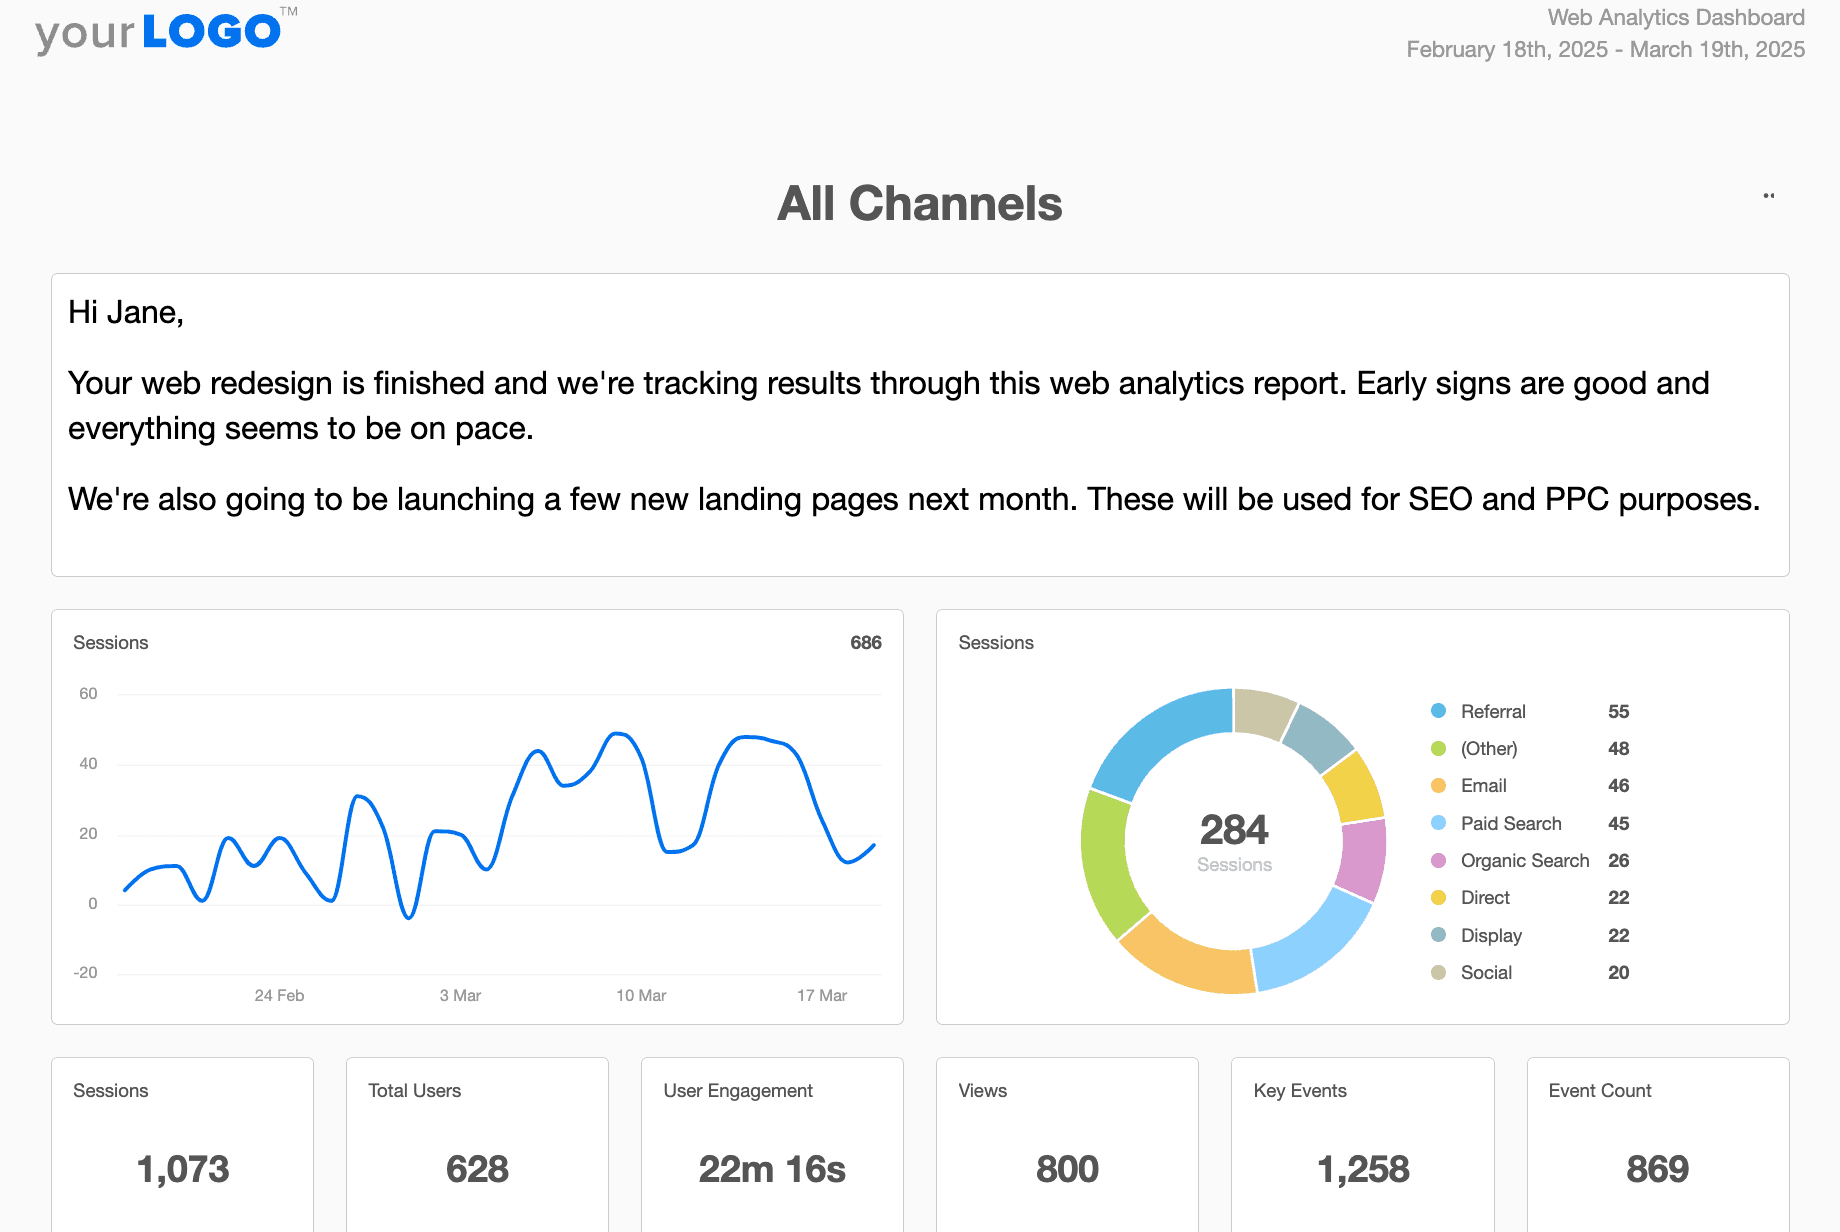
Easily report on:
User Acquisition Sources: Track where new users are coming from, including organic, paid, social, and referral traffic.
Device Types: Identify how traffic differs between mobile, desktop, and tablet users.
Organic Search Insights: Assess search engine performance, keyword visibility, and ranking trends.
Event Counts: Monitor key user interactions, such as button clicks, video plays, and form submissions.
Present insights in a way clients actually understand—all with a Web Analytics Report that pulls data in one place. Ready to customize this free template in AgencyAnalytics (or any of the ones we’re about to share? Sign up for a risk-free 14-day trial.
2. Google Analytics Report — Deep Dive Into Web Metrics
When it comes to tracking web performance, there’s nothing quite like a Google Analytics Report. It’s often the go-to platform for monitoring organic traffic numbers, assessing audience behavior, and even tracking conversions.
GA4 is now the standard for web analytics, and this report template brings its event-based model to life. Easily visualize how visitors interact, track conversions, and evaluate campaign performance in one place. GA4 data integrates seamlessly with other platforms, making it ideal for comprehensive analytics reporting.
The way metrics are laid out and displayed on AgencyAnalytics is much easier for the client to digest, as opposed to viewing them directly on an intricate platform like Google Analytics. It gets the point across without forcing the client to get too into the weeds.
Jessica Weiss, Director of Marketing & Strategic Partnerships, One Firefly
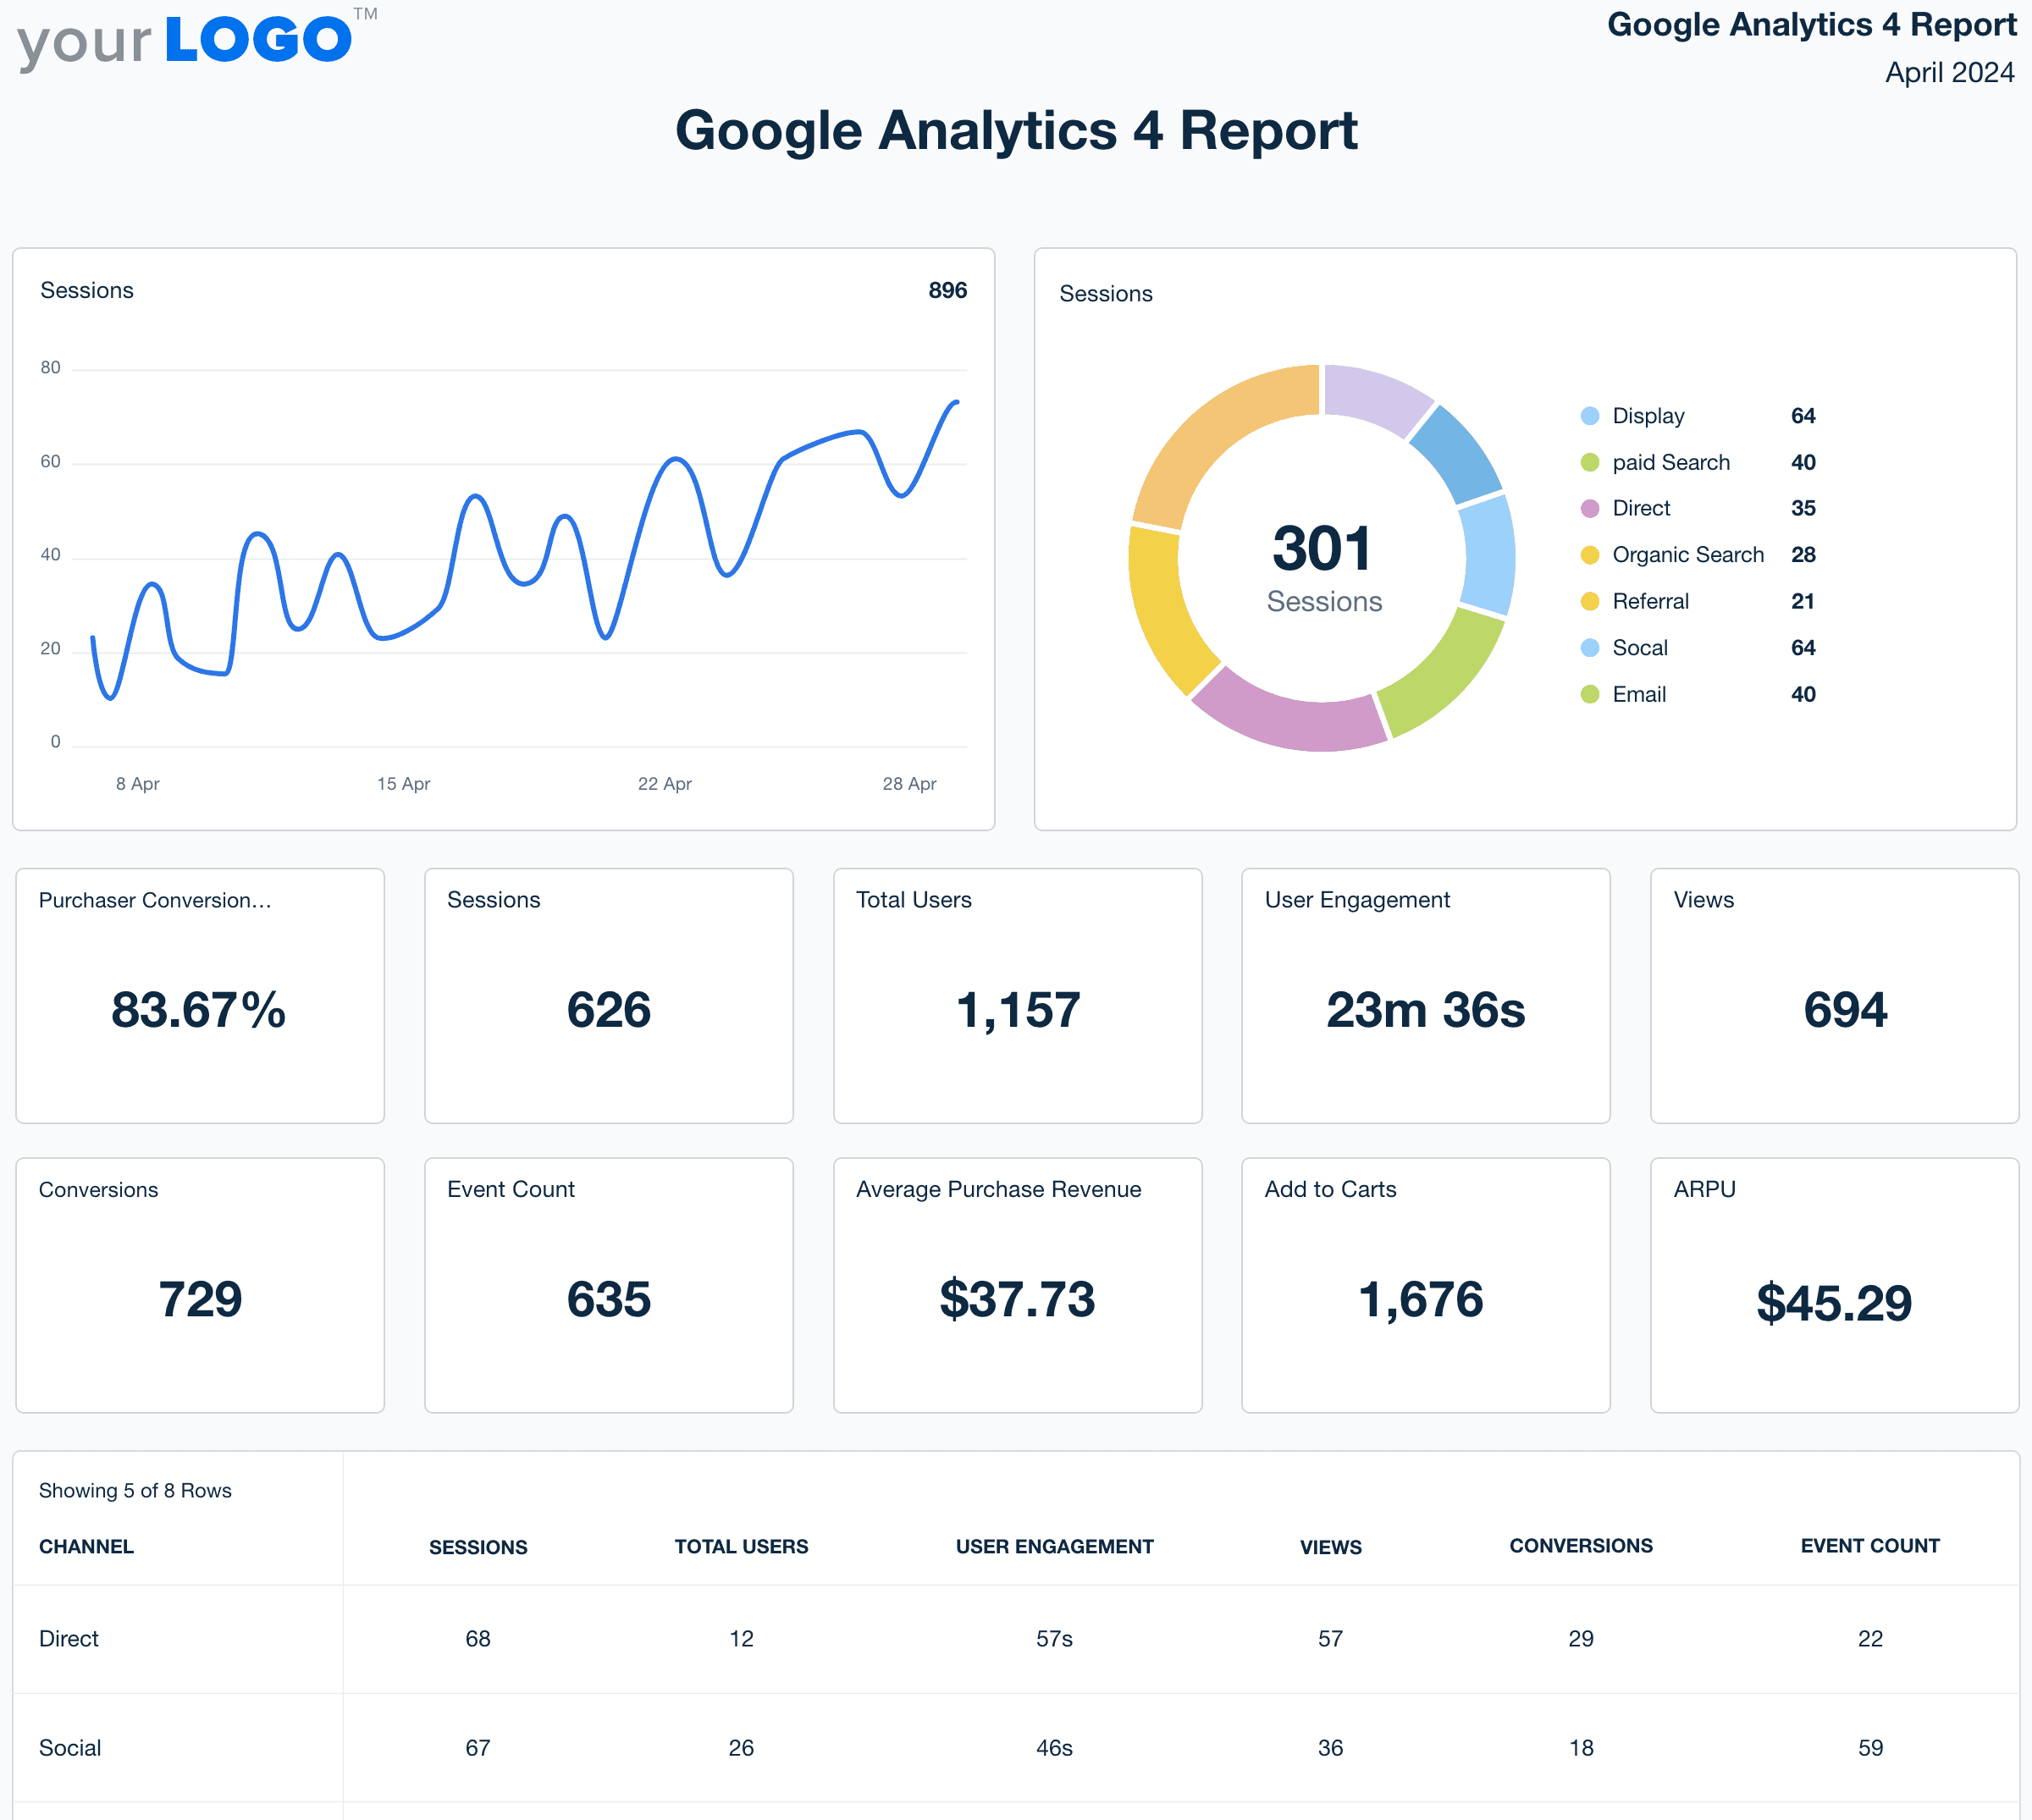
If your client prioritizes Google Analytics metrics, use this format to report on:
Users by Channel: Understand where visitors are coming from and which sources drive the most web traffic.
SEO Insights: Track organic traffic numbers, unique visitors, keyword rankings, average session duration, and more.
Engagement Metrics: Analyze bounce rates, session durations, and interactions to gauge user interest.
Traffic Data: Break down organic, paid, direct, and referral traffic to see what’s working.
Want to share data from related campaigns, like Google Ads or Facebook? Customize this report with metrics across 80+ data sources in just a few clicks.
3. SEO Report — Showcase Search Visibility and Growth
Need an overview of your client’s SEO efforts that go beyond Google Analytics? No problem!
This template highlights SEO performance metrics, including search visibility, backlinks, and keyword performance. Agencies use it to show progress in organic traffic, reveal ranking improvements, and align optimization strategies with client goals.
Use this SEO report to track search visibility, keyword rankings, and the overall impact of optimization efforts.
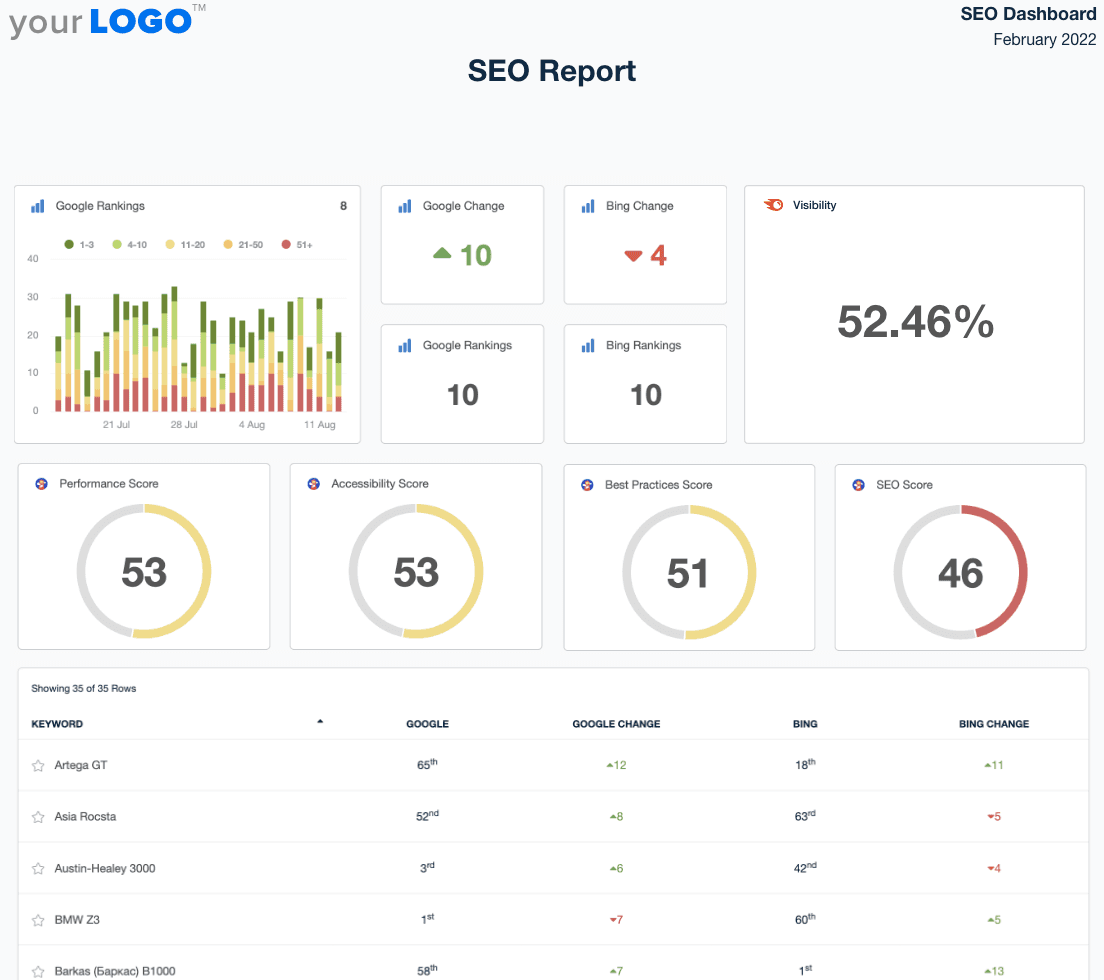
Track web analytics metrics, backlink data, and more. Customize this template in the AgencyAnalytics platform–sign up for a free 14-day trial today.
More specifically, it’s a handy way to report on:
SERP Positions: Track ranking shifts on search engines like Google and Bing.
Backlink Profile Changes: Easily integrate key backlink insights from platforms like Majestic. Monitor new and lost links, Trust Flow scores, and more.
Technical SEO Issues: Identify crawl errors and potential sitemap issues that could compromise search rankings.
Keyword Performance: Analyze which keywords are gaining traction and where improvements are needed.
These insights should be used to showcase SEO success, diagnose website-related issues, and refine your client’s marketing strategy.
4. Keyword Ranking Report — Pinpoint High-Value Keyword Opportunities
Go beyond search engine rankings and show which keywords are driving results.
Keyword ranking reports provide a focused view of performance across specific search terms. Track keyword movements, identify content opportunities, and understand which landing pages capture the most valuable traffic.
Use the Keyword ranking report to share granular keyword insights, assess overall search visibility, and identify high-performing web pages. That way, clients will know where to focus SEO efforts for maximum impact.
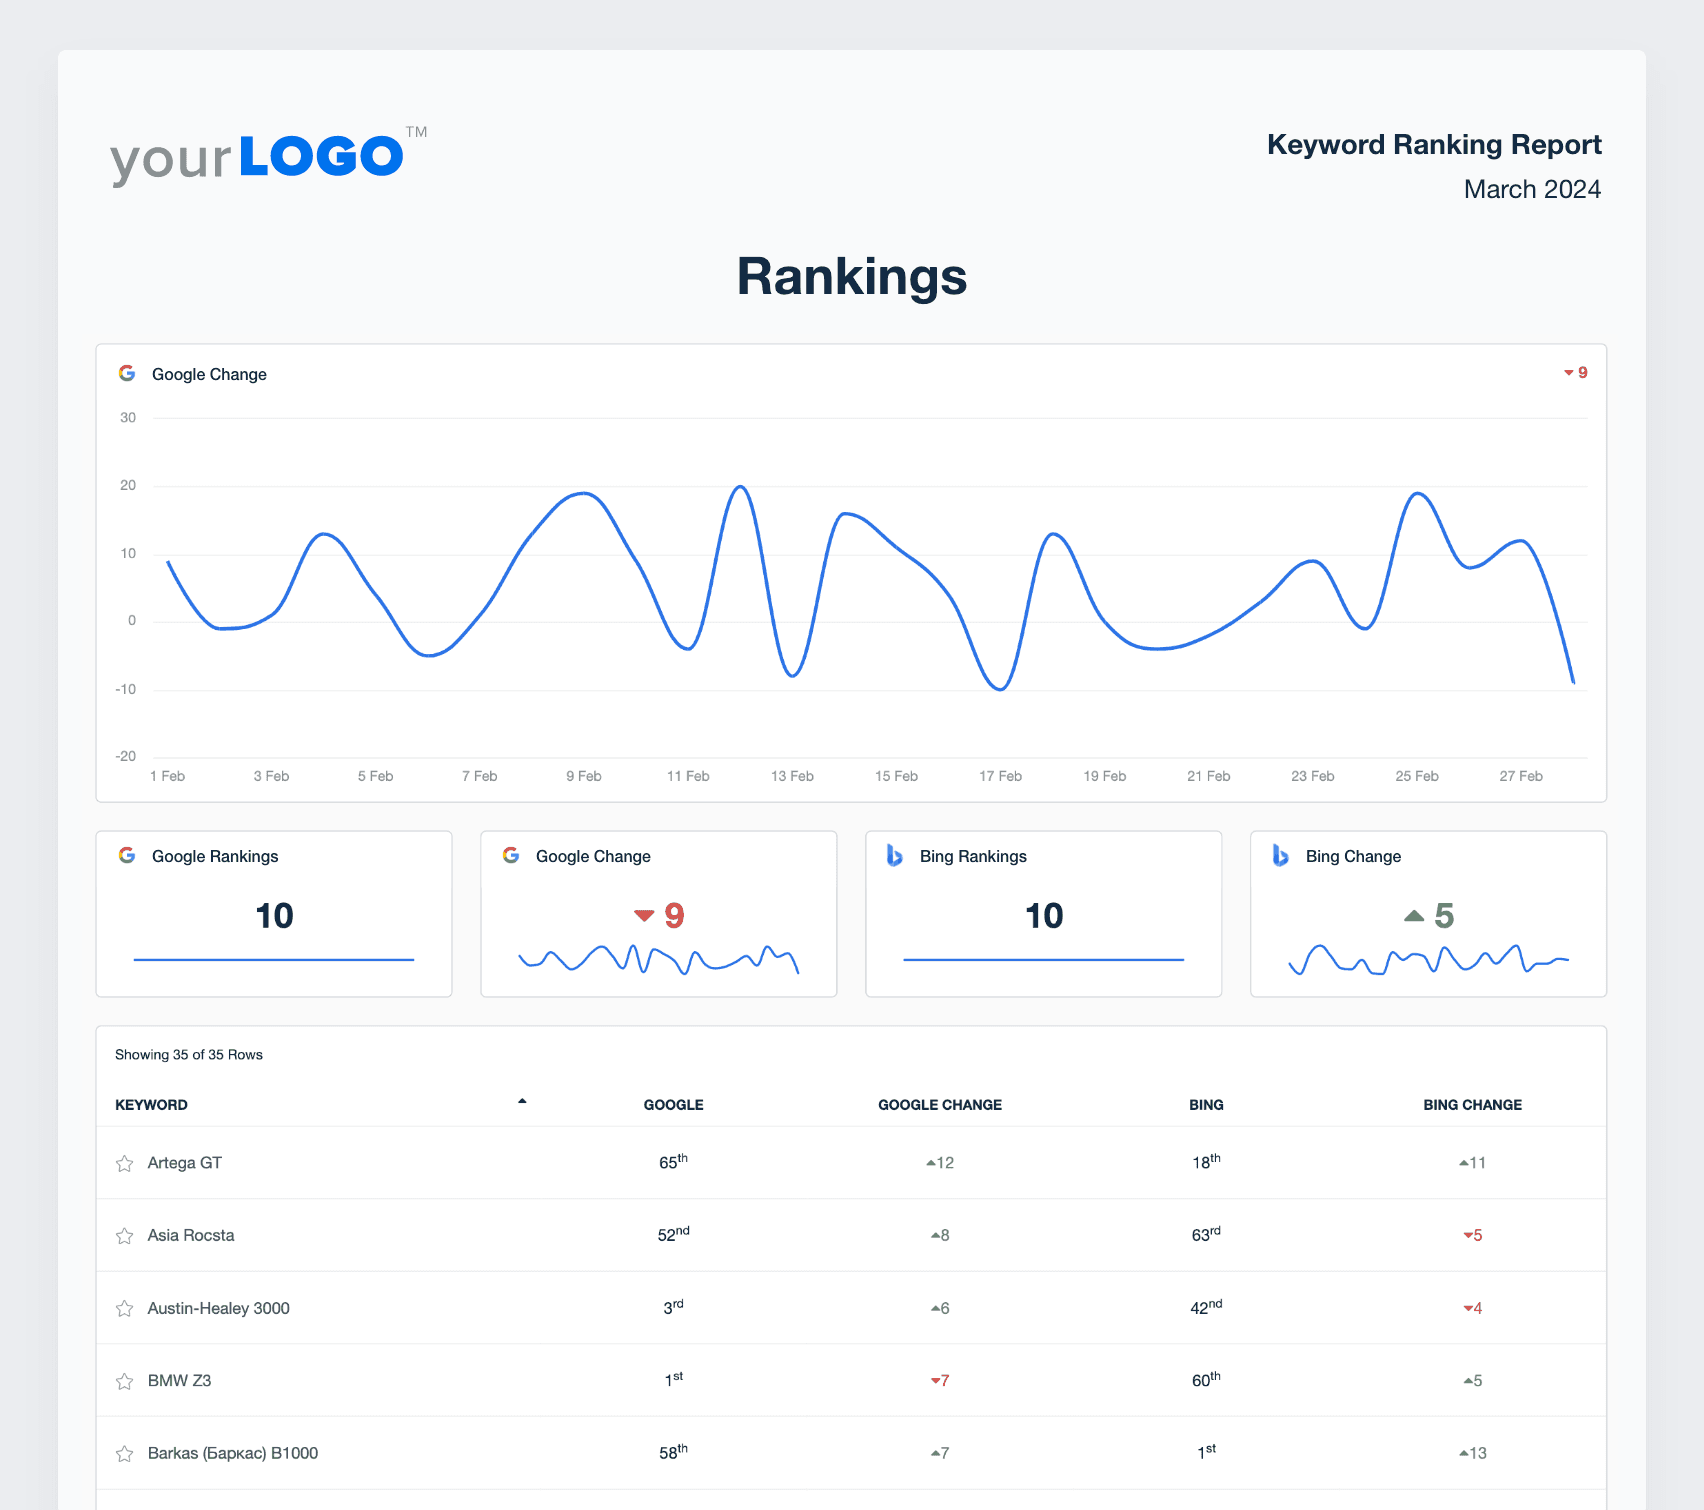
More specifically, this report digs deeper into:
Search Engine Rankings: Track keyword positions across Google and Bing.
Top-Performing Pages: Identify which pages are ranking highest and driving the most organic traffic.
Ranking Trends Over Time: Monitor fluctuations in keyword positions and evaluate the impact of SEO efforts.
Mobile Rankings: Understand whether rankings are different for mobile users, which could mean optimizations are needed (e.g., creating an improved UX).
By honing in on keyword performance, you’ll ensure SEO efforts are directed where they matter most.
5. Client Report - Showcase Your Agency's Multi-Channel Performance
Managing campaigns across multiple platforms? No worries!
This multi-channel analytics report brings together SEO, PPC, social, and email performance in one unified format. It supports data-driven decisions by aligning every campaign metric with the client’s core business goals.
Use the Client Report template to combine key performance metrics across SEO, PPC, social media, and more. It’s a streamlined way to track progress, measure impact, and keep clients informed–all without sifting through multiple reports.
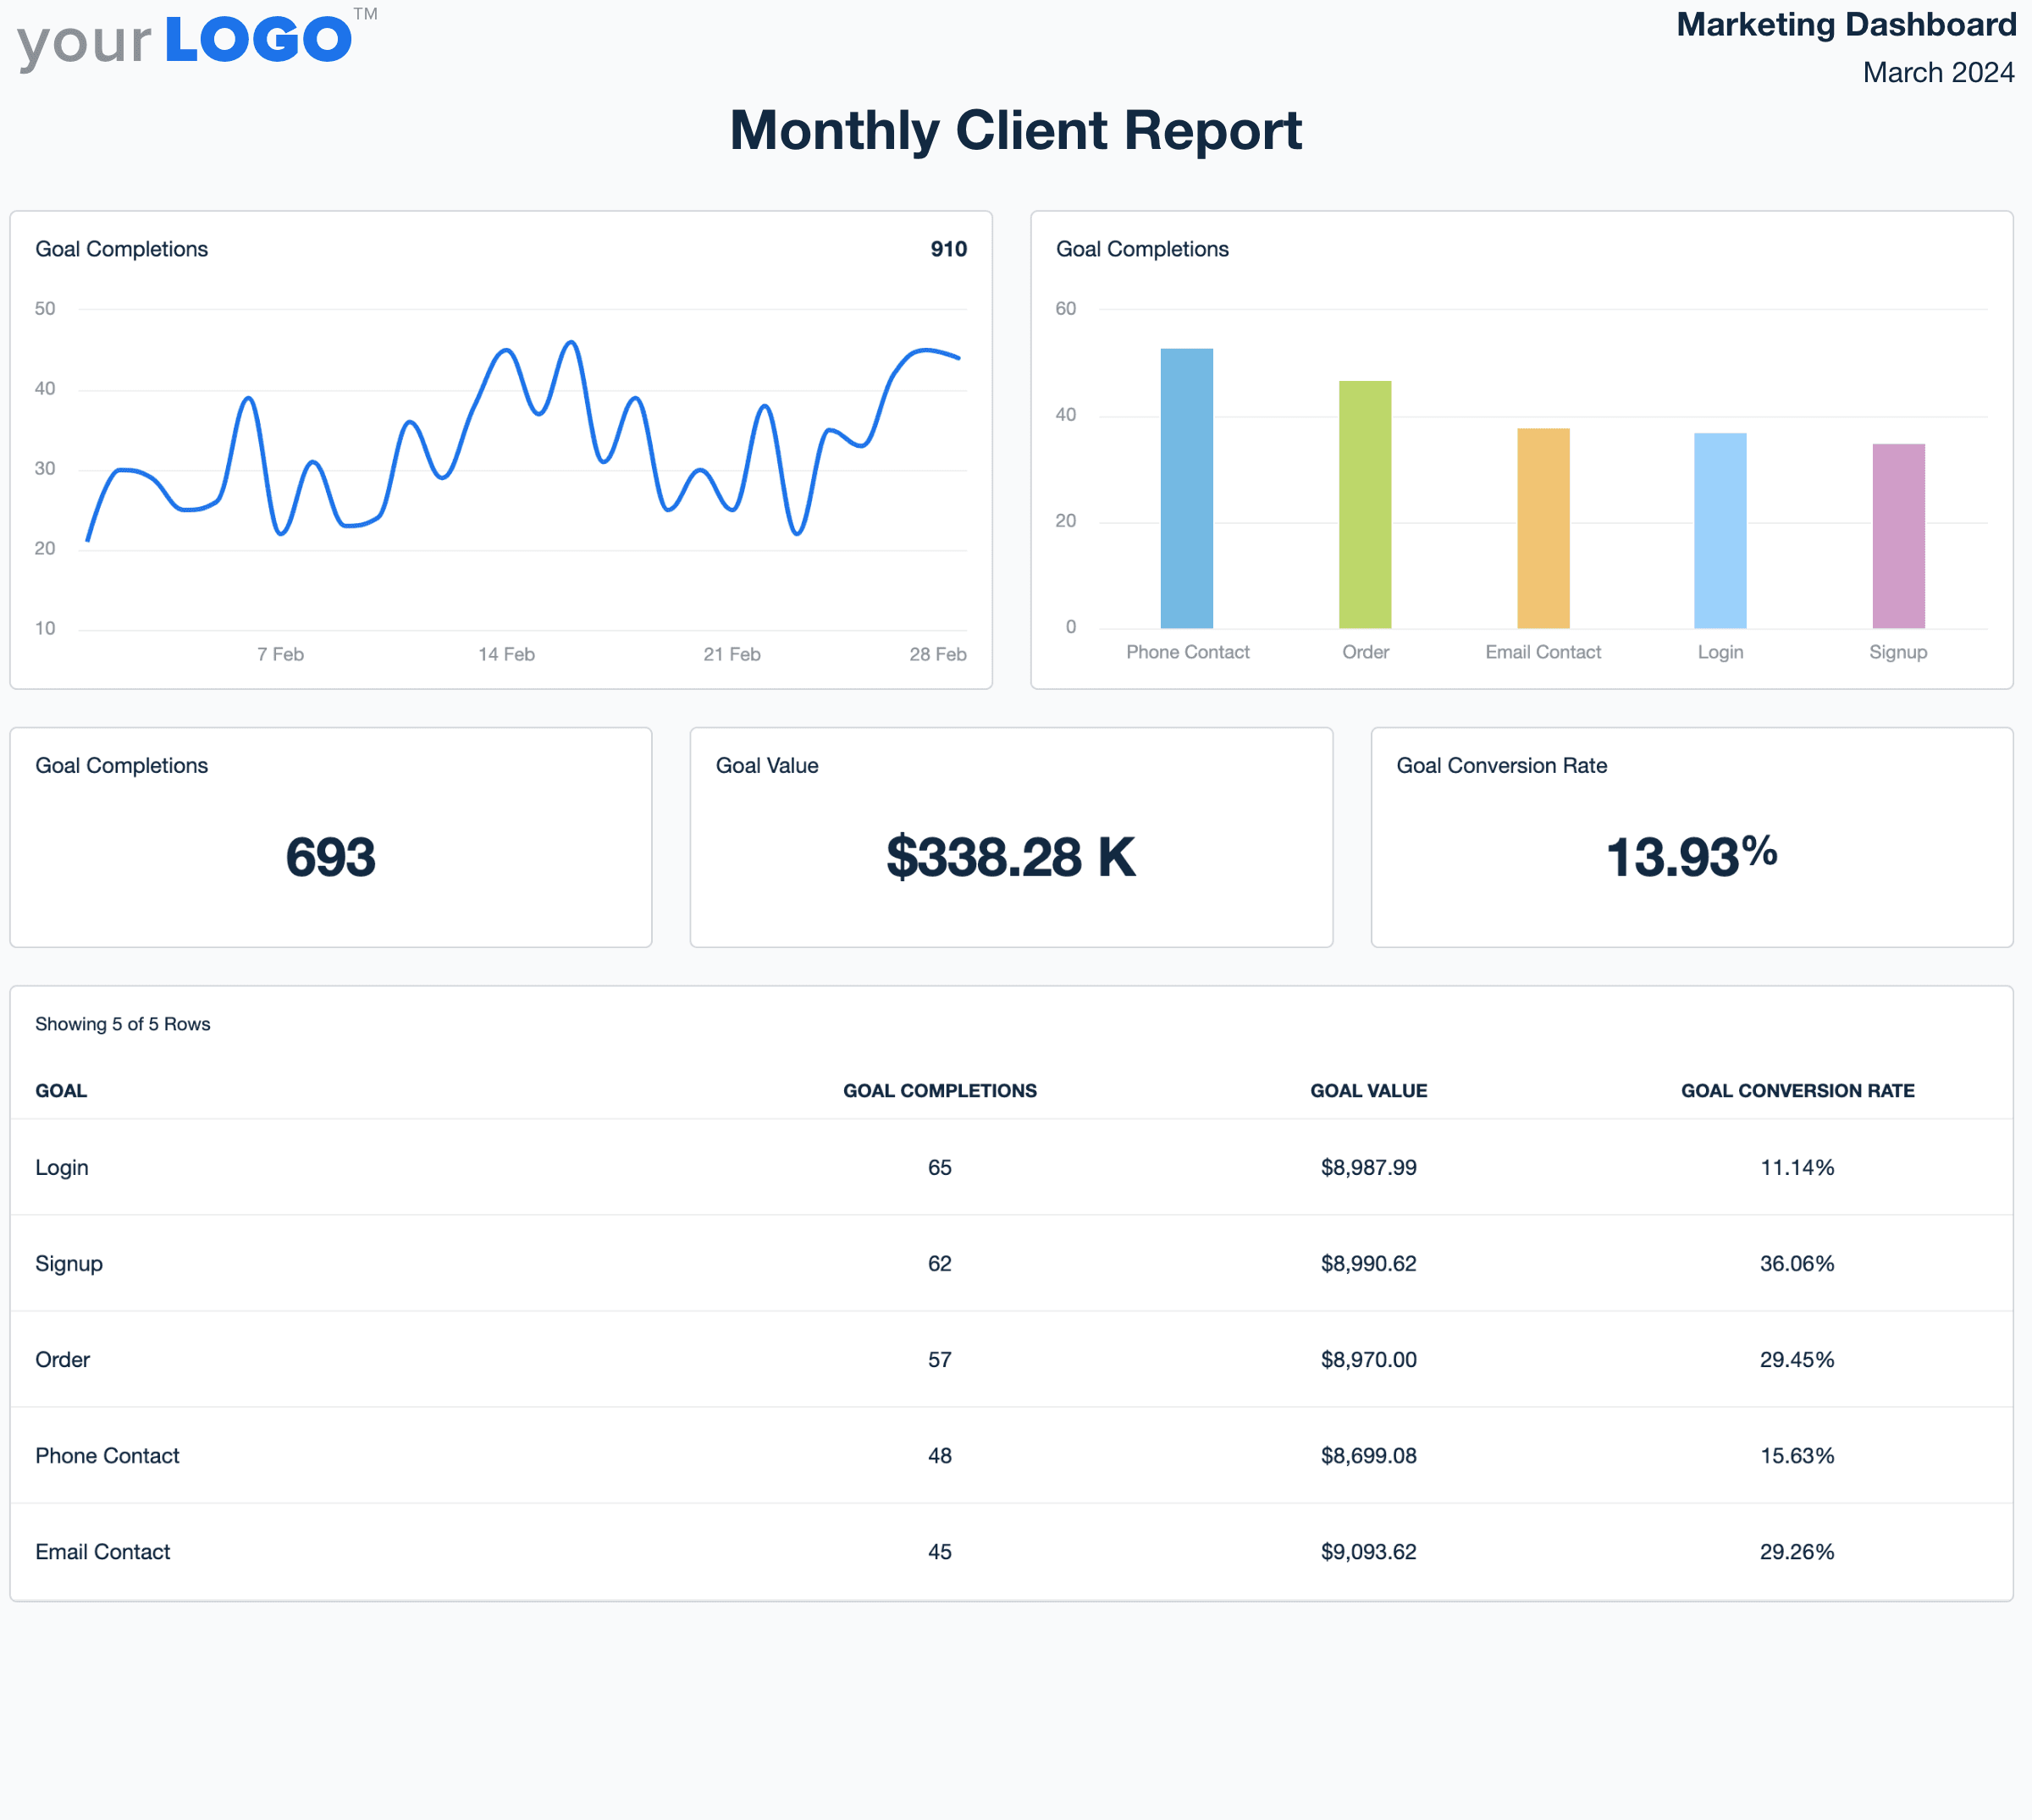
Use this customizable template to share:
User Acquisition Sources: Break down where traffic and leads are coming from, including organic, paid, and referral channels.
PPC Ad Performance: Report on ad impressions, clicks, cost per acquisition (CPA), and return on ad spend (ROAS).
Social Media Insights: Analyze engagement, follower growth, and referral traffic from various social platforms.
Email Marketing Metrics: Highlight open rates, click-through rates (CTR), and conversions from email campaigns.
Agency Tip: Got additional data to include (e.g., your client’s budget forecast or metrics from an advanced platform like Adobe Analytics)? Export these insights in Google Sheets and easily import them into AgencyAnalytics. That way, you’ll have everything you need in one place.
Compress Reporting Time With a Website Analytics Report Template
Web analytics should simplify decision-making, not complicate it.
Manual reporting slows agencies down and increases the risk of human error. With AgencyAnalytics’ automated web analytics report templates, agencies generate accurate, professional reports in minutes—turning data into decisions without the manual grind. Use a pre-built web analytics report template, create custom reports, and much more. Even flip a dashboard template into a downloadable report!
Custom dashboards, automated scheduling, and AI-driven insights make it easier than ever to monitor website metrics, visualize performance trends, and provide real-time updates. Agencies using AgencyAnalytics save hours per week while giving clients a complete view of marketing impact across every data source.
AgencyAnalytics report templates have significantly reduced the time required to create reports for our clients by 5X. After integrating Google Ads, Google Search Console, or any other of the dozens of platforms that connect with AgencyAnalytics, you can create a report in less than a minute that's ready to send to a client right away.
Graham Lumley, Director of Growth Marketing, Blackhawk
Say goodbye to manual reporting and hello to efficiency and data accuracy. Try AgencyAnalytics by signing up for a free 14-day trial.
Impress clients and save hours with custom, automated reporting.
Join 7,000+ agencies that create reports in under 30 minutes per client using AgencyAnalytics. Get started for free. No credit card required.
Already have an account?
Log inFrequently Asked Questions About Web Analytics Reports
Turn complex data into clear, client-ready insights with smarter web analytics reporting.
A great web analytics report includes metrics like traffic sources, engagement rate, conversion data, and audience demographics. It should also feature visualizations—charts, graphs, and summaries—to highlight performance trends.
The goal is to connect metrics to actionable insights, so clients clearly see how visitors interact and where campaigns succeed or need refinement. Including annotations for major campaigns or date range shifts adds context for better decision-making.
Web analytics reports provide a structured way to translate performance data into strategy. By comparing KPIs across traffic channels, landing pages, and campaigns, agencies identify where users engage most and what drives conversions.
This clarity supports data-driven decisions, allowing marketers to allocate budget more effectively, refine SEO efforts, and optimize underperforming areas—all while keeping business goals front and center.
A web analytics dashboard displays live metrics in real time, while web analytics reports summarize performance across a defined date range. Reports often include narrative context and analysis—perfect for clients—whereas dashboards are better for internal monitoring and optimization, or when clients want to dive deeper into the metrics.
Using both gives agencies the best of both worlds: ongoing visibility and client-ready reporting that tells a clear story about campaign success.
Most agencies deliver web analytics reports monthly to track trends over time, but weekly or quarterly updates also work depending on client goals and campaign activity. The key is consistency. Frequent reporting builds transparency and helps agencies make timely, data-driven adjustments while clients see steady progress toward KPIs and business goals.
Inaccurate data often happens because of simple copy-and-paste errors, broken Excel formulas, tracking codes that fail, or filters that aren’t applied consistently. Attribution settings misaligned across tools also distort results. To maintain clean reporting, agencies should standardize tagging methods, define clear time periods for comparison, and regularly audit integrations.
Using an automated web analytics reporting platform removes manual work and prevents data discrepancies from broken connections. This ensures consistent accuracy when analyzing historical data or comparing results across campaigns. Reliable data helps agencies identify patterns confidently, uncover deeper insights, and deliver reports clients can trust.
Looking only at the past month can miss valuable long-term insights. Historical data allows agencies to identify patterns over multiple time periods, compare campaigns, and understand seasonality or behavioral shifts. This deeper understanding reveals whether recent performance spikes are sustainable or part of broader trends.
Automated analytics reports make it easy to compare metrics side by side—traffic, conversions, or ad spend—across multiple intervals on one page. With this full journey perspective, agencies gain the clarity needed to plan smarter campaigns and make lasting improvements in performance.
Web analytics reports don’t just explain what happened—they reveal where performance is heading. By analyzing historical data, agencies identify patterns in traffic, engagement, and conversions to forecast future outcomes more accurately.
Combining these insights with AgencyAnalytics’ Benchmarking feature helps you compare performance across industries, set realistic KPIs, and uncover opportunities for growth.
Then, use Forecasting tools to project key metrics like traffic, leads, or conversions based on past trends and current campaigns. These advanced features turn analytics reporting into a forward-looking strategy tool—helping agencies anticipate changes, plan smarter budgets, and guide clients toward sustainable long-term success.

Written by
Faryal Khan is a multidisciplinary creative with 10+ years of experience in marketing and communications. Drawing on her background in statistics and psychology, she fuses storytelling with data to craft narratives that both inform and inspire.
Read more posts by Faryal KhanSee how 7,000+ marketing agencies help clients win
Free 14-day trial. No credit card required.


