Serviceable Obtainable Market (SOM)
Identify Target Market
Use SOM to define potential customers within a specific market segment.
Set Realistic Goals
Estimate achievable market share to guide marketing strategies and sales plans.
Support Business Strategy
Integrate SOM into business models to align with revenue growth potential.
Showcase Client ROI
Demonstrate SOM insights in client reports to highlight revenue potential and market reach.
Why Serviceable Obtainable Market Is Important
Serviceable Obtainable Market is key for defining a business's realistic revenue potential within its target market. Unlike broader measures such as Total Addressable Market (TAM), SOM provides actionable insights by narrowing the focus to what a business can realistically achieve based on resources, distribution capabilities, and competitive positioning.
By integrating SOM into business strategies, companies gain clarity on market growth opportunities and set achievable sales targets. SOM ensures marketing and sales efforts are aligned with the company’s capabilities, improving investment decisions and maximizing revenue.
Stop Wasting Time on Manual Reports... Get Insights Faster With AgencyAnalytics
How Serviceable Obtainable Market Relates To Other KPIs
Serviceable Obtainable Market ties directly to KPIs like Market Share, Revenue Growth, and Customer Acquisition Cost (CAC). By estimating the portion of the Serviceable Addressable Market that a business can realistically capture, SOM helps refine revenue projections and assess potential ROI.
SOM is influenced by the company’s competitive advantage, customer segments, and operational efficiency. For example, aligning SOM with Conversion Rates offers a detailed picture of how effectively a business is converting its obtainable market into paying customers. Similarly, monitoring SOM alongside Marketing Qualified Leads (MQLs) or Sales Qualified Leads (SQLs) reveals the efficiency of marketing efforts in capturing the target audience.
SOM’s relevance grows when paired with financial metrics like Average Revenue Per User (ARPU) or Churn Rate, as it ensures alignment between market estimates and ongoing performance metrics.
Key Factors That Impact Serviceable Obtainable Market
Several factors influence a business's ability to capture its Serviceable Obtainable Market. These include the company’s operational capabilities, competitive landscape, and marketing strategies. For instance, robust distribution channels and targeted marketing efforts can expand a business’s reach within its SOM. Conversely, limited resources or ineffective strategies may constrain it.
Market conditions, such as economic trends and customer demand, also play a pivotal role. Businesses operating in a growing industry with high total market demand and few competitors are more likely to capture a larger share of their SOM. Pricing strategies and product differentiation also significantly impact the obtainable share, as they determine how a company stands out in its specific market.
Historical data and accurate market research tools further refine SOM calculations by offering insights into past performance and current opportunities. Combining these factors creates a realistic and actionable view of a potential market.

KPIs allow us, as an agency, to demonstrate our value to the client. Ultimately, what is their ROI from our efforts? When you can clearly demonstrate this month over month, it increases your retention rate and keeps clients paying you month after month.
How To Measure and Calculate Serviceable Obtainable Market
Serviceable Obtainable Market is calculated by estimating the share of the Serviceable Addressable Market a business can realistically capture. This involves analyzing factors such as company capabilities, market competition, and distribution reach. Use financial reports, historical data, and industry research to ensure accuracy.
Serviceable Obtainable Market Formula Example
What Is a Good Average SOM?
A good SOM for startups and new businesses typically ranges between 1% and 5% of the Total Addressable Market, depending on the industry and competitive landscape. However, dominant market leaders often control 20-30% of the TAM. These ranges reflect a realistic market share achievable given the company’s capabilities, competitive positioning, and resources.
What Is a Bad Average SOM?
A SOM for new businesses that falls below 1% often indicates an overly conservative estimate or lack of sufficient market reach. It could also point to operational limitations, insufficient marketing efforts, or heavy competition. If a previously dominant market leaders dip below 15%, this often signals a significant loss of competitive advantage or market share.
How To Set Serviceable Obtainable Market Benchmarks and Goals
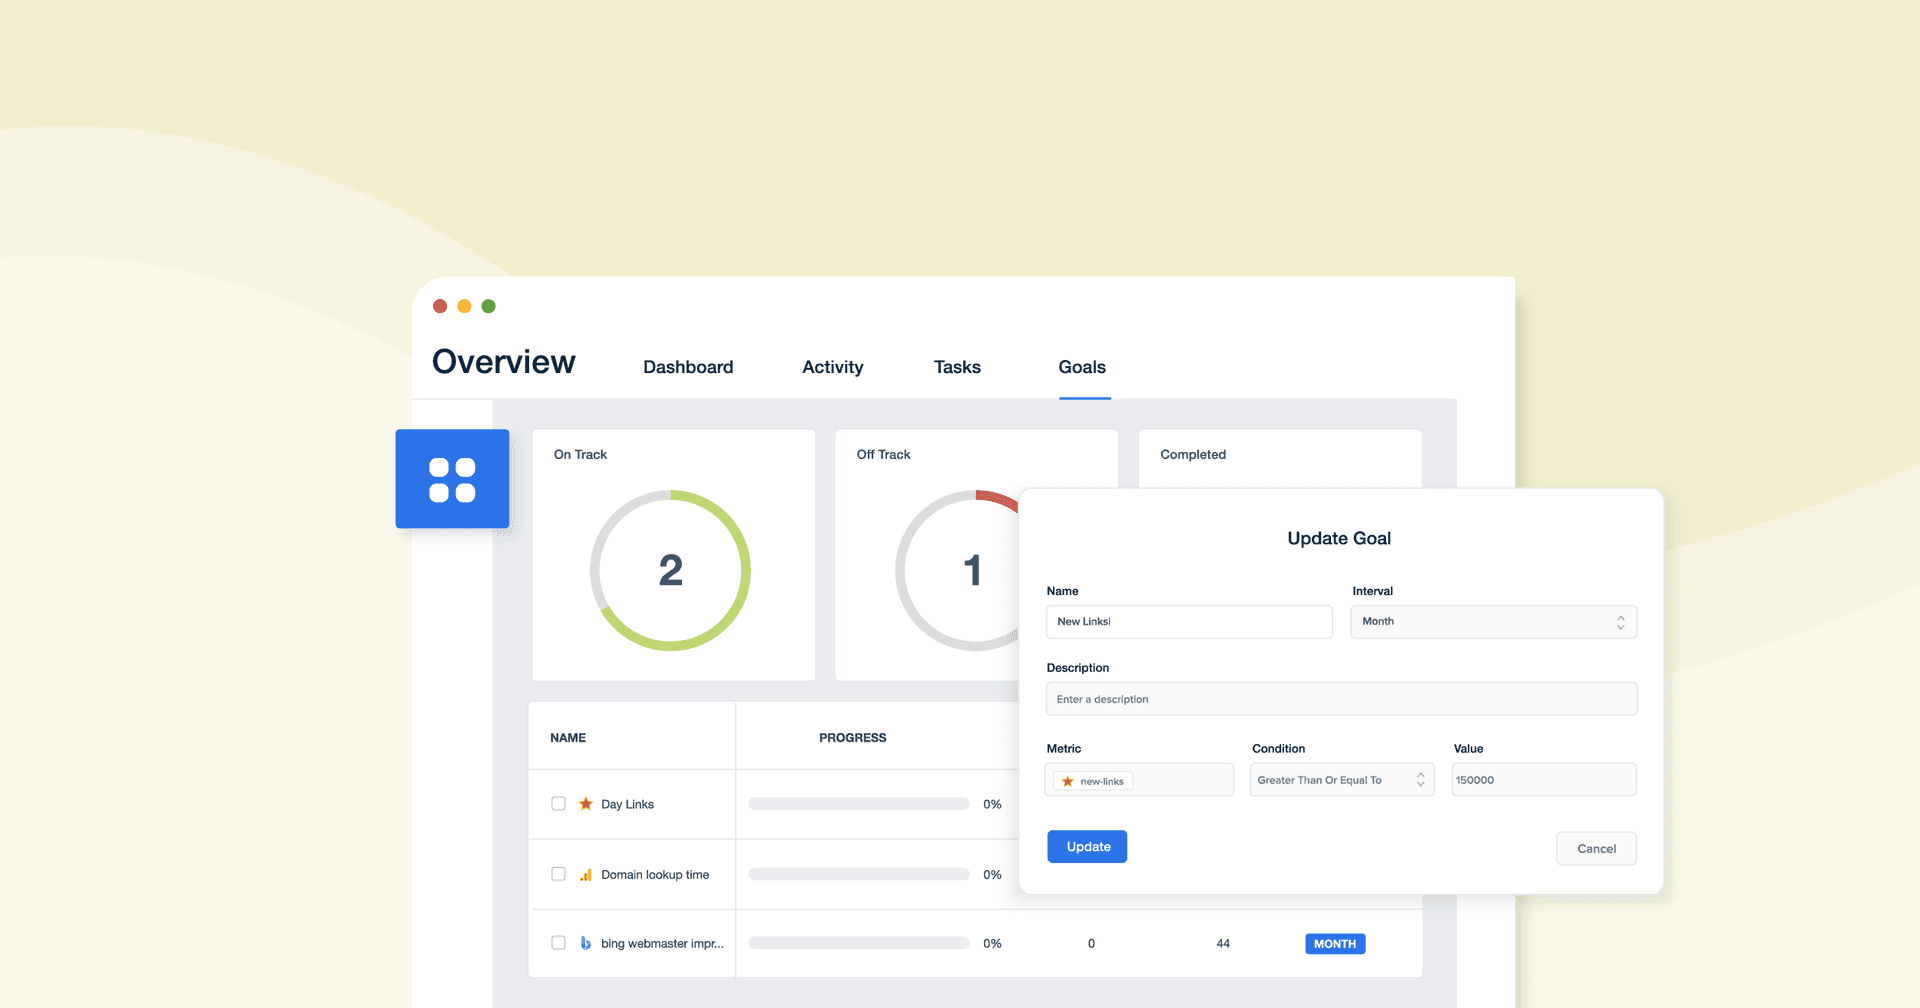
When benchmarks are unknown, use historical performance and primary research to establish realistic SOM goals. For example, analyzing past revenue growth rates and customer acquisition data helps identify achievable targets for new product launches or market expansions.
Why Serviceable Obtainable Market Matters to Clients
Serviceable Obtainable Market helps clients set realistic business goals by identifying the portion of the market they can capture. It prevents overestimating market potential and ensures investment decisions are grounded in achievable outcomes. For clients launching new products or entering new markets, SOM serves as a guide for resource allocation, which enables them to prioritize the most profitable segments. By understanding SOM, clients target their efforts efficiently, reducing risks and maximizing revenue growth within their specific market.

Why Serviceable Obtainable Market Matters to Agencies
For agencies, SOM is essential to demonstrating value to clients by linking marketing efforts to achievable revenue outcomes. It allows agencies to align marketing strategies with a client’s capabilities, ensuring campaigns are both efficient and impactful. Agencies leveraging SOM data in their reports highlight realistic growth opportunities, fostering trust and stronger client relationships. Furthermore, SOM informs tailored strategies that improve campaign ROI and enable agencies to showcase their role in helping clients dominate specific market segments.

Automate Reporting and Reclaim Lost Time
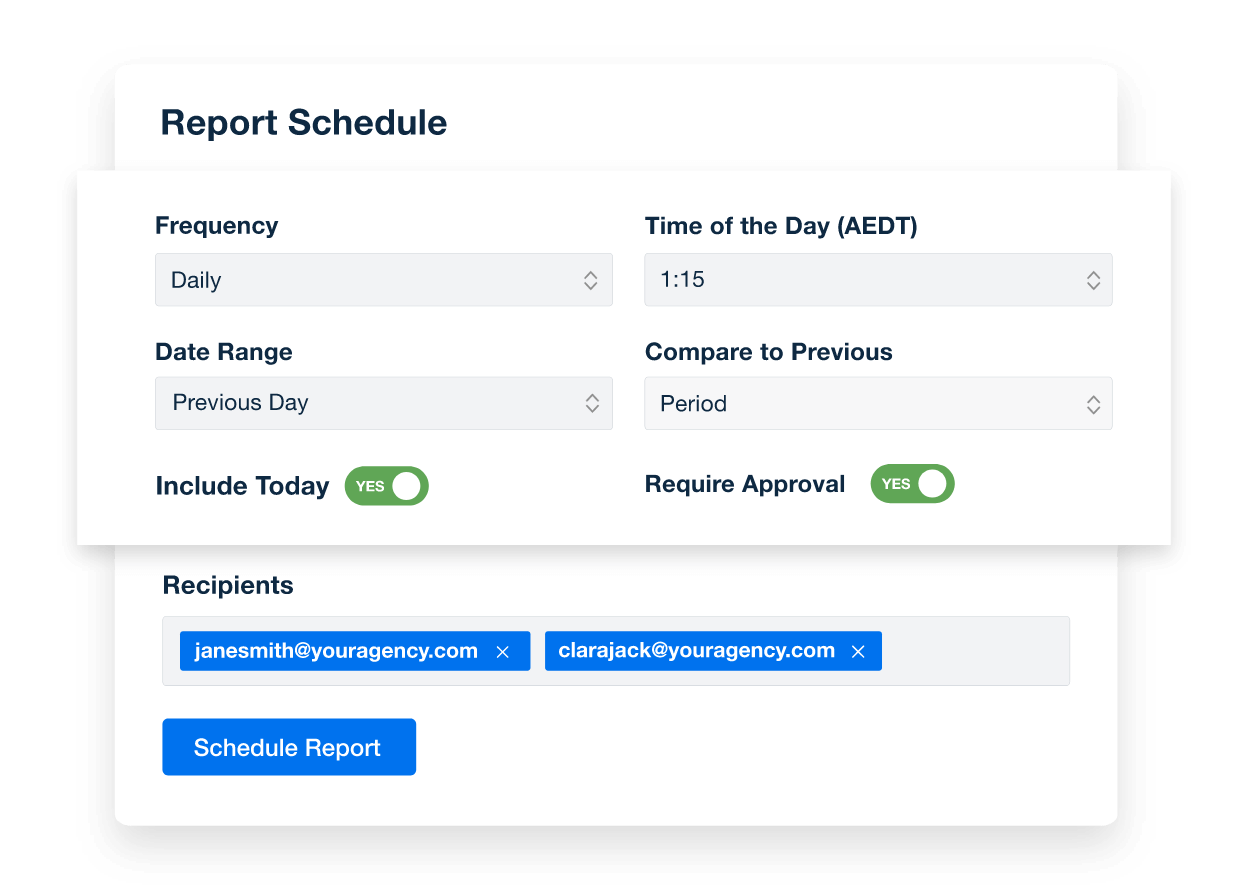
Set your reports on autopilot and free up your time for more strategic tasks. Schedule your reports to send automatically on your preferred frequency, from daily to annually. Receive notifications before each report is sent, allowing you to add personalized or AI-generated insights and summaries.
With automated reporting, you'll streamline your workflow, save time, and deliver consistent, high-quality reports to your clients.
Best Practices When Analyzing and Reporting on SOM
A comprehensive analysis of Serviceable Obtainable Market enables businesses and agencies to identify growth opportunities, refine marketing strategies, and set actionable goals. Effective reporting ensures that SOM insights align with client expectations and drive measurable results.
Ensure Data Accuracy
Reliable SOM analysis starts with accurate data. Use market research tools, financial reports, and historical data to validate assumptions and refine calculations.
Analyze Over Time
Tracking SOM trends reveals shifts in market reach, customer behavior, and competitive positioning. Use this insight to adjust strategies and maintain relevance in the market.
Compare Across Channels and Campaigns
Assess SOM across different market segments, geographic locations, or product categories to uncover untapped opportunities and identify areas needing strategic adjustments.
Put in Context
Position SOM alongside other KPIs like revenue growth, CAC, and market share to build a complete picture of performance and enable actionable recommendations for improvement.
Align to Client Goals
Align SOM analysis with specific client goals. Tailoring reports to client priorities reinforces the value of marketing efforts, whether it's revenue potential or market expansion.
Visualize Performance
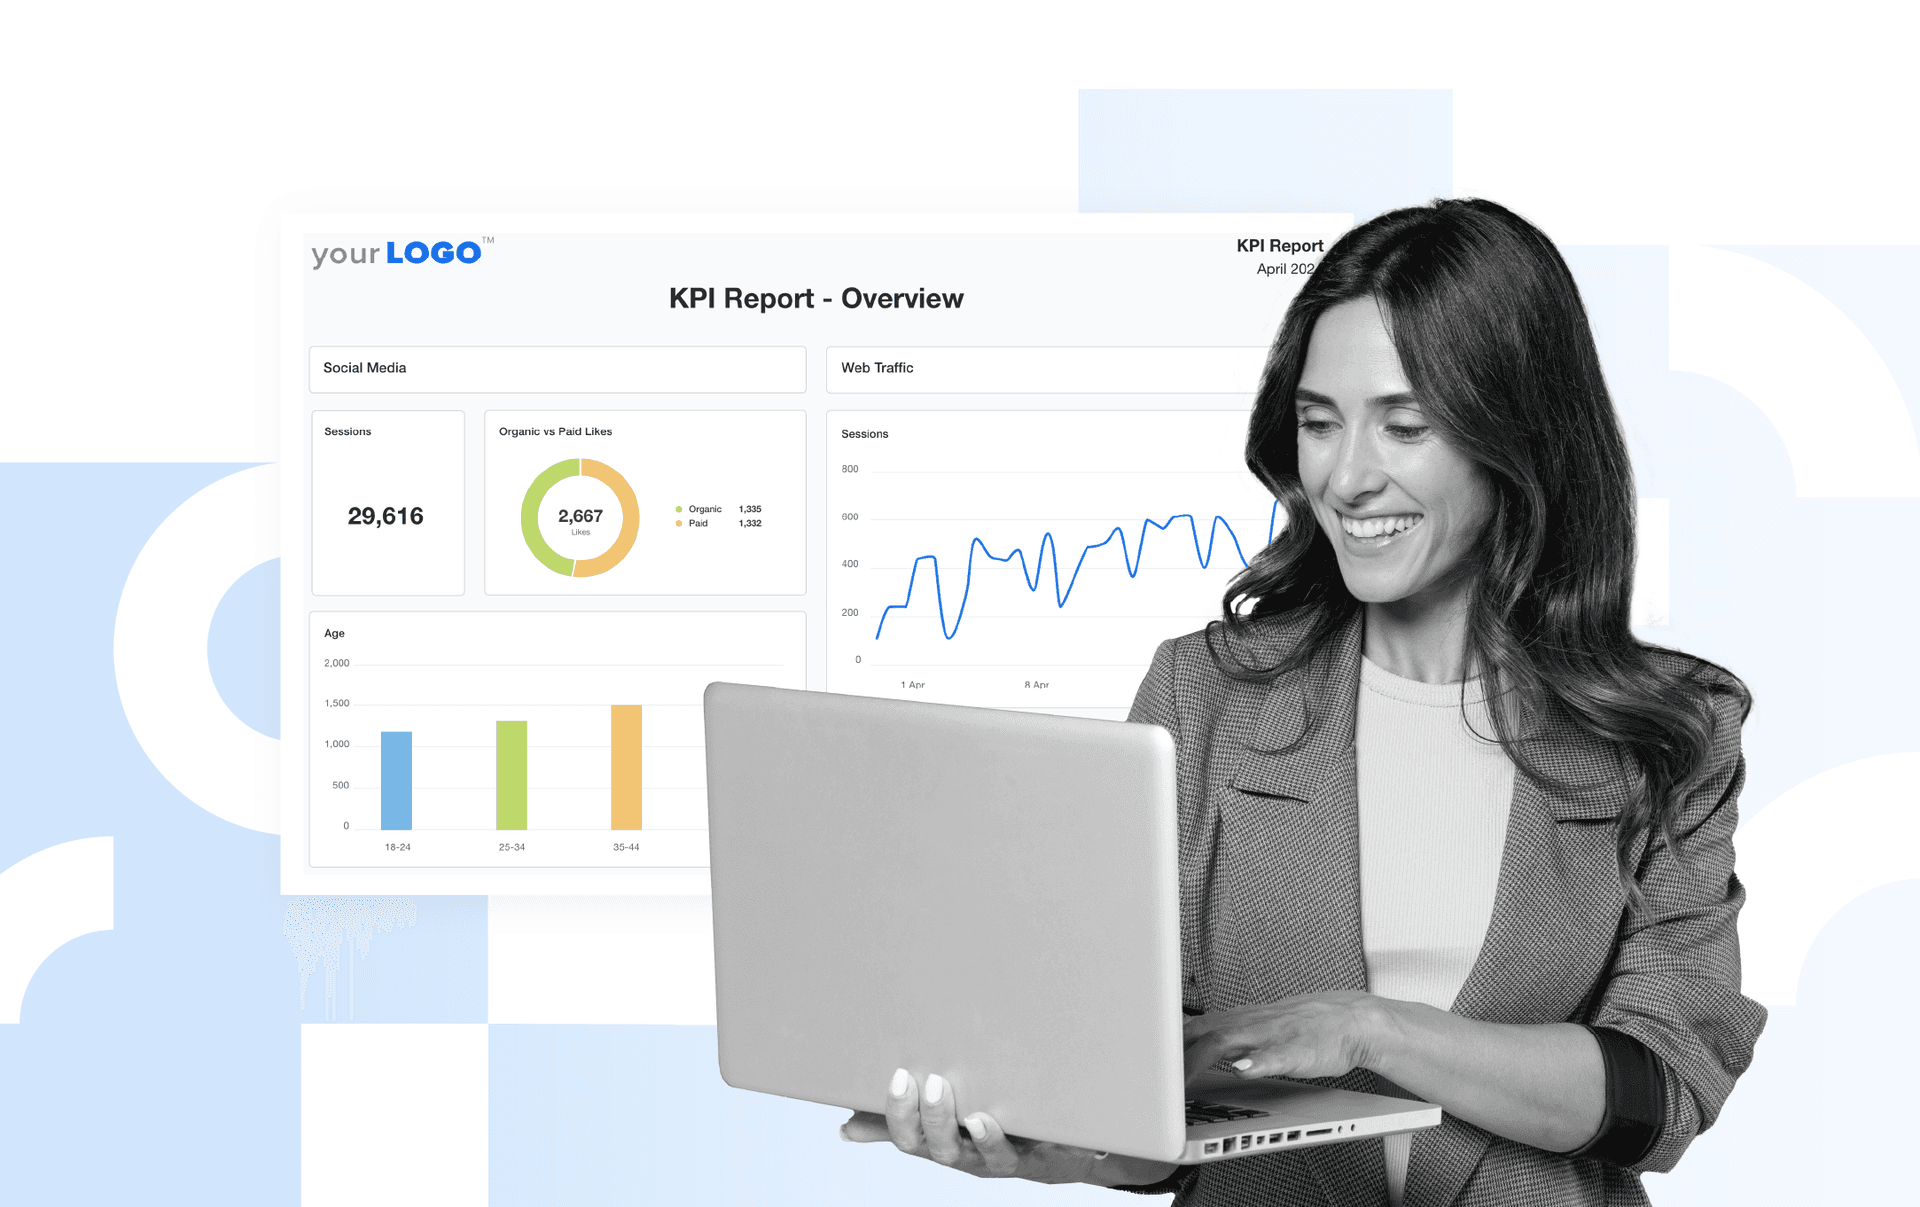
Leverage charts and graphs to visualize SOM trends and projections. Clear visuals help clients and stakeholders grasp the market potential at a glance, fostering trust and engagement.
Professional reports help communicate the results of marketing campaigns, website performance, and other key metrics to stakeholders such as clients, management, and investors. This helps demonstrate the value of the work being done and provides a clear picture of progress towards goals and objectives.
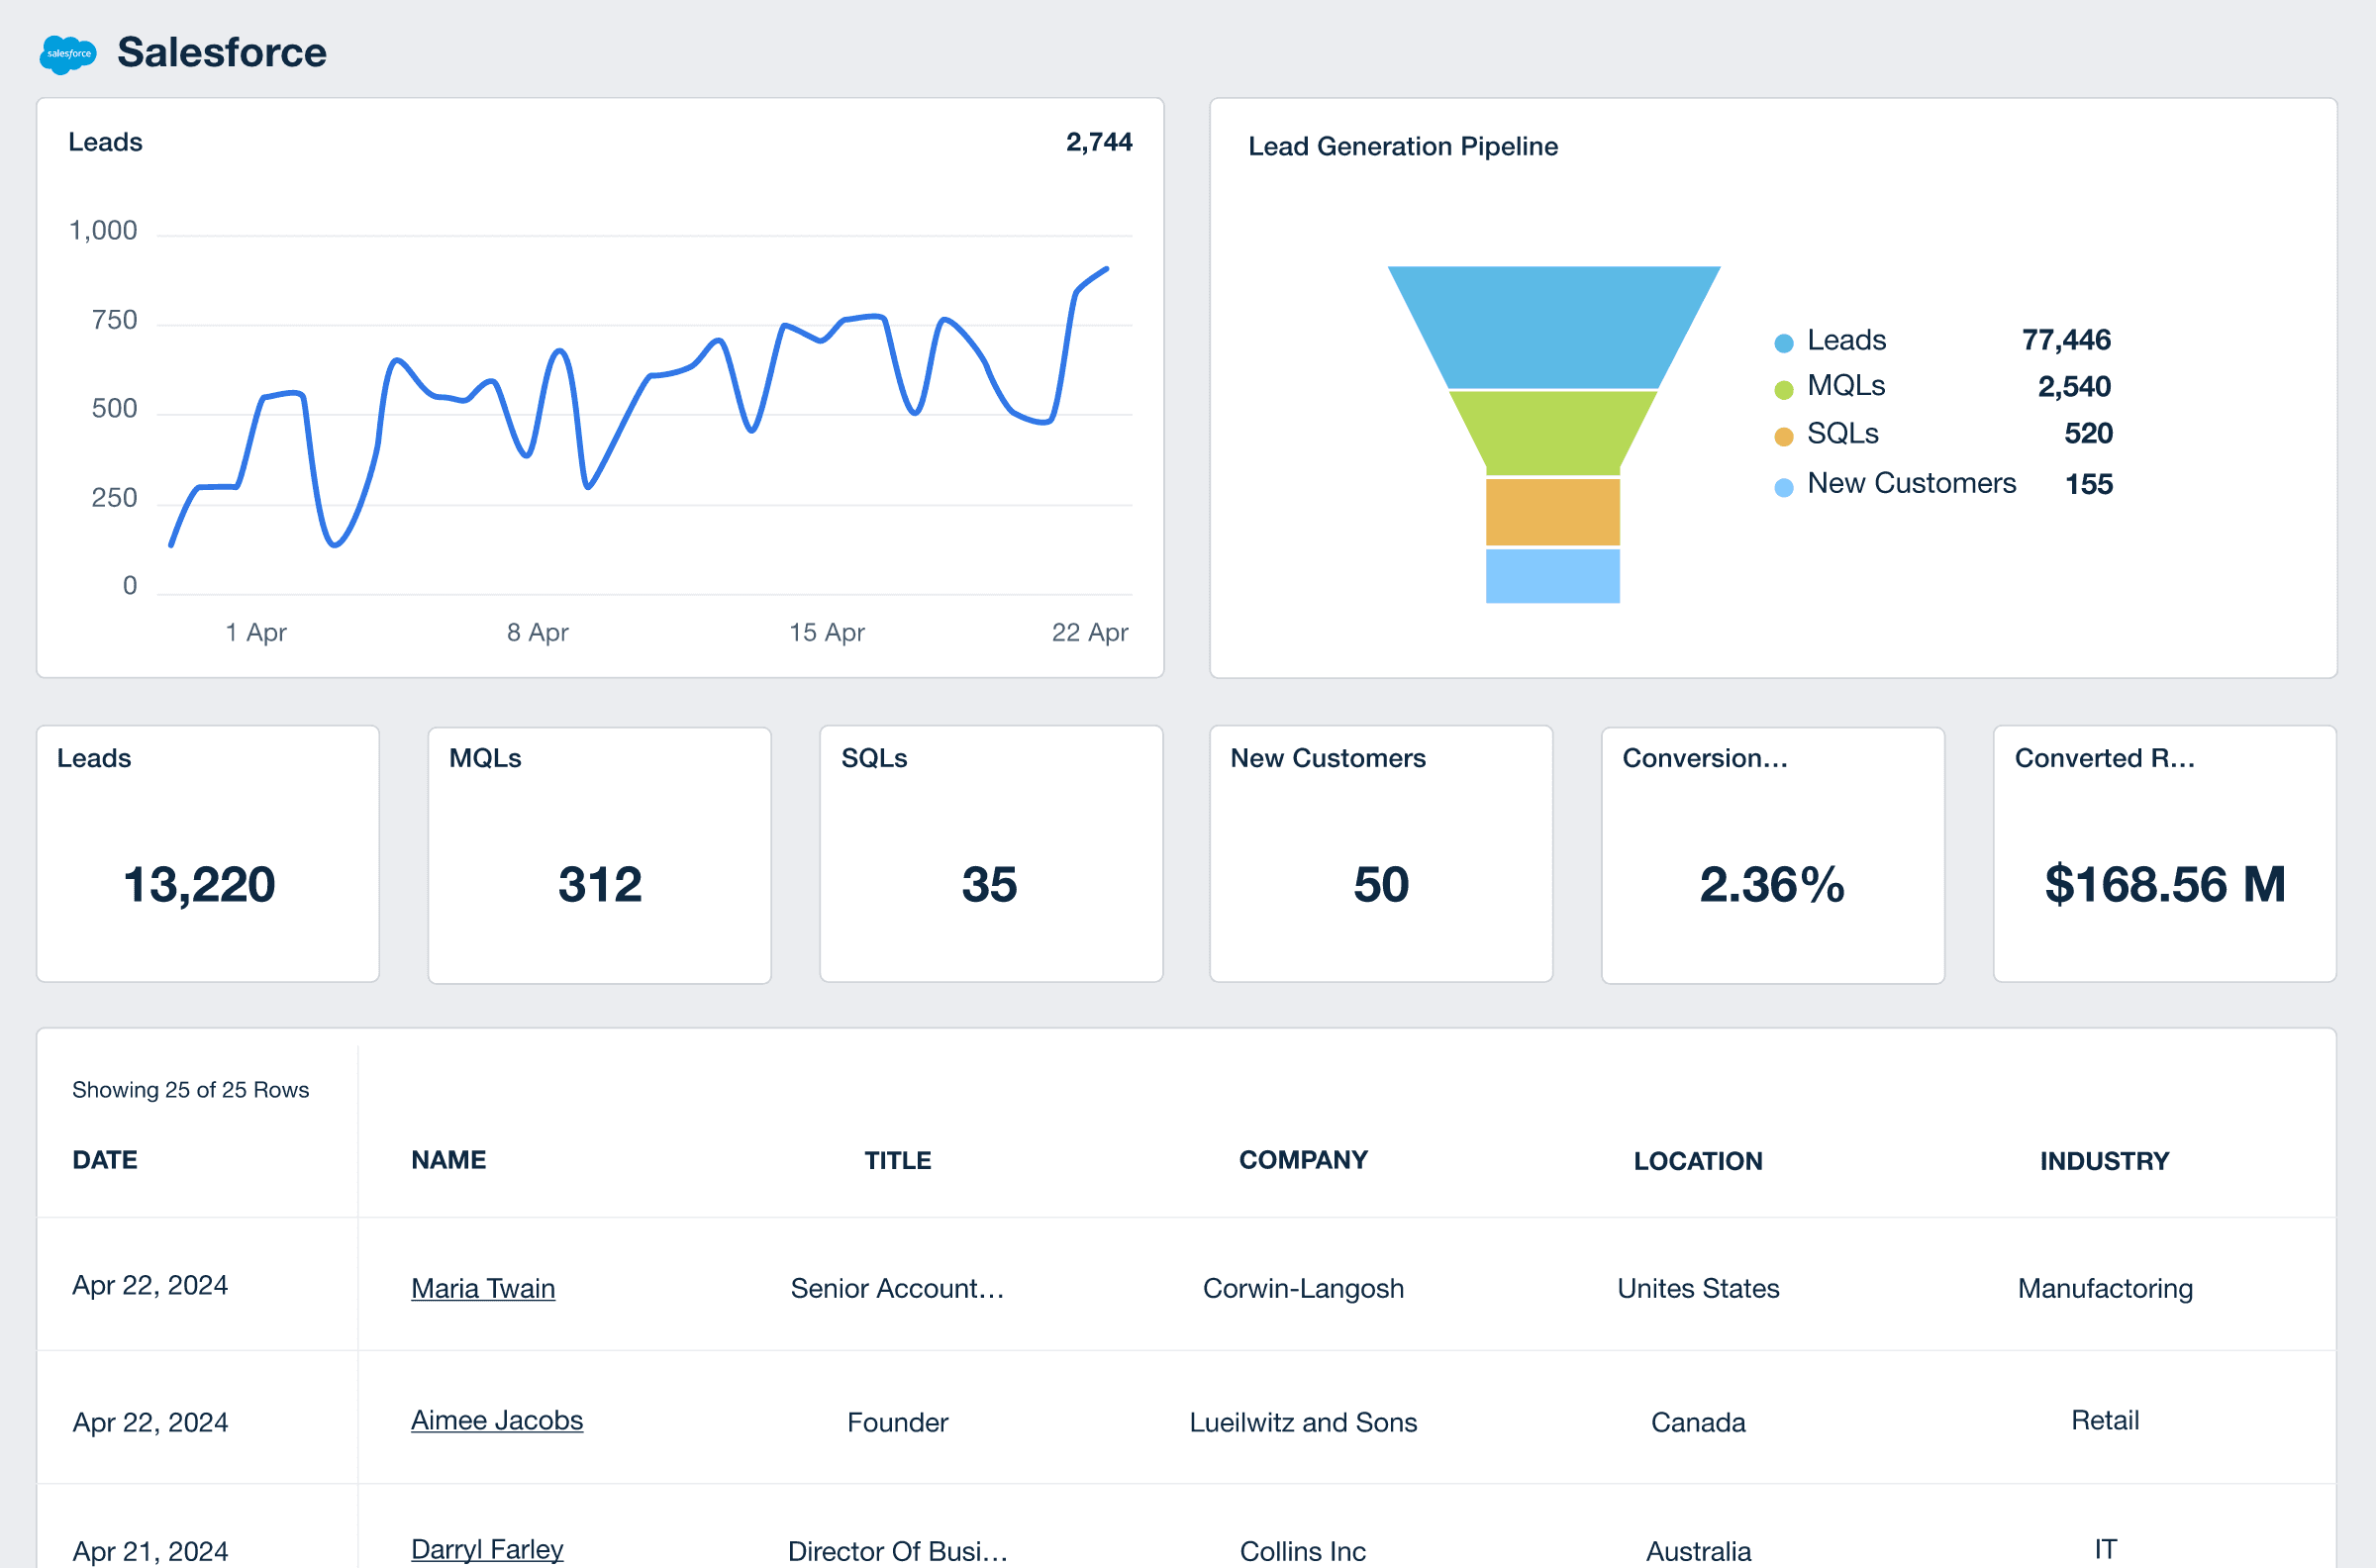
Salesforce Dashboard Example
Related Integrations
How To Increase Serviceable Obtainable Market
Increasing a client's Serviceable Obtainable Market involves refining sales strategies, understanding the competitive landscape, and leveraging accurate data to capture the maximum revenue potential from the available market.
Refine Target Market Segments
Using detailed market research tools and industry reports, focus on the most profitable customer segments. Identify which groups within the serviceable market best align with the company’s strengths and resources.
Enhance Sales Strategies
Develop tailored sales strategies that emphasize the product or service's unique value proposition. Use sales data and primary research to identify potential customers and build a product roadmap that addresses their specific needs.
Leverage Competitive Analysis
Study the competitive landscape to identify gaps in the market where your client’s business has a competitive advantage. Use insights from market reports and calculate TAM, SAM, and SOM to optimize efforts.
Related Blog Posts
See how 7,000+ marketing agencies help clients win
Free 14-day trial. No credit card required.


