Serviceable Addressable Market (SAM)
Market Prioritization
Use SAM to focus on the most viable customer segments for growth opportunities.
Revenue Forecasting
SAM helps estimate realistic revenue potential based on resources and market conditions.
Resource Allocation
Assign resources and budget towards market segments with the highest potential ROI.
Competitive Analysis
Evaluate how well a business stacks up to competitors within a specific SAM.
Why Serviceable Addressable Market Is Important
Serviceable Addressable Market (SAM) plays a key role in helping businesses understand realistic market opportunities. Unlike the Total Addressable Market (TAM), SAM focuses on the portion of the market that a business could practically serve. It helps avoid overestimating market size, pinpointing segments with the most potential.
Additionally, SAM is used to set realistic revenue goals and optimize resource allocation. It ensures businesses target the most viable customers, avoiding wasted effort on segments they cannot serve effectively.
By understanding SAM, businesses are equipped to make smarter decisions, such as where to compete, how to grow, and which parts of the market to target. This focus drives better outcomes and long-term success.

Stop Wasting Time on Manual Reports... Get Insights Faster With AgencyAnalytics
How Serviceable Addressable Market Relates To Other KPIs
Serviceable Addressable Market (SAM) is connected to several KPIs that guide business growth and market performance. Take Customer Acquisition Cost (CAC), for example. By focusing on a promising segment, businesses are better able to allocate resources and reduce costs.
Once high-value markets are targeted, there’s greater potential for retention and a more significant Customer Lifetime Value (CLV). SAM also informs revenue forecasting, aligning with metrics like Monthly Recurring Revenue (MRR) and Average Order Value (AOV). A well-defined SAM provides clarity on the size, quality, and spending potential of the target market.
This alignment allows businesses to set realistic growth goals, track progress against market opportunities, and optimize strategies to maximize profitability.
Key Factors That Impact Serviceable Addressable Market
Several factors influence SAM. Market dynamics–such as changing trends and consumer behavior–may expand or limit the target audience size. Geography also plays a significant role in defining SAM. Regulatory constraints, distribution networks, and regional demand variations may expand or limit business opportunities.
Additionally, a company’s resources (like production capacity and technology) determine which parts of the specific market it could realistically serve. Strong competitors with established brand loyalty may also reduce the serviceable available market–unless the business differentiates effectively.
Also, it’s important to conduct primary research and assess customer needs. This helps align products or services with the most profitable parts of the market.

What’s the Difference Between TAM, SAM, and SOM?
TAM, SAM, and SOM are interconnected metrics that define market opportunities for a business. Firstly, Total Addressable Market (TAM) represents the entire market demand, assuming no constraints. To calculate TAM, estimate the total revenue opportunity available for a product or service if it were to capture 100% of its market.
Serviceable Addressable Market (SAM) narrows TAM to the portion a business can realistically serve, considering factors like product fit and geographic reach. On the other hand, Service Obtainable Market (SOM) refines SAM further–it represents the market share a business expects to capture based on the competitive landscape and current capacity.
TAM, SAM, and SOM function as a hierarchy to guide strategic planning. TAM sets the broadest scope, offering a vision of total market potential. SAM refines this vision into actionable opportunities aligned with the business's operational realities. Finally, SOM translates these opportunities into immediate targets, helping prioritize efforts and allocate resources effectively.
Together, these metrics enable businesses to scale, ensuring long-term growth is both feasible and focused.

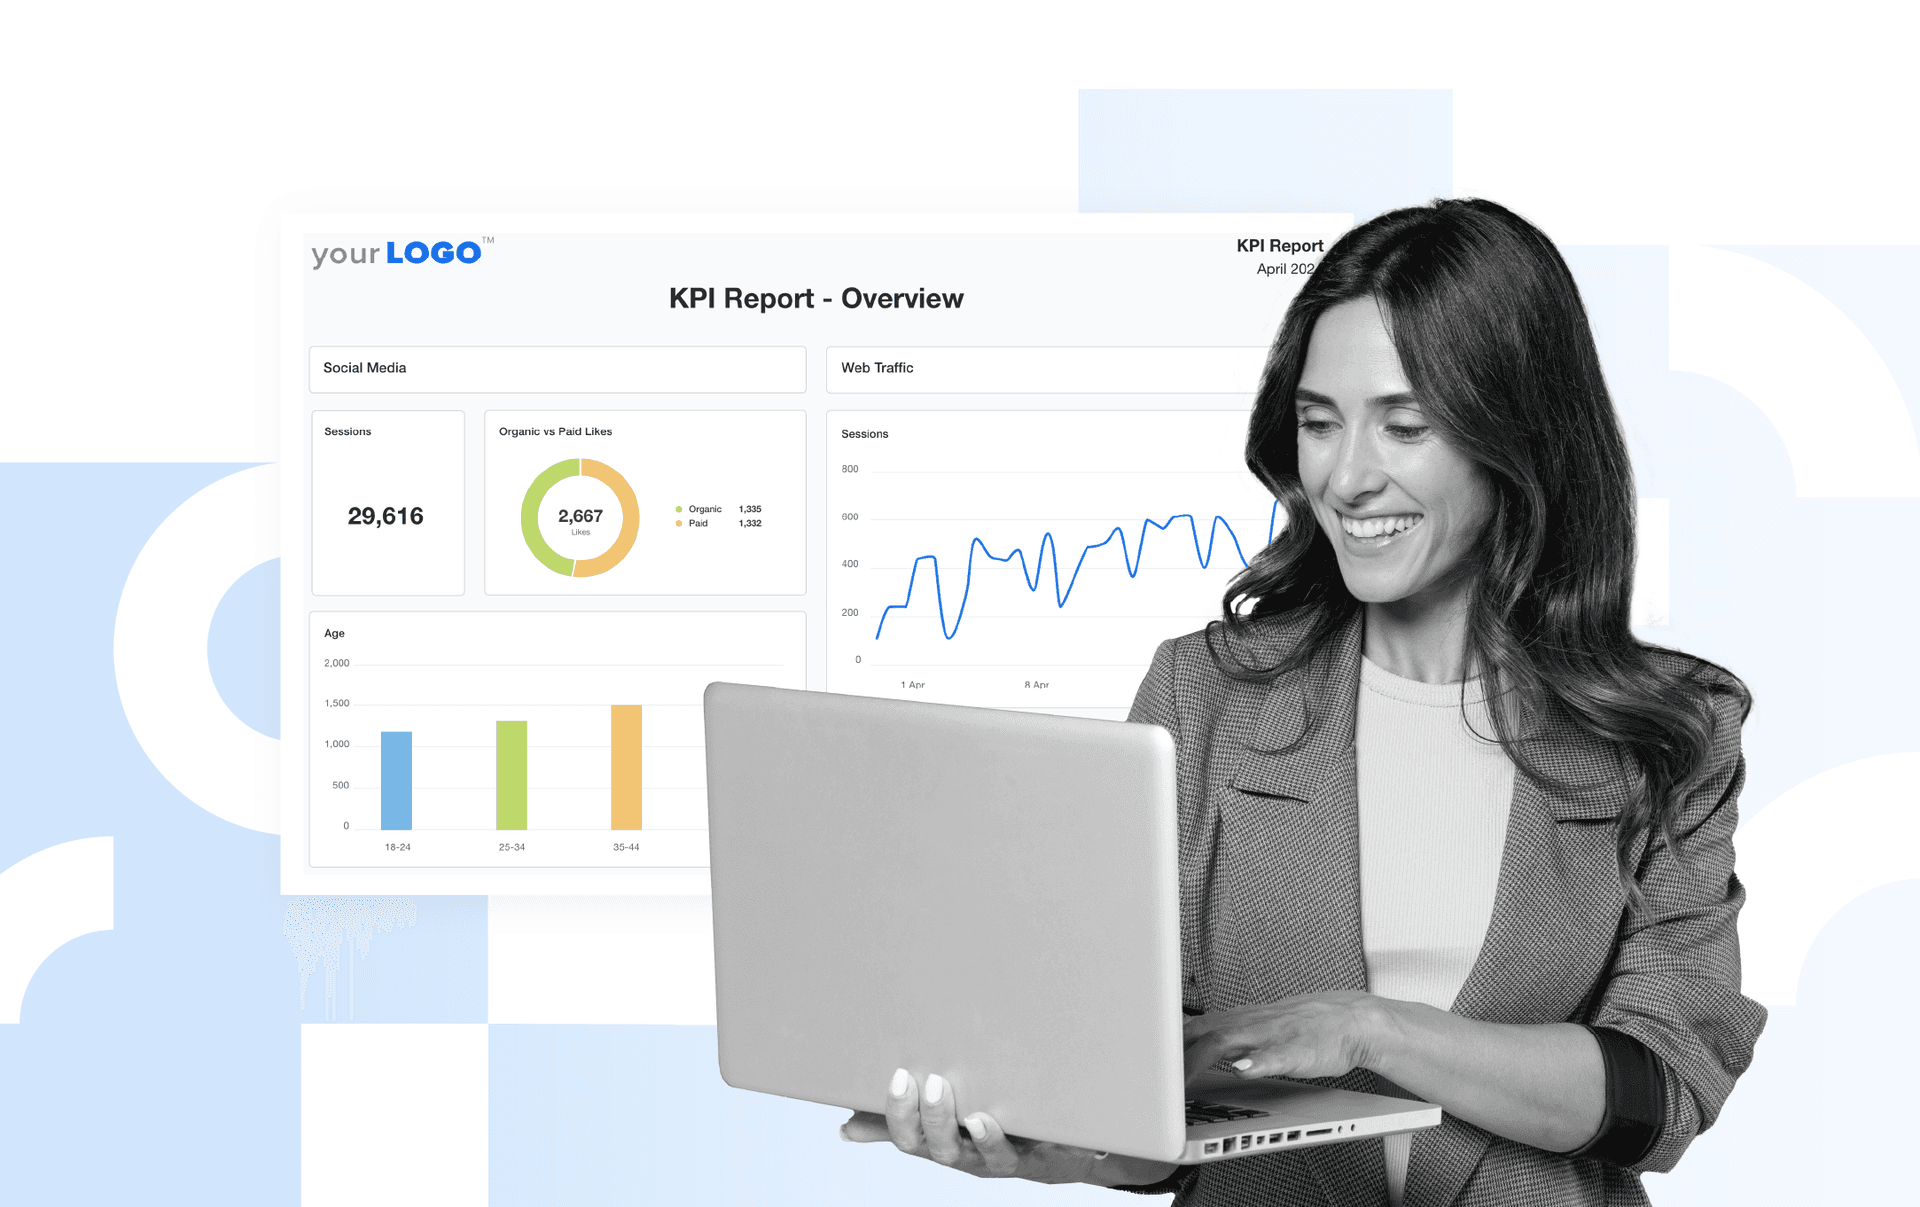
By customizing dashboards, we can highlight and prioritize the client KPIs that are most relevant to them, ensuring that we’re delivering data that’s both actionable and meaningful to them. This level of personalization not only allows us to present data in a way that’s most digestible and valuable to the client, but it also demonstrates our commitment to understanding their business and needs at a more personal level.
How To Calculate Serviceable Addressable Market
Serviceable Addressable Market is calculated by identifying the Total Addressable Market (TAM) and narrowing it down based on specific criteria (such as product-market fit, geographic constraints, and operational capacity). Then, TAM is multiplied by Market Fit Factor and an Accessibility Factor.
As a quick reference, TAM refers to the total market size, representing all potential customers. Market Fit Factor is the percentage of TAM aligned with the product or service's capabilities. Finally, Accessibility Factor reflects the percentage of the TAM that’s reachable based on geographic or operational constraints.
SAM Formula Example
What Is a Good Serviceable Addressable Market?
A good SAM aligns closely with the business’s operational capacity. It also reflects a realistic portion of the Total Addressable Market (TAM) that could generate sustainable revenue.
For instance, SAMs in the range of 10 to 30% of TAM are often considered feasible for many industries, depending on competition and market dynamics.
What Is a Bad Serviceable Addressable Market?
A bad SAM occurs when it is either overly inflated or unrealistically low, leading to misaligned business strategies. Overestimating SAM results in wasted resources and unmet revenue targets.
Conversely, underestimating SAM restricts growth by failing to capitalize on achievable market opportunities.
How To Set Serviceable Addressable Market Benchmarks and Goals
Start by estimating the Total Addressable Market (TAM) and segmenting it into manageable portions based on geography, customer demographics, or industry. Assess internal resources (like production capacity and technology) to determine realistic segments. For more accurate numbers, it may be a good idea to lean on market research tools.
Use historical performance and revenue targets to define a realistic percentage of TAM (typically 5 to 15% for startups or 15 to 30% for established businesses). Also, set benchmarks based on production, distribution, and support capacities. For example, if operations can only handle a specific geographic region or volume of demand, tailor benchmarks to avoid overestimations.
Why Serviceable Addressable Market Matters to Clients
Serviceable Addressable Market (SAM) helps clients understand the realistic growth opportunities available to their business. Understanding SAM helps align expectations, ensuring goals are grounded in feasible market opportunities.
By providing a clear picture of attainable market segments, SAM prevents overestimation of growth potential. This could lead to wasted resources and missed objectives. Conversely, it avoids underestimation, ensuring clients don’t miss lucrative opportunities within their grasp.

Why Serviceable Addressable Market Matters to Agencies
Serviceable Addressable Market (SAM) helps agencies define the specific market segments their clients can realistically capture. This clarity ensures campaigns are targeted, relevant, and aligned with operational or geographic constraints. By leveraging SAM, agencies prioritize efforts on high-potential segments, maximizing the efficiency of marketing budgets. A clear SAM minimizes wasted resources on irrelevant audiences, driving a better ROI for clients.

Connect the Salesforce integration in seconds to streamline your client reporting.
Best Practices When Analyzing and Reporting on Serviceable Addressable Market
Analyzing the serviceable market helps guide resource allocation and strategy. Here are some reporting best practices to follow.
Highlight Assumptions Clearly
When presenting SAM calculations, include any assumptions, such as market segment reach percentages or serviceability factors.
Show Related Comparative Data
Compare SAM to the Total Addressable Market (TAM) and Serviceable Obtainable Market (SOM) in reports. This provides context for the size and scope of the market opportunity.
Put All Relevant Terms Into Context
Explain denser concepts and acronyms (e.g., detailed insights about TAM, SAM, SOM, and other related terms). This ensures clarity, better understanding, and transparency.
Track Progress Toward SAM Goals
Include metrics to show how much of the market landscape has been captured over time. For example, tie SAM progress to revenue milestones or retention metrics.
Simplify Complex, Denser Metrics
Use clear language and simple visuals to explain SAM-related calculations, especially for non-technical audiences. It also helps to expand on how it ties into overall financial performance.
Share Actionable Recommendations
Include recommendations for future marketing strategies based on the client’s objectives, such as revenue growth or market expansion.
Professional reports help communicate the results of marketing campaigns, website performance, and other key metrics to stakeholders such as clients, management, and investors. This helps demonstrate the value of the work being done and provides a clear picture of progress towards goals and objectives.
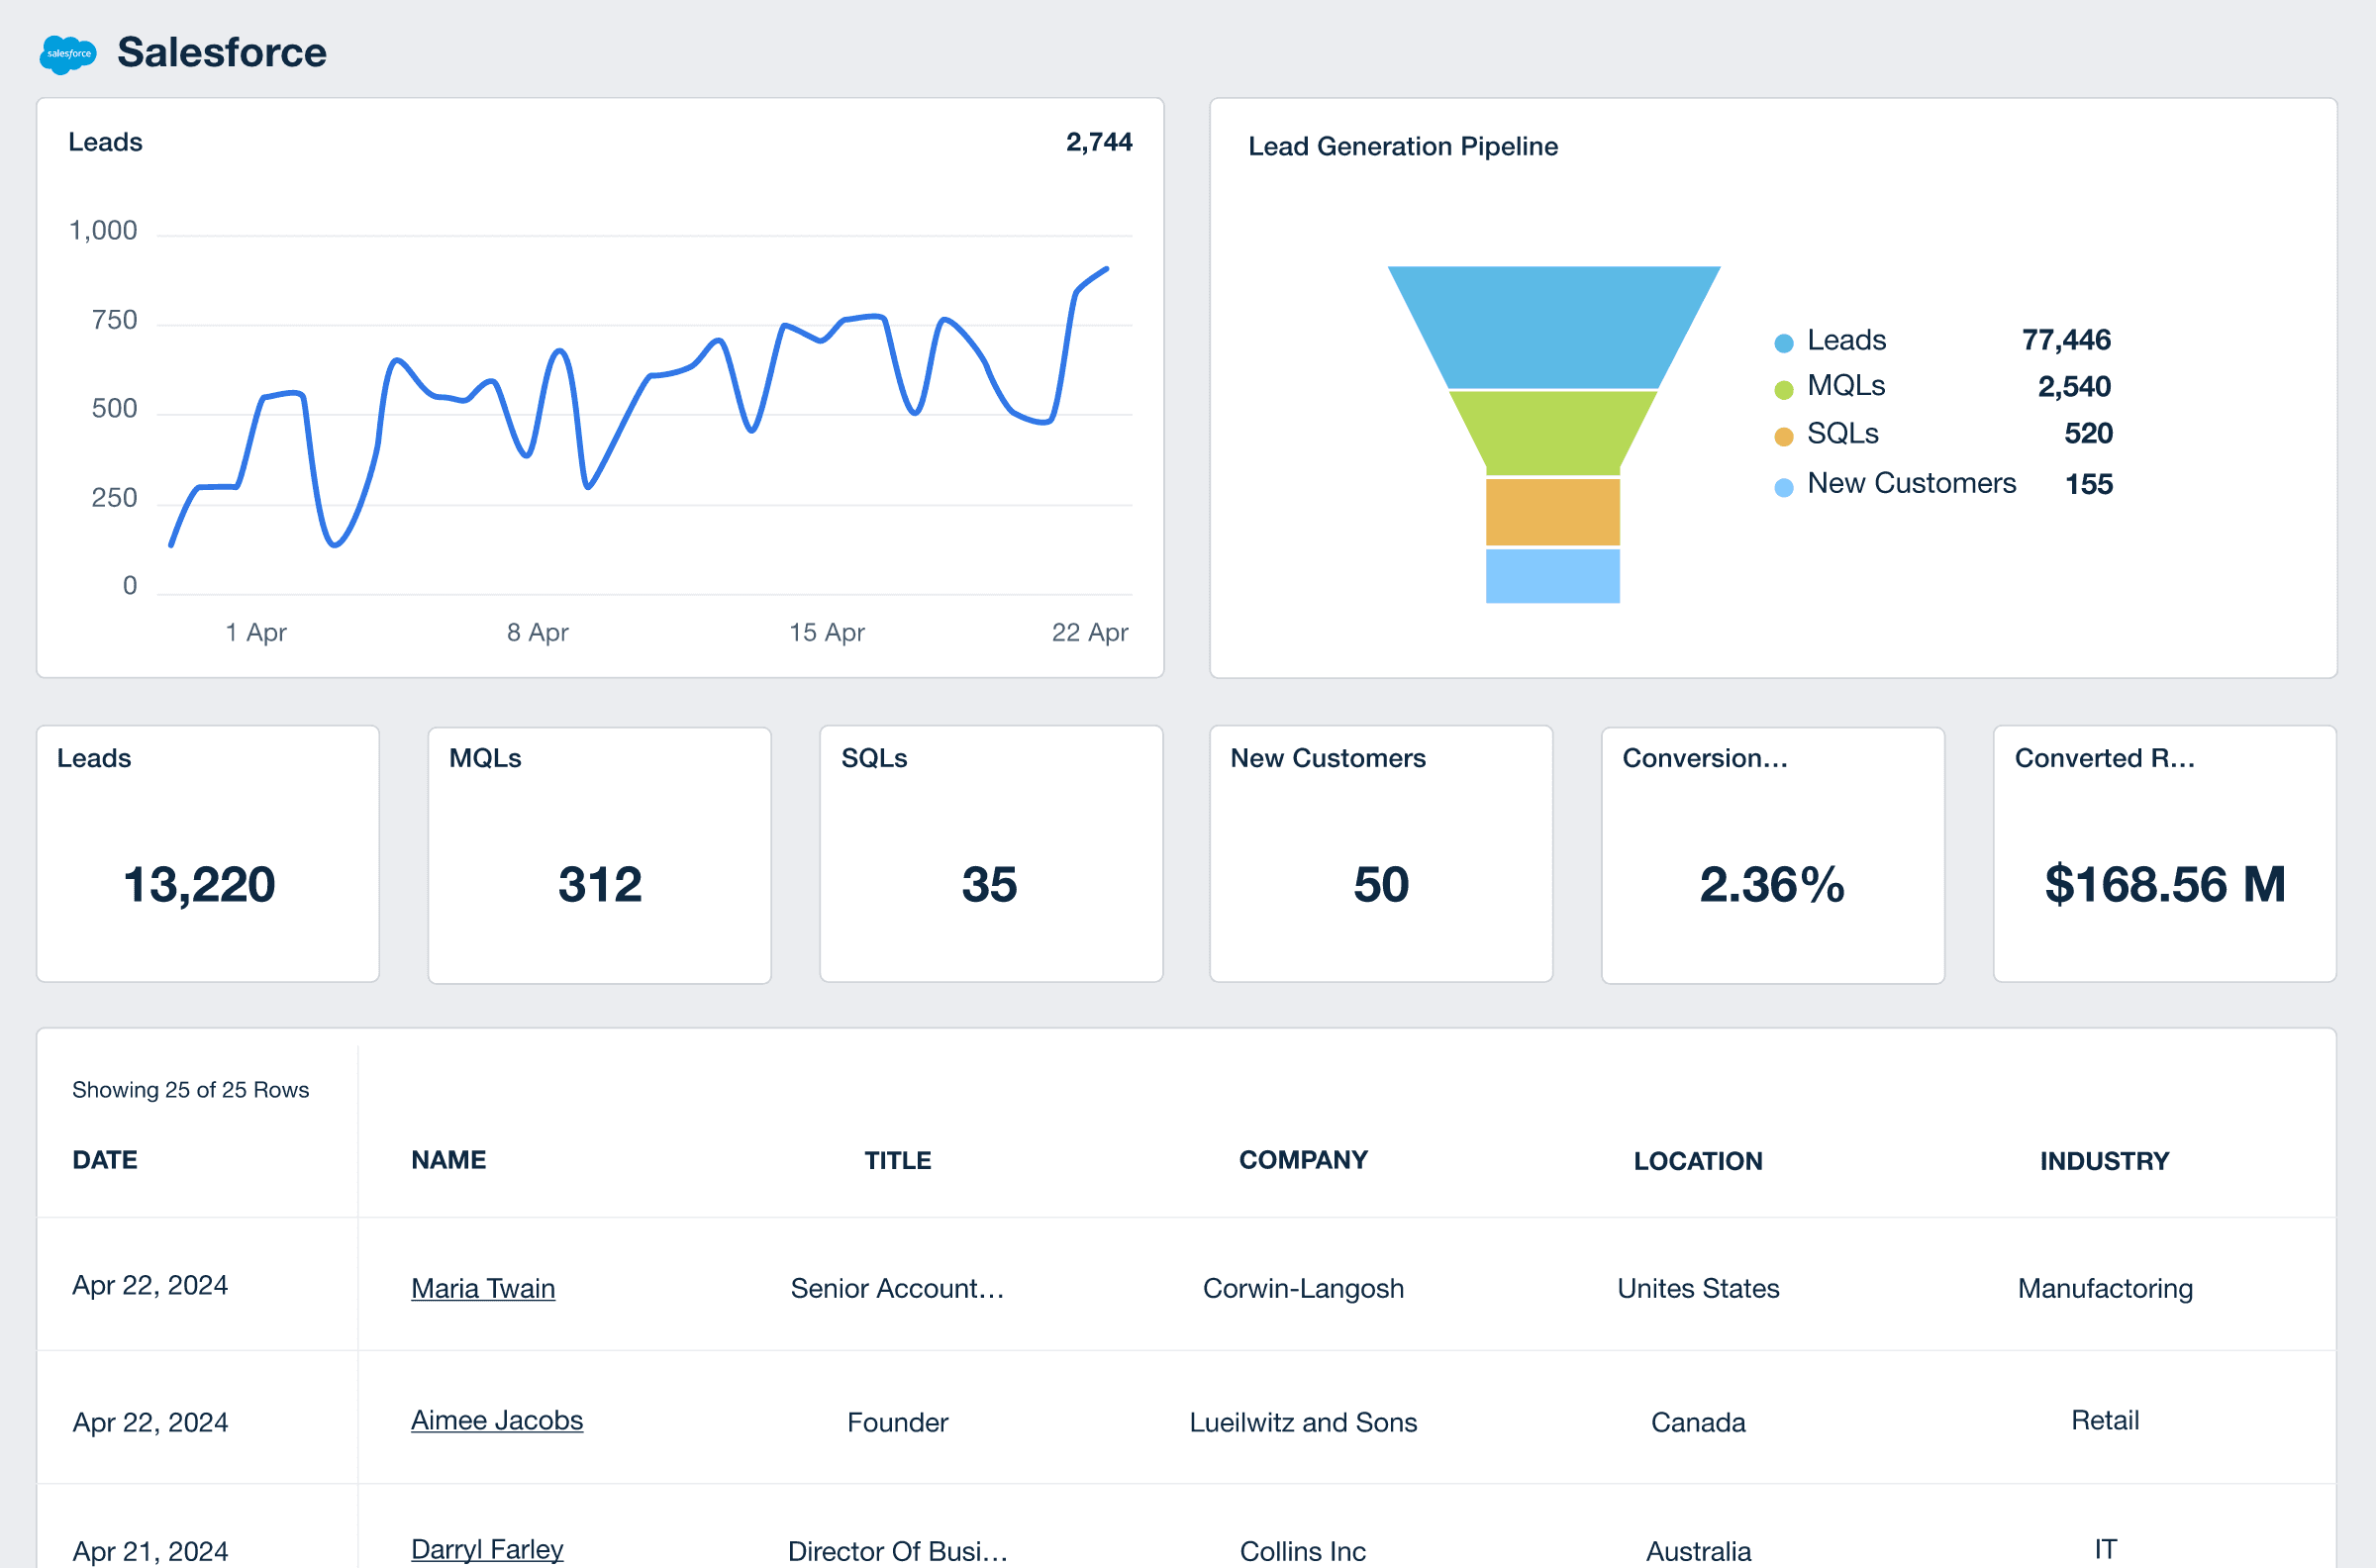
Salesforce Dashboard Example
How To Improve Serviceable Addressable Market
Improving SAM involves strategic adjustments to enhance the market segments a business can realistically serve. Here are actionable tips to remember.
Expand Product Offerings
Introduce complementary products or services to better meet the needs of additional market segments.
Improve Operations
Invest in technology to increase production capacity, reduce service limitations, and improve operations.
Enter New Markets
Consider geographical or demographic expansion to grow the SAM. Ensure it aligns with resources and capabilities.
Related Blog Posts
See how 7,000+ marketing agencies help clients win
Free 14-day trial. No credit card required.


