TikTok Report Template

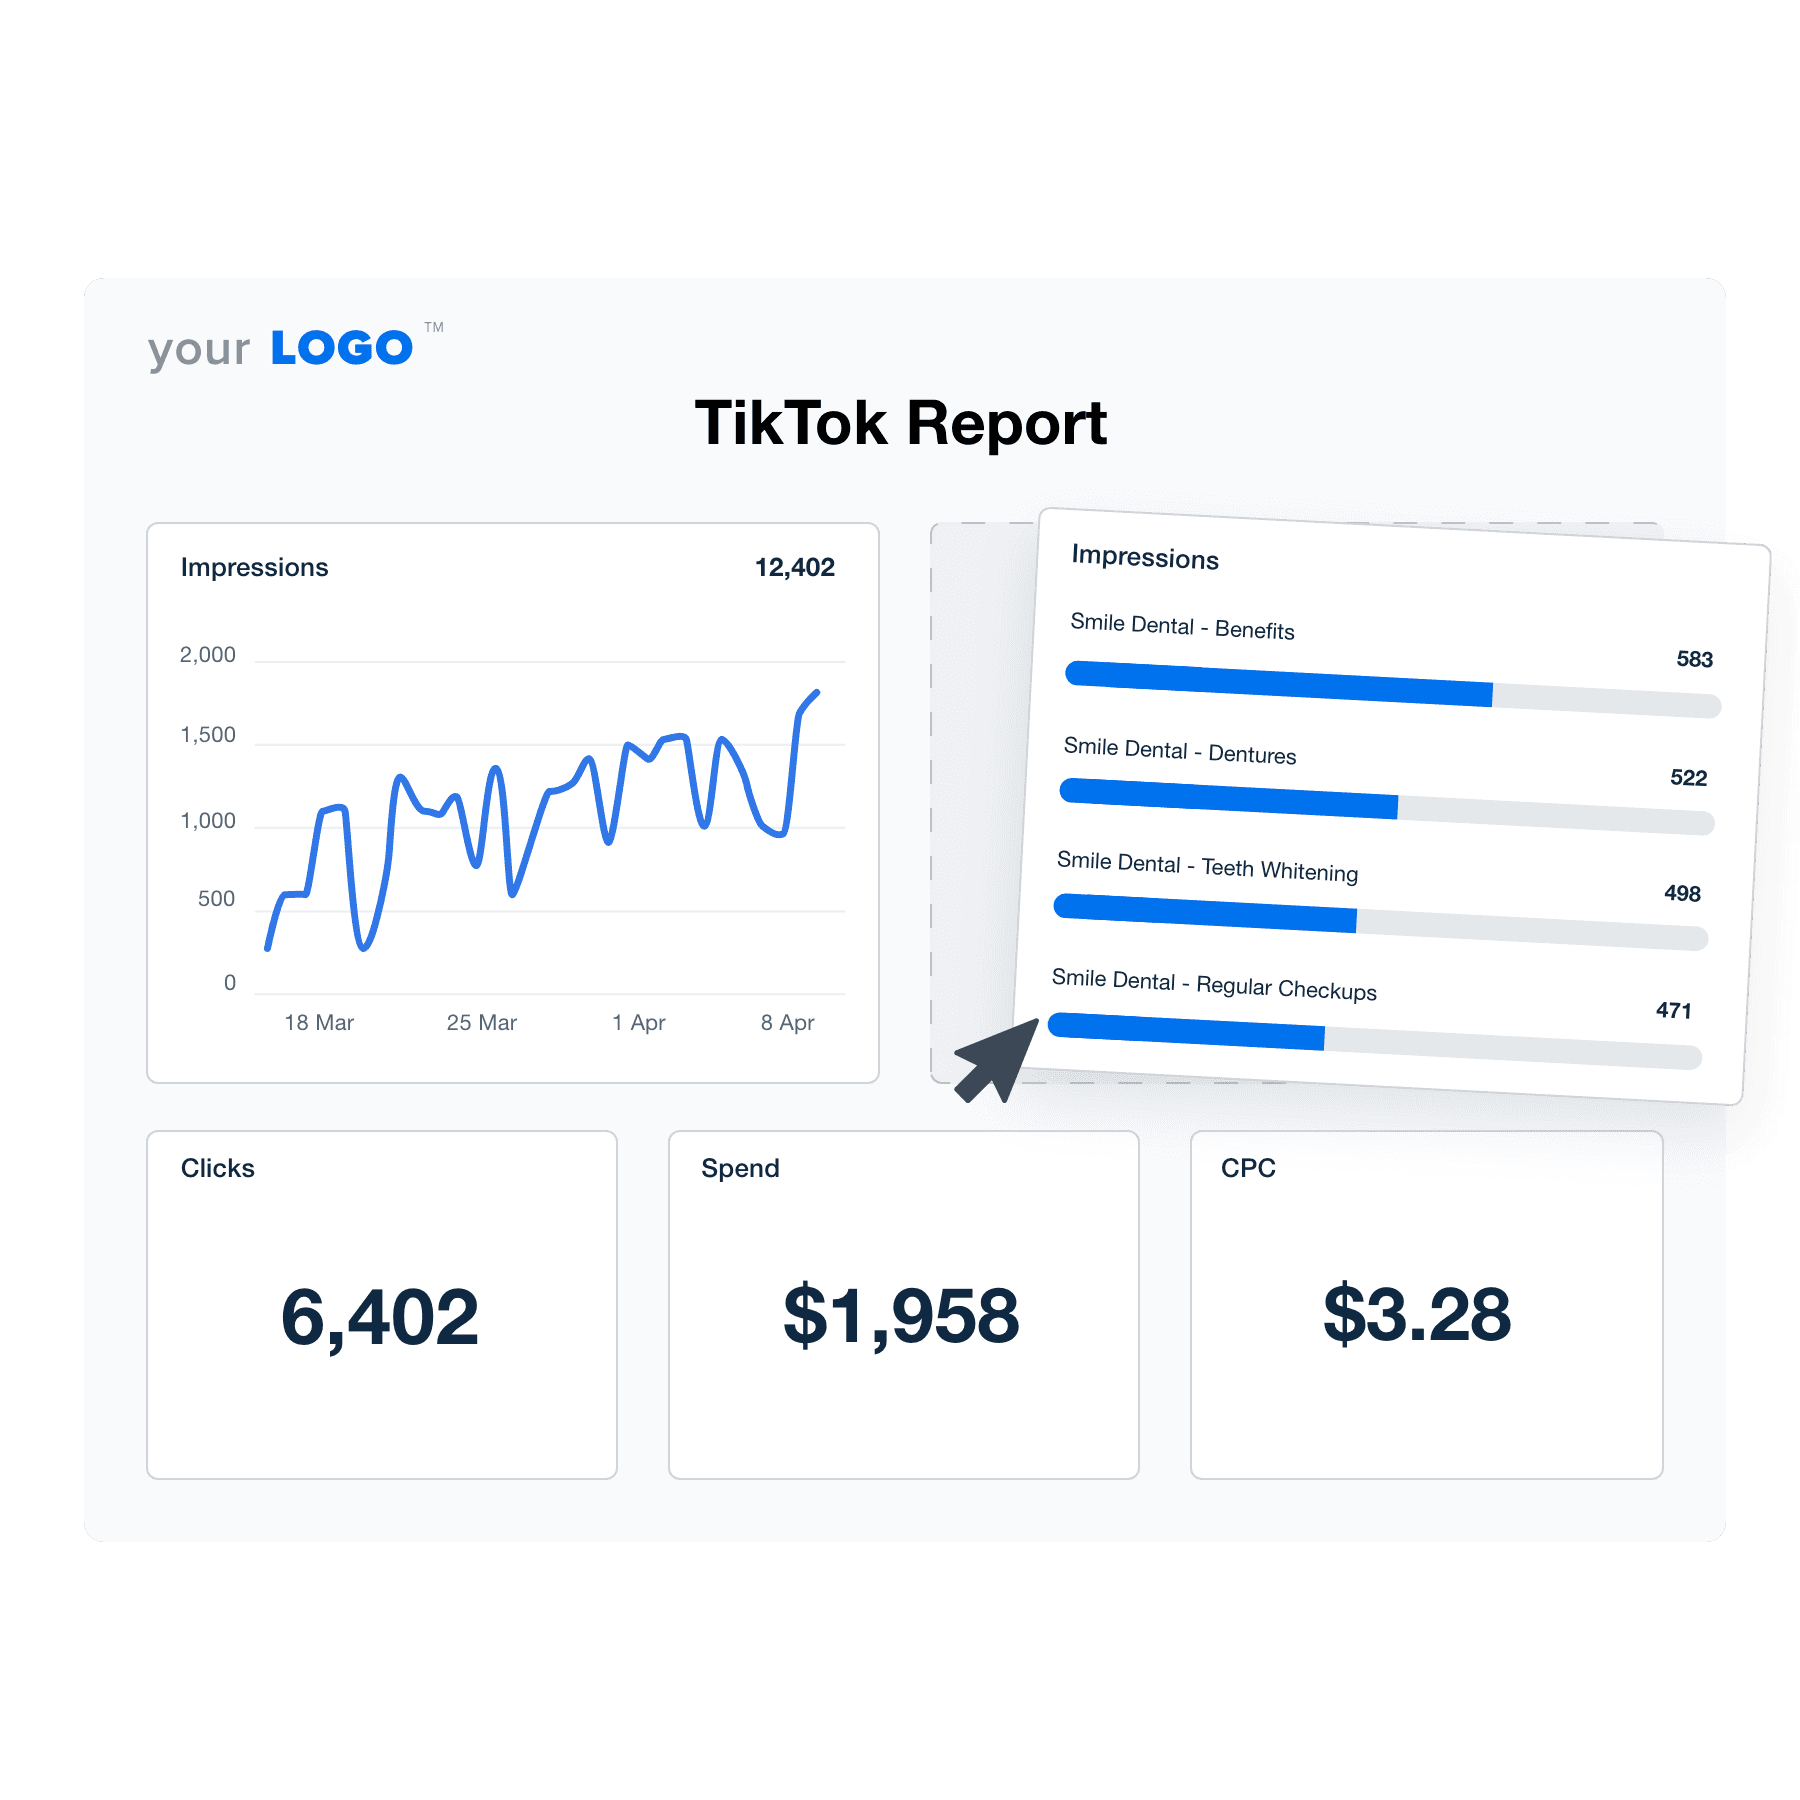
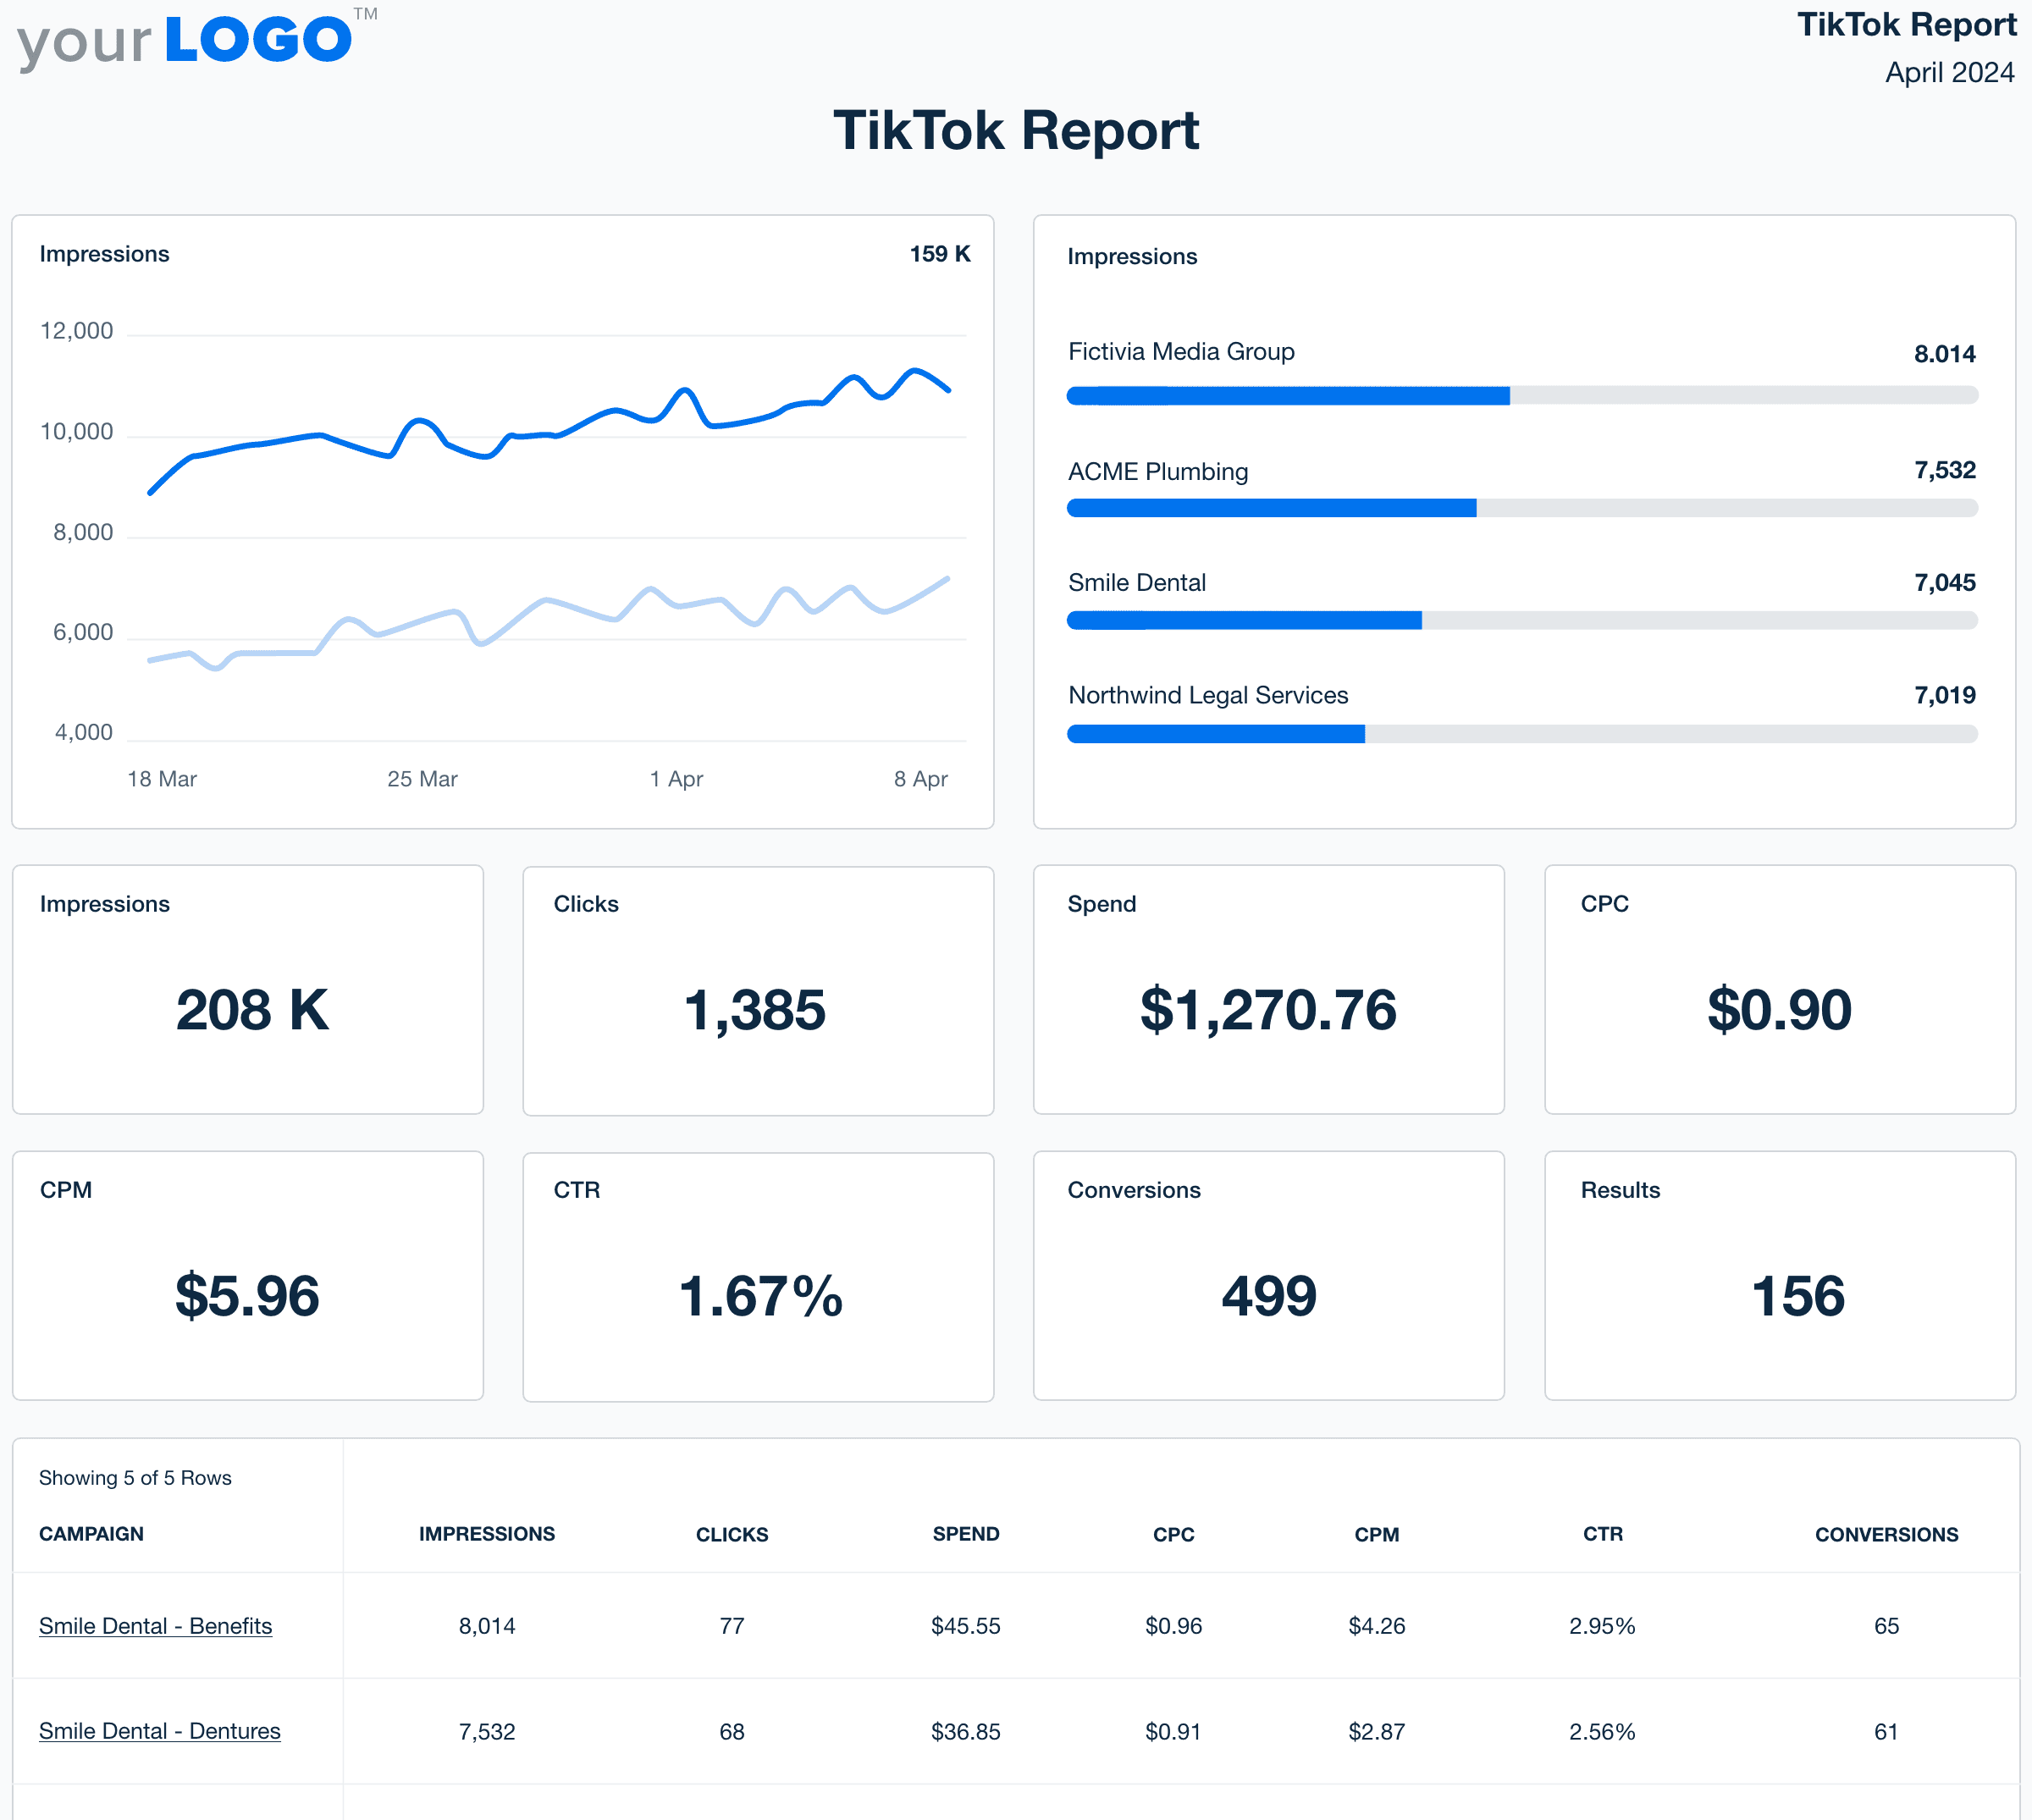
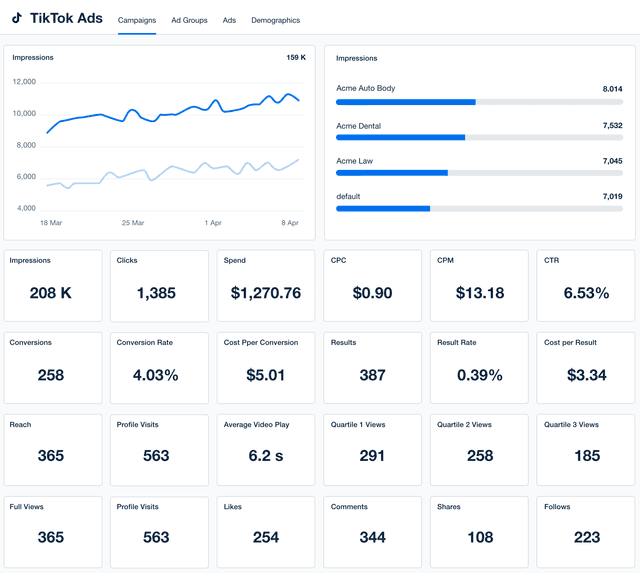
Say hello to efficiency with a TikTok report template designed specifically for agencies. No more manual data collection–this tool automatically retrieves TikTok data directly from business and ad accounts. Optimize preparation time, schedule reports in advance, and present actionable insights to your clients.
TikTok Report Template Example

Why Your Agency Needs a TikTok Report Template

Turn the volume up on efficiency with a TikTok report template! It’s just what your agency needs to make the most of those precious billable hours. This handy tool automatically pulls data directly from the platform, so there’s no need to log in manually each time. The result? More time to focus on strategy instead of tedious data compilation.

Here’s another bonus–this template is fully customizable based on your client’s preferences. Want to add insights from other platforms? Done. Need to rearrange a few sections? Easily drag and drop widgets as your agency sees fit. Visualize metrics, include annotations for context, and so much more. 

Reporting doesn’t have to be a snooze, either. Simply infuse your agency’s branding and colors with the white label feature. It’s a way to reinforce your identity and enhance professionalism, all with minimal effort. 

This template is a non-negotiable to speed up reporting, automate data retrieval, and create a process that grows with your agency.

Create Professional TikTok Reports in Minutes

Start Your Free Trial Today

14 Key Sections Included in a TikTok Report

1. Cover Page

Reporting isn’t always just about the numbers; it’s a way to strengthen credibility and create a great first impression. 

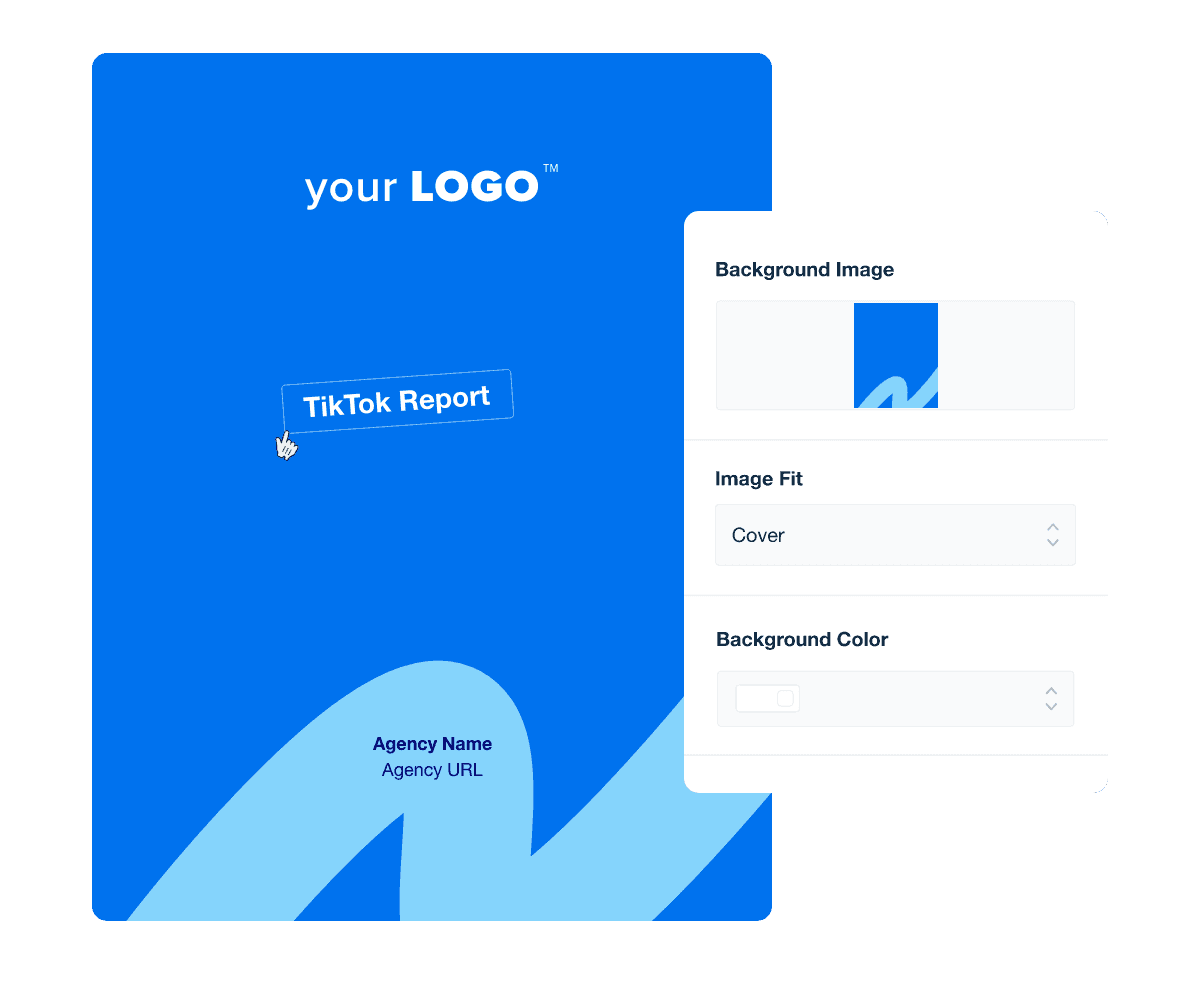
To start things on a good note, include a branded cover page with every TikTok report. It’s a subtle way to boost client confidence and set your agency apart from the competition. Demonstrate your commitment to high quality right from the start. 

TikTok Report Cover Page Example

Remember to indicate the reporting period on cover pages–be it monthly, quarterly, or another cadence. It’s a way to provide context, ensuring clients know what to expect. 

After you’ve created a standout cover page, it’s easy to replicate it across other reports. This results in consistent branding across all reports, reducing preparation time.

2. Executive Summary 

Aside from a stellar cover page, every client report needs a well-written executive summary. This review gives decision-makers a snapshot of results without having to read the entire document. It’s a way to respect their busy schedules and get straight to business, while setting the stage for those who want deeper engagement. 

TikTok Monthly Report Summary Example

To craft an effective TikTok report summary, be sure to:

  • Prioritize Key Metrics: Identify and focus on the metrics clients care most about (e.g., CPC and Conversion Rate).

  • Be Concise: Use clear, straightforward language to summarize findings without overwhelming detail.

  • Contextualize Data: Briefly explain the significance of these metrics and link them to specific outcomes where possible (e.g., increased online sales). 

3. Net Followers

Net followers represent the difference between the total number of new and lost followers for a specific period. In essence, this metric shows whether your client’s audience has experienced growth or a fall.

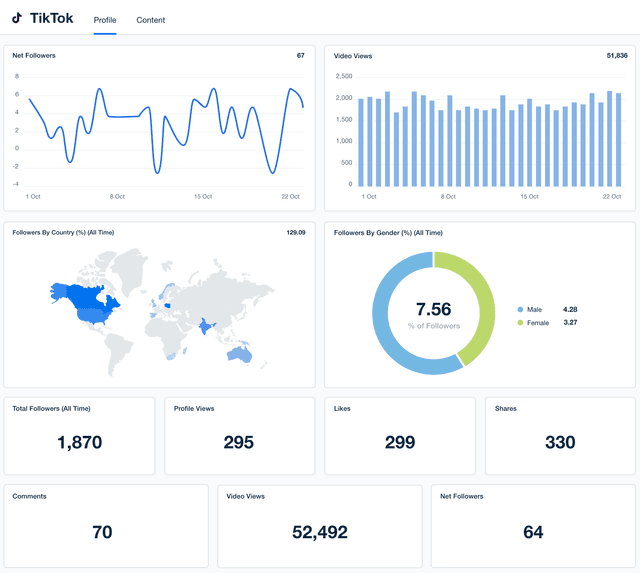
Track and report on TikTok demographics metrics like Followers by Country and Gender.

Use this metric to understand whether your client’s content resonates with users and attracts a growing follower base. If there’s a decrease or stagnancy, explore strategy tweaks like infusing storytelling or providing more valuable takeaways.

4. Video Views

Video views are counted when a video starts playing after appearing on a user’s feed (not including replays).

TikTok Video Views Metric Widget Example from the TikTok Report Template

A high number of video views demonstrates your agency’s ability to develop watch-worthy and creative content. It also reassures clients that their content is gaining traction. 

There are a few ways to address a low number of video views. For example, it may mean refining hashtags, collaborating with influencers, and ensuring your client isn’t on a private account. Also, explore the following forms of content for variety: 

  • Short videos to get the message across quickly. 

  • Duets with other users in the community. 

  • Slideshows that are relevant to your client’s business category.

5. Profile Views

Profile views represent the number of times users have visited your client’s profile page, providing a measure of brand curiosity.

Track and report on TikTok follower and video view growth for your clients.

This metric showcases your agency’s success in generating user interest and encouraging further exploration. 

To get the most from this data, analyze the demographics of profile visitors on your client’s account. Then, identify trends, and create tailored content if appropriate. 

6. Engagement

Engagement includes user actions such as likes, comments, shares, and saves. Remember that the TikTok algorithm favors content that generates user interaction, so this metric is especially important.

TikTok Engagement Data Visualization Example

To encourage engagement, incorporate action-oriented captions, text, and voiceovers (e.g., verbally asking viewers to tap “Share”). Also, create authentic and relatable content to spark their interest.

As a best practice, periodically review TikTok’s community guidelines and what’s defined as inappropriate content. Aside from obvious violations (e.g., videos with violence, harassment, fraud, or firearms), research what other content has been removed globally by moderators. 

What happens if your client’s content seems fine, but it was reported or suspected of breaches? Submit an appeal. Once it’s reviewed, you’ll be notified of any changes. 

7. Average Time Watched

Average time watched measures the duration viewers spend watching a video. The higher the metric, the more viewers are interested in this content. 

TikTok Average Time Watched Stat Widget Example

Including this metric in a TikTok report demonstrates your agency’s ability to reach audiences and capture their attention. In turn, this enhances the value provided to clients. 

Use an interesting hook to address a low average time watched and get the message across quickly. Also, use high-quality visuals and include dynamic elements (like catchy music or transitions) to keep viewers engaged.

Don’t Waste Another Billable Hour on Manual Reporting!

Try AgencyAnalytics Free for 14 Days

8. Click-Through Rate (CTR)

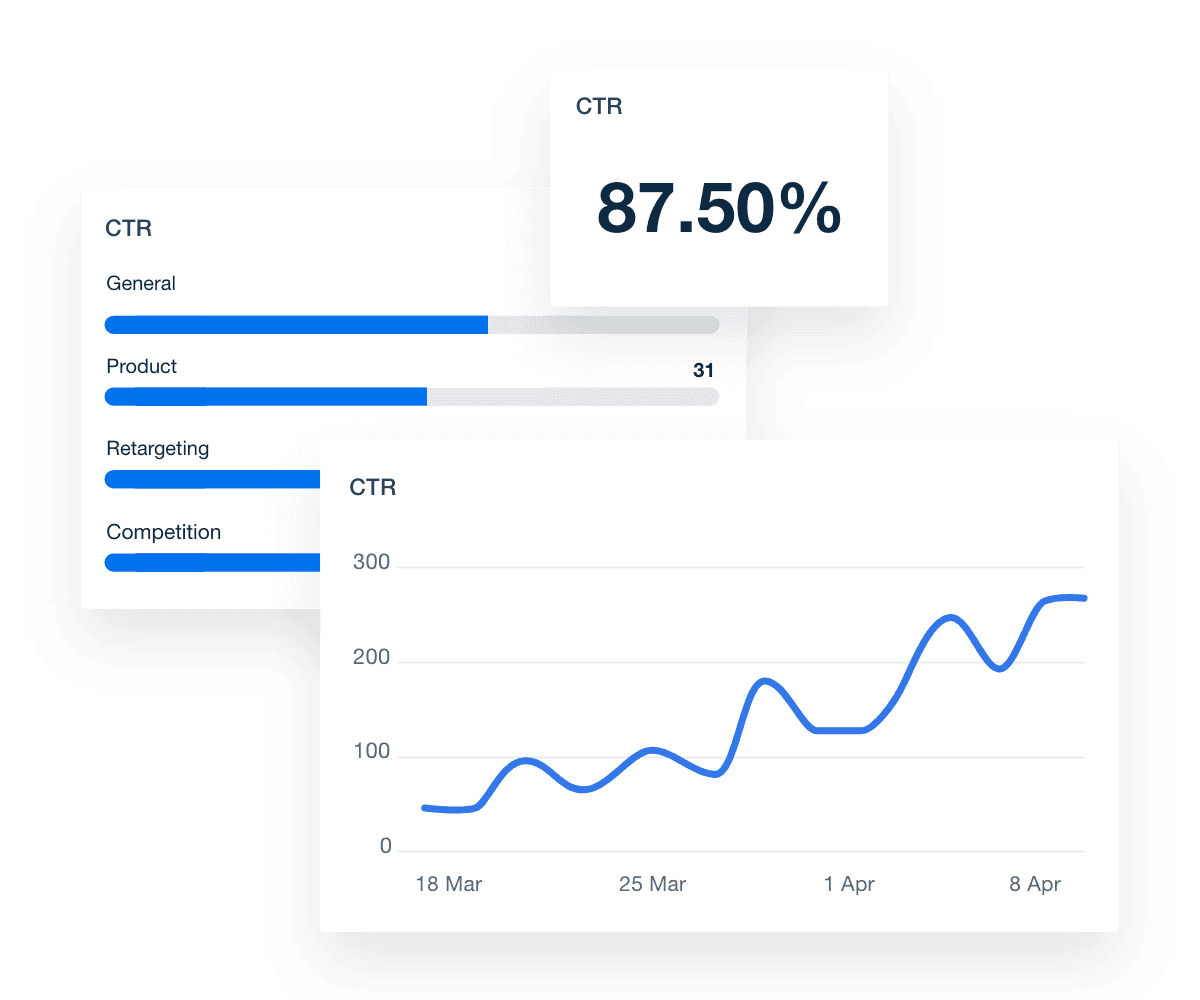
Click-through rate (CTR) measures the percentage of viewers who click on a link within TikTok content. It indicates the effectiveness of a call-to-action, such as a “Download Now” or “Learn More” button.

TikTok CTR Metric Widget Example

A high CTR indicates that your client’s TikTok content is appealing and provides value to viewers. It’s also a way to lower cost per click (if your client runs a TikTok ad), which increases the campaign ROI. 

To maximize CTR, optimize call-to-action placements and keep things concise. Also, offer products, services, or resources that provide value. 

9. Conversion Rate

Conversion rate is the percentage of viewers who take a desired action after viewing your client’s TikTok post or ad (e.g., making a purchase). Often, it directly reflects the effectiveness and ROI of TikTok campaigns. 

TikTok Report Template Conversion Rate Metric Example

This metric shows your agency’s ability to convert user engagement into concrete actions. To address a low conversion rate, continuously test different content styles, ad formats, and CTAs. Also, write engaging captions that encourage interaction.

10. Cost Per Conversion

Cost Per Conversion quantifies the expense incurred for each successful action, like an online purchase or a form sign-up.

PPC cost per conversion metric in PPC Dashboard template

When this number is low, it means that a significant number of conversions are generated from the ad spend. In other words, your client is receiving more bang for their buck. 

To address a high cost per conversion, target relevant audiences that may be more inclined to complete a call to action. Also, explore an alternative bidding strategy (e.g., “Maximum Delivery” in TikTok Ads Manager) to generate more conversions. 

11. Cost Per Click (CPC)

Cost per click (CPC) measures the amount paid each time a viewer clicks on a link or call to action in your client’s TikTok ad. It provides more insight into ad effectiveness and the financial efficiency of these campaigns. 

TikTok Cost-Per-Click Line Graph Example

A low CPC indicates that more clicks are generated for the same budget, improving overall campaign performance. 

On the other hand, a high CPC may indicate that ads are not resonating well with your client’s target audience. To address this, test different ad creatives, improve targeting, and ensure content is engaging enough.

12. Total Ad Spend

Total Ad Spend refers to the amount your client has invested in TikTok ad campaigns. This includes all associated ad costs, such as bidding and placements. 

TikTok Ads Spend Data Visualization Example

Reporting on total ad spend is a way to ensure financial transparency, which builds trust with clients. It's also helpful to evaluate if this ad spend generated sufficient results to justify the investment.

13. Google Analytics Social Media Breakdown

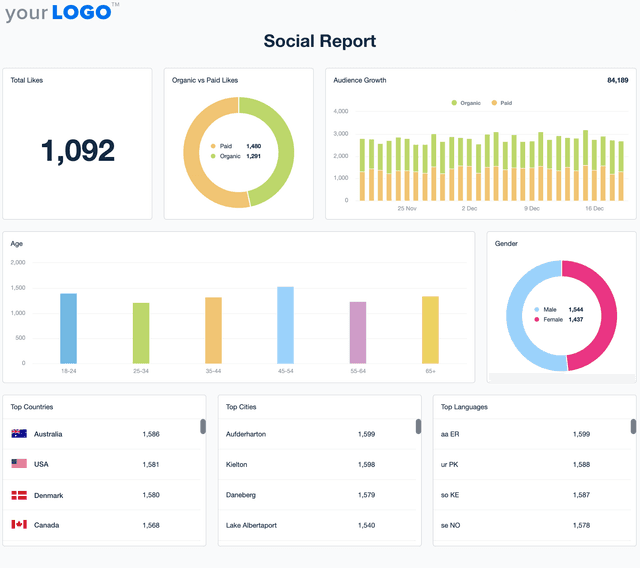
Want to showcase what happens after they click from TikTok to the client's website? Create a custom dashboard template that includes the Google Analytics social media breakdown to present a cross-channel comparison and highlight the full impact of TikTok and other social media campaigns.

This section shows the correlation between social media efforts and website traffic, showing how users move through the customer journey. 

A screenshot of Google Analytics data in the social media report

This breakdown includes website metrics like sessions, goal completions, and bounce rate. Therefore, it’s a way to evaluate user behavior beyond the app and determine the most effective social media platforms. 

14. Detailed Demographic Data

Demographic data is a way to understand the detailed characteristics of your client’s TikTok audience. This includes insights based on age, gender, geographic location, and device type. 

TikTok Ads Reporting

Understanding who most frequently views or interacts with your client's content makes it easier to create targeted content. It also leads to more precise targeting in TikTok ad campaigns, which translates into better results. 

To provide maximum value, include a demographic breakdown for key metrics like CPC, CTR, and conversion rate. 

15. PPC Markup

Add another layer of transparency by including a PPC markup, which is a fee or percentage added to the actual cost of running TikTok ads. 

Add Your Markup to Client PPC Data in Facebook ads dashboard

This markup covers your agency’s services like ad management, creative development, and optimization. By including it in TikTok reports, clients will have a better understanding of their total spend, helping them manage budgets more effectively. 

Don’t Waste Another Billable Hour on Manual Reporting!

Try AgencyAnalytics Free for 14 Days

Customizable TikTok Report Templates To Meet Client Needs

In the early agency days, manual reporting methods (like copying and pasting screenshots into an Excel spreadsheet) were manageable. That said, it’s not a sustainable method as your agency grows, adds new clients, and takes on more projects.

Do you really want to expend all that effort on compiling metrics and formatting reports? Unless you’re a fan of wasting billable time, the answer is probably no. Luckily, a client reporting platform like AgencyAnalytics removes that hassle, giving you more time to focus on high-level tasks. 

You don’t have to settle for cookie-cutter reports, either. In a few clicks, drag and drop widgets from over 80 platforms, add a text box (or two), or toggle with a range of intuitive visualizations–the possibilities are endless. 

A screenshot showing the TikTok Drag-and-Drop Report Builder

Got insights to include outside of the TikTok app or built-in integrations? No problem! Simply drop the data into Google Sheets and import it directly into AgencyAnalytics. 

In a few clicks, transform these numbers into charts or add them to reports–it’s that simple!

The features and integrations are spot-on. It is mission-critical to be able to have one location and dissect all your marketing, SEO, social media efforts in one location without having to implement 20 different tracking and reporting tools to do the same thing this platform does.

Mark Battalini
Mark Battalini

SEO Mavericks

Spend More Time on Strategy, Less Time on Client Reporting

Try AgencyAnalytics FREE for 14 Days!

TikTok Report Templates as Unique as Your Agency

A Unified View

Instantly Access All Your Clients’ TikTok Metrics

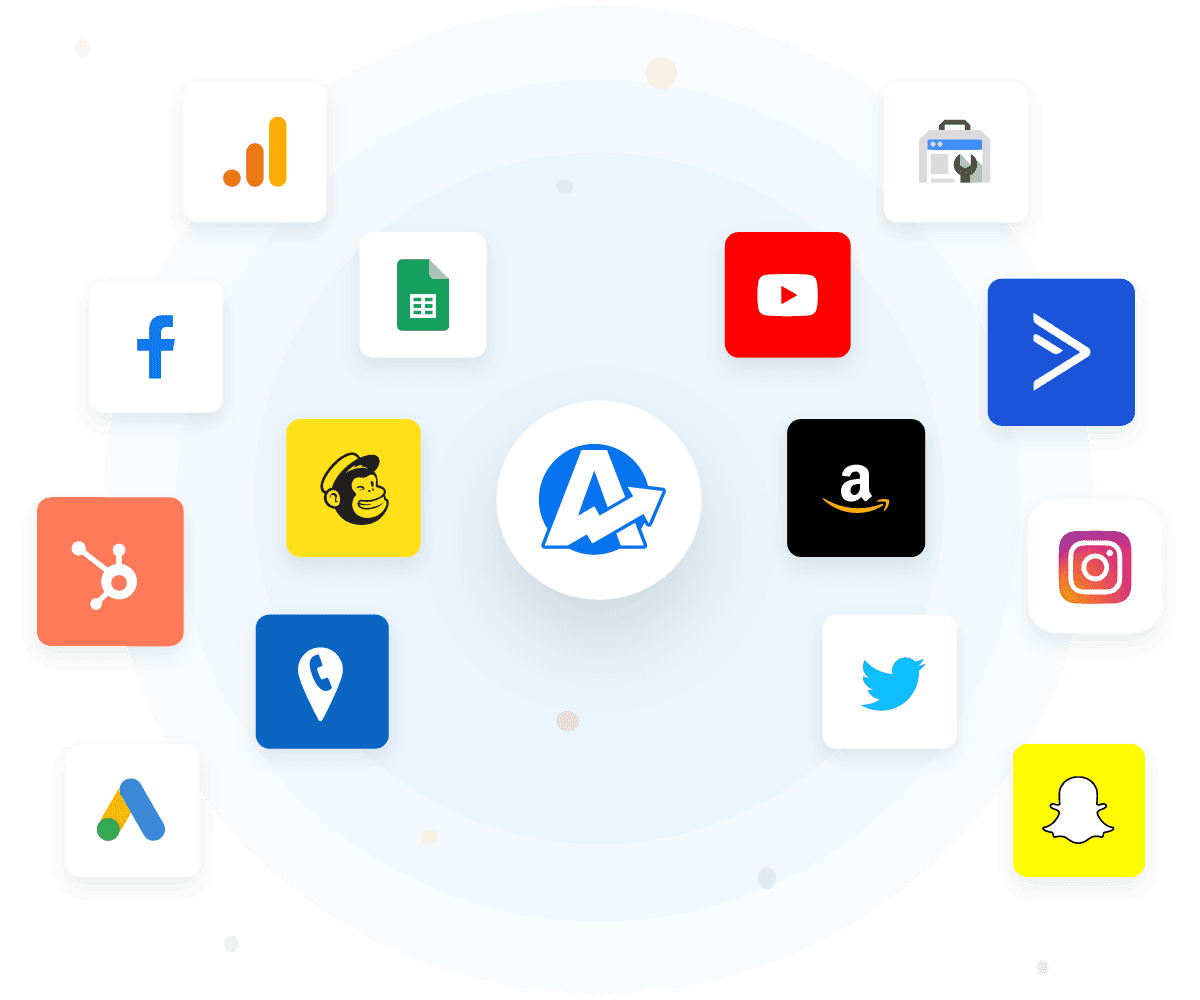
Access 80+ marketing integrations, no matter which pricing option you choose. Automatically consolidate metrics into a dashboard or report with minimal effort involved. 

No need to manually log into ad accounts or other platforms. Invest in a tool that centralizes data, slashes report preparation time, and helps your agency deliver impactful results. 

A sample of third-party integrations that are on the AgencyAnalytics client reporting software
Streamline Your Workflow

Create Client Reports in Minutes–Not Hours

Why create a report from scratch each time? Use a professional, pre-built template instead. Free up your valuable time and reinvest it into more high-level, strategic tasks.

Need a touch of customization? Rearrange widgets, include annotations, or create custom metrics–it’s all at your fingertips.

Automate Your Client Reporting in Minutes
Brand It Your Way

White Label Your TikTok Reports

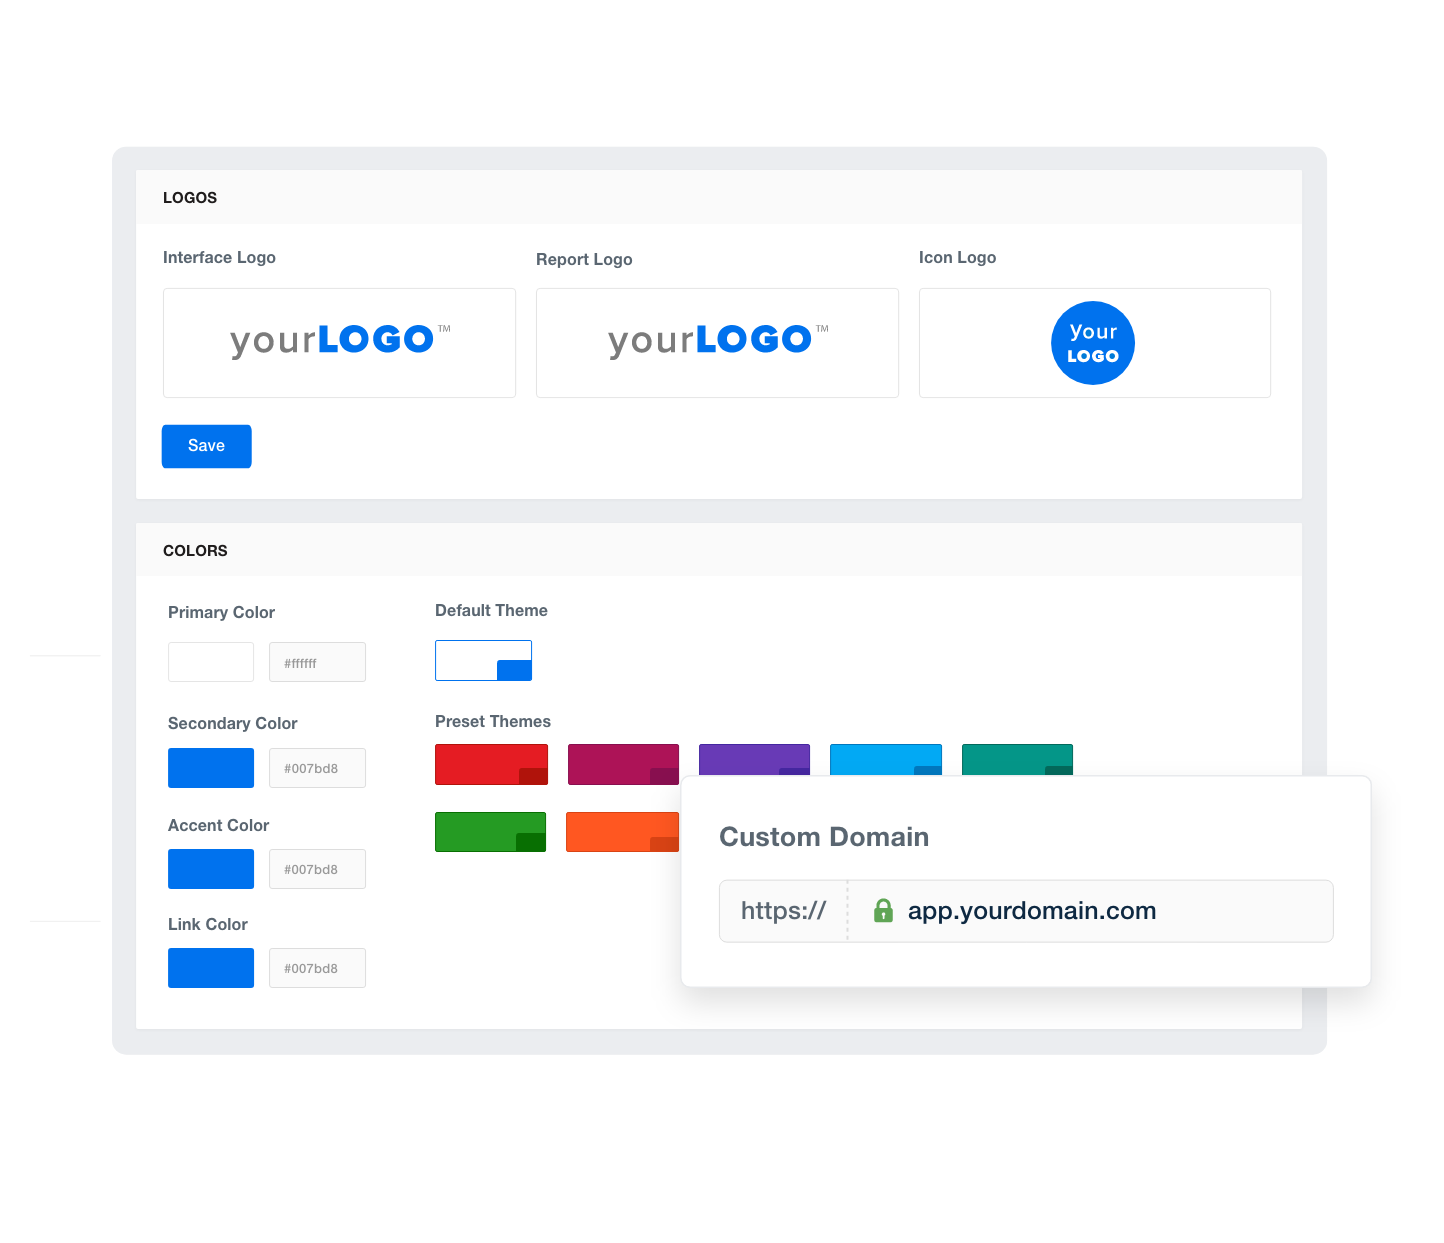
Enhance your agency’s brand image effortlessly. With the white label feature, infuse your logo, brand colors, and even a custom cover page directly into any report. 

Create a seamless branding experience with every piece of collateral. Impress clients with your attention to detail and commitment to excellence.

Add Your Own Branding To Your Customizable SEO Reporting Software
Success Mapping

Set Campaign Goals and Hit Targets

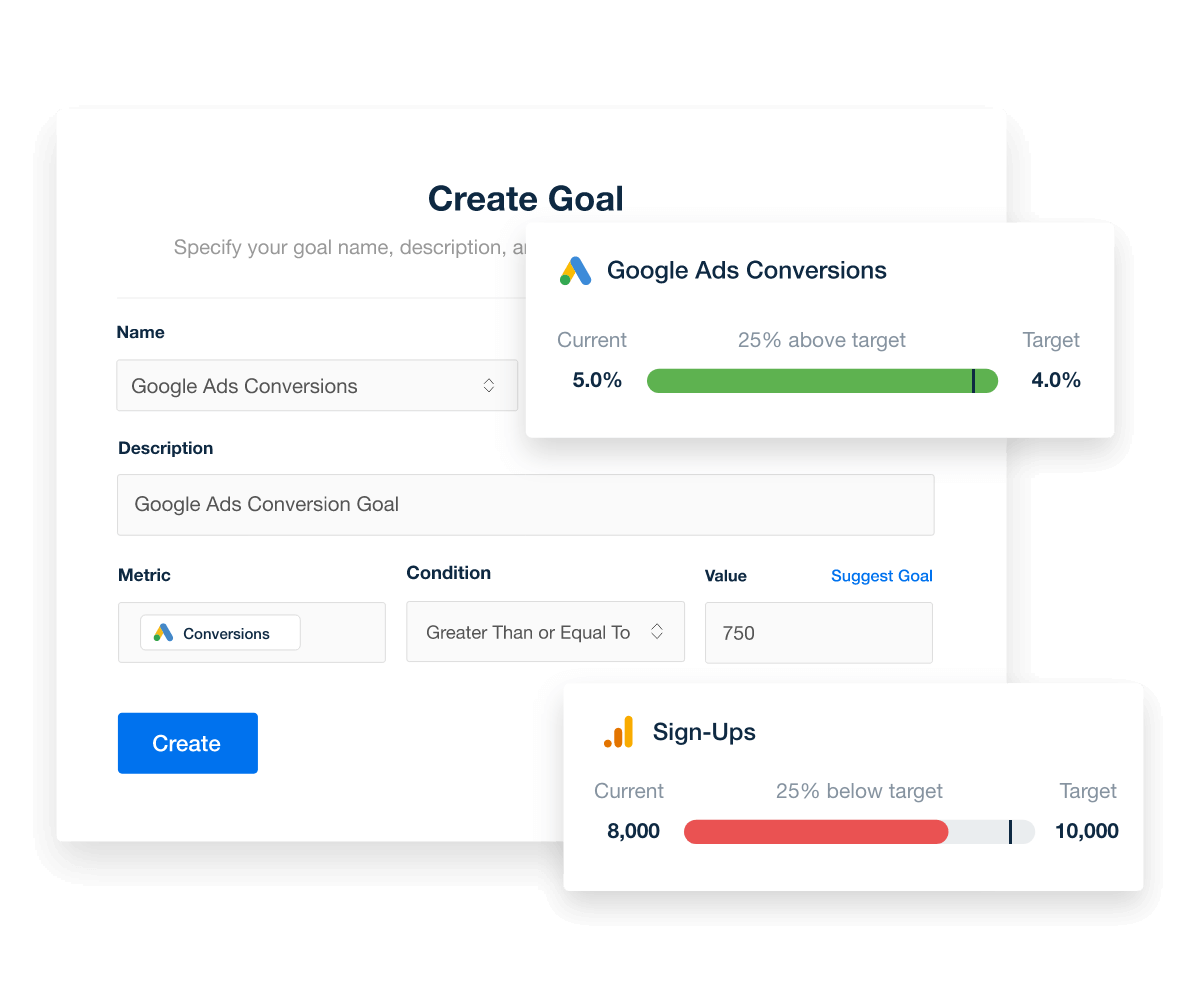
Report on the insights that matter most to your clients. Create, track, and monitor custom goals. Highlight milestones and show whether your clients are on track to meet their targets.

Take data transparency up a notch. Keep your team accountable and earn your client’s trust over time.

Set goals and hit your performance targets
On-Time Delivery

Put Your TikTok Reporting on Autopilot

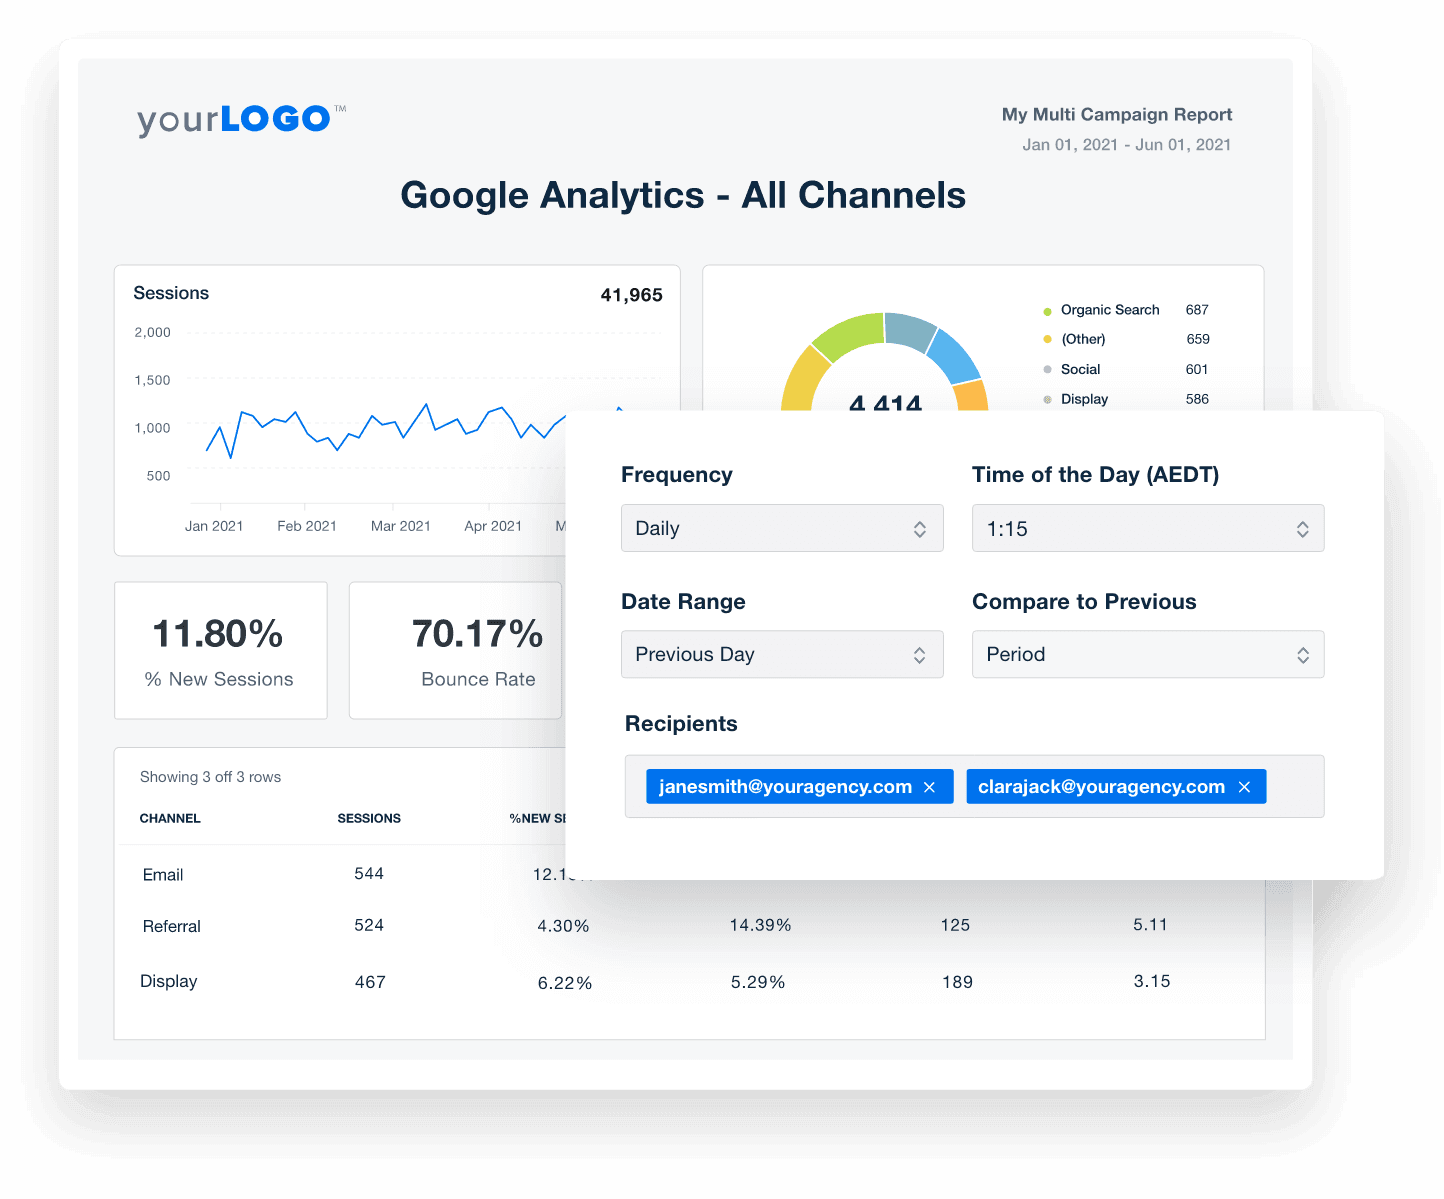
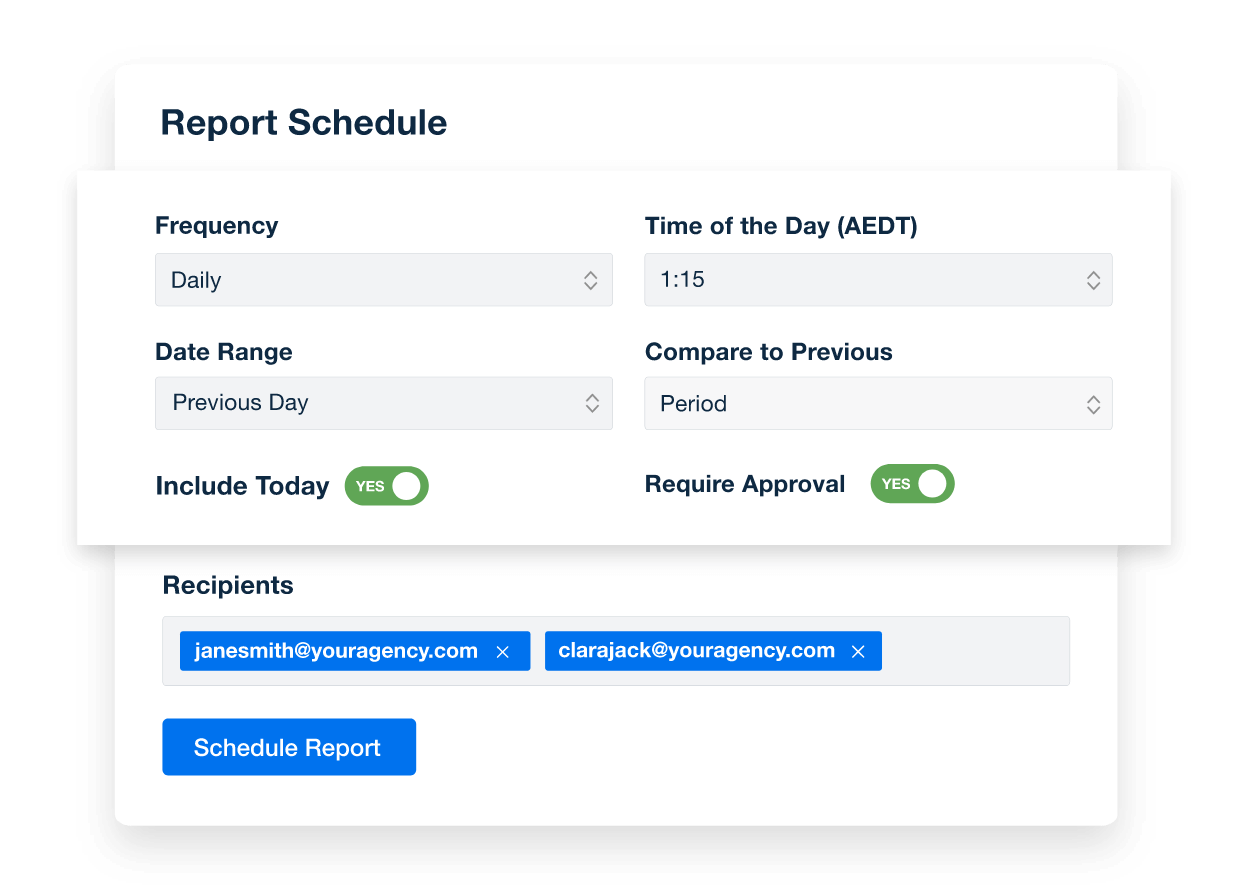
Schedule reports in advance and eliminate the last-minute rush. With this handy feature, you’ll ensure clients receive timely updates at consistent times. Even request their review and approval–all in-platform! Crumple those Post-It reminders and rely on an automated system that just works. Got clients in other countries and around the world? No problem–choose a send time based on their time zone.

How to Schedule Automated Marketing Reports for Marketing Agency Clients
Reporting Has Never Been Easier

11-Second Smart Reports

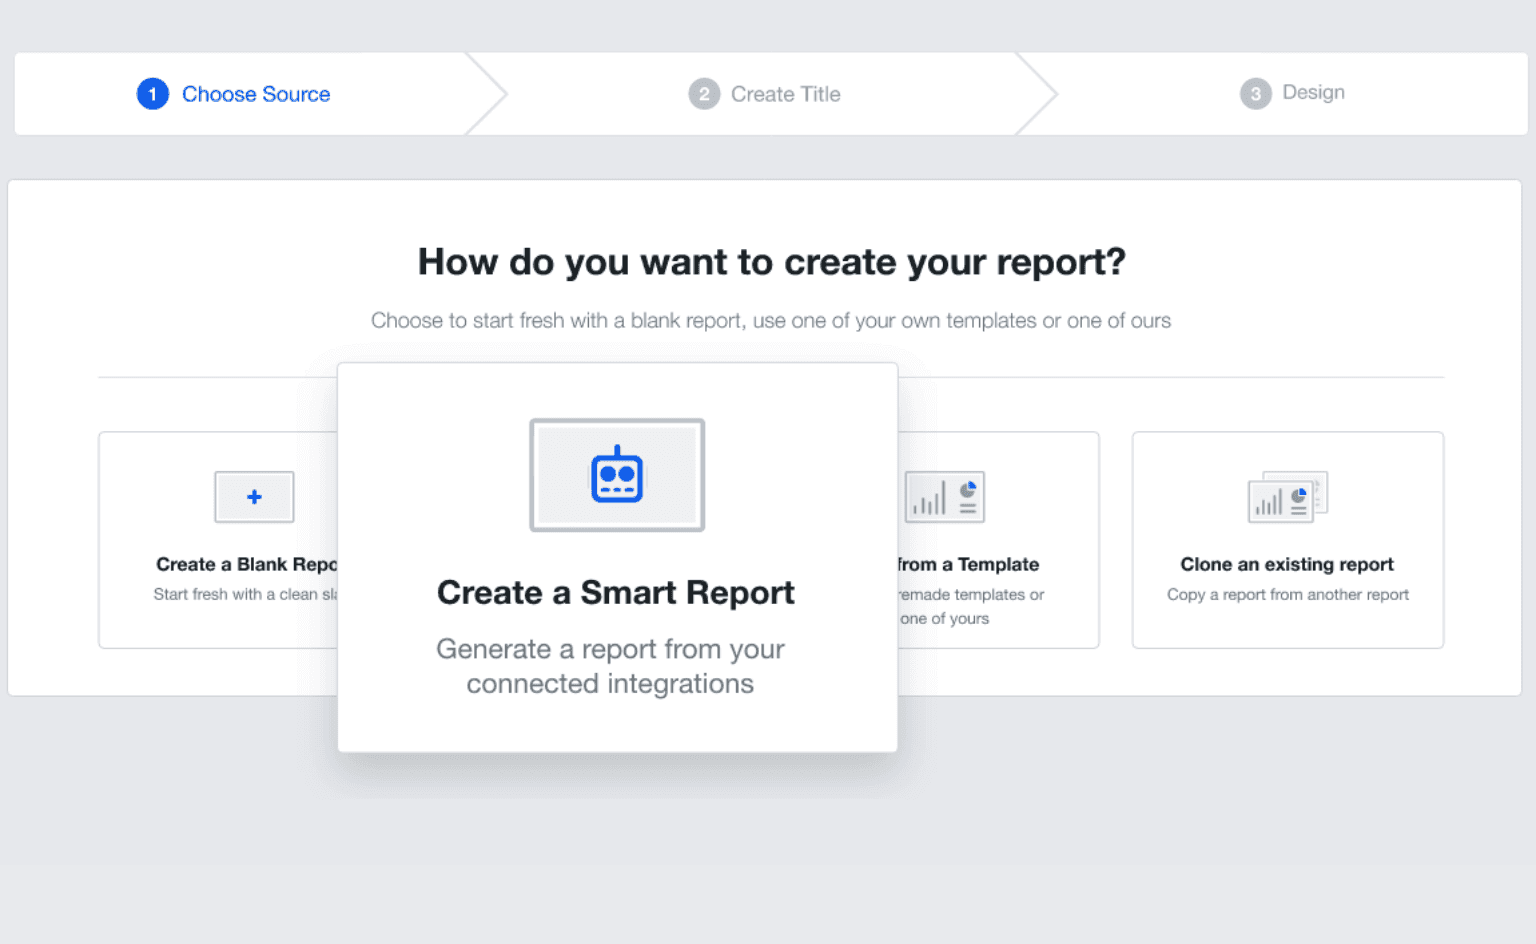
Integrate TikTok with AgencyAnalytics and create an auto-populated report with your client’s custom data–in just 11 seconds! 

Opt for a Smart Report or a pre-built template–it boils down to your agency’s preferences. Select report type and follow the instructions provided to get started. For extra support, reach out to our 24/5 customer specialist team. We’re happy to help! 

Smart Reports Press Release Feature Image

By consolidating all of our tools into dashboards, we have saved so much time and money—it’s truly been invaluable.

Jason Hylan
Jason Hylan
Clix

Get Started for Free

Try AgencyAnalytics risk-free for 14 days. No credit card required.
AgencyAnalytics Dashboard Preview

Create Your Own TikTok Report Template in Seconds!