Table of Contents
QUICK SUMMARY:
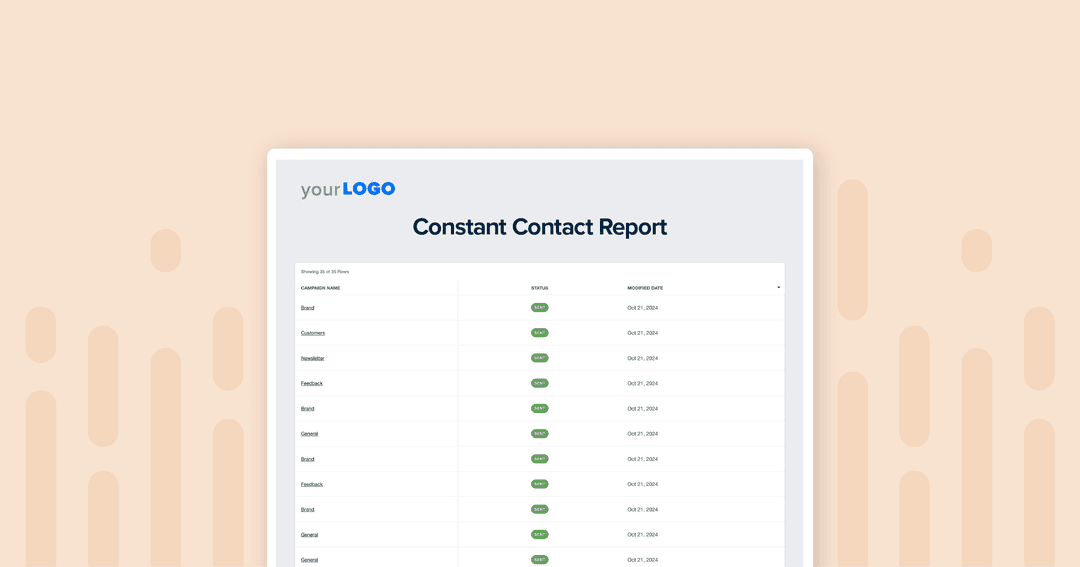
Constant Contact analytics track key email metrics like open rates, click-through rates, and bounces to reveal how well campaigns connect with audiences. Beyond surface-level metrics, advanced insights like click-to-open rates and bounce rates uncover real engagement, helping agencies refine strategies for better client results. This guide covers the important metrics that transform Constant Contact data into actionable insights.
In the Constant Contact platform, it’s easy to get lost in the list of metrics, without gaining insight into what actually resonates with audiences.
For example, a high email open rate might look promising at a glance, but if those opens don’t translate to clicks or conversions, they’re just surface numbers.
Instead, deeper metrics like click-to-open rate or bounce rate reveal more about list health and engagement quality, helping you pinpoint where real connections—and potential opportunities—are happening.
Focusing on these metrics helps agencies go beyond simply relaying campaign performance status. Instead, agencies uncover strategic growth and refinement areas that might otherwise have been overlooked.
In this guide, we’ll highlight the metrics that drive genuine results so your agency will cut through the noise and deliver insights that improve your client’s bottom line.
What Is Constant Contact?
Constant Contact is a popular email marketing platform that gives agencies and businesses tools to manage email campaigns. For marketers, its appeal lies in its ability to track detailed metrics or email analytics that reveal how well campaigns connect with an audience. Constant Contact is all about making each email more effective, helping clients engage their target audience in a meaningful way.
The platform’s analytics track key metrics like open rates, click-through rates, bounced emails, and unsubscribes. These metrics help marketers understand how campaigns are performing and which parts need fine-tuning.
For example, if you notice a high bounce rate, that might indicate outdated email addresses, which typically limit a campaign's impact. Similarly, tracking unsubscribes gives you a sense of how well the content resonates with an audience, showing you if it’s engaging or if adjustments are needed.
Constant Contact also gives marketers a closer view of what drives engagement, like specific links or call-to-action buttons within an email. Knowing which elements work helps build content that truly connects, rather than simply getting an email into the inbox.
Overall, Constant Contact is a great platform that gives you the data needed to improve campaign performance, reduce disengagement, and deliver value in every report you create for clients.
10+ Constant Contact Analytics to Track
Focus on metrics that go beyond surface numbers to help clients see what’s working, what needs refining, and where there’s room to engage their audience more effectively.
Here are some of the most important Constant Contact metrics that give a well-rounded view of campaign success.
1. Bounces
Bounced emails or email bounce rates show how many emails didn’t reach recipients due to invalid or inactive email addresses. Tracking bounces is key to maintaining a healthy email list because high bounce rates affect email deliverability and sender reputation. By monitoring this metric, agencies will clean up outdated contacts, improving the likelihood of future emails landing in inboxes.
2. Click-Through Rate
The click-through rate measures the percentage of recipients who clicked on links within the email. This metric is a key indicator of engagement, as it shows whether recipients are interested enough to take action. A high click-through rate means that content is resonating, which can guide future campaign strategies to focus on what drives the most interaction.
3. Clicks
Tracking the total number of clicks provides insight into overall engagement, showing how many times recipients interacted with links or call-to-action buttons. While the email click-through rate provides a percentage, the total clicks give a clearer view of the absolute interest levels across different campaigns or segments, helping clients understand which emails sparked the most interest.
Consider what your brand is about and its email communications objectives. Any metric can be gamed for perceived improvement, and if you just want a higher open rate, you can sensationalize headlines or create clickbait headlines, but what's the point if that's not aligned with your brand and its objectives?
James Middleditch, Director, Digital Group Media
4. Send Date
The send date metric simply logs when an email was sent, but it’s important to understand the campaigns' timing and relevance. By analyzing performance based on the send date, agencies determine if certain days or times yield better open and click rates, allowing for optimized scheduling that aligns with audience habits.
5. Delivered
Delivered emails represent the total number of emails that reached recipients’ inboxes. This metric is fundamental, as it reflects the campaign’s initial reach and helps measure the quality of the email list. A high delivery rate and other metrics signal that an audience list is healthy and ready to engage.
6. Forwards
Forwards or email forward rates indicate how many recipients shared an email with others, offering insight into content virality and value. When recipients forward an email, it shows that they found the content compelling enough to share, which typically boosts campaign reach and attracts new contacts. Monitoring this metric helps identify the types of content that audiences feel are worth spreading.
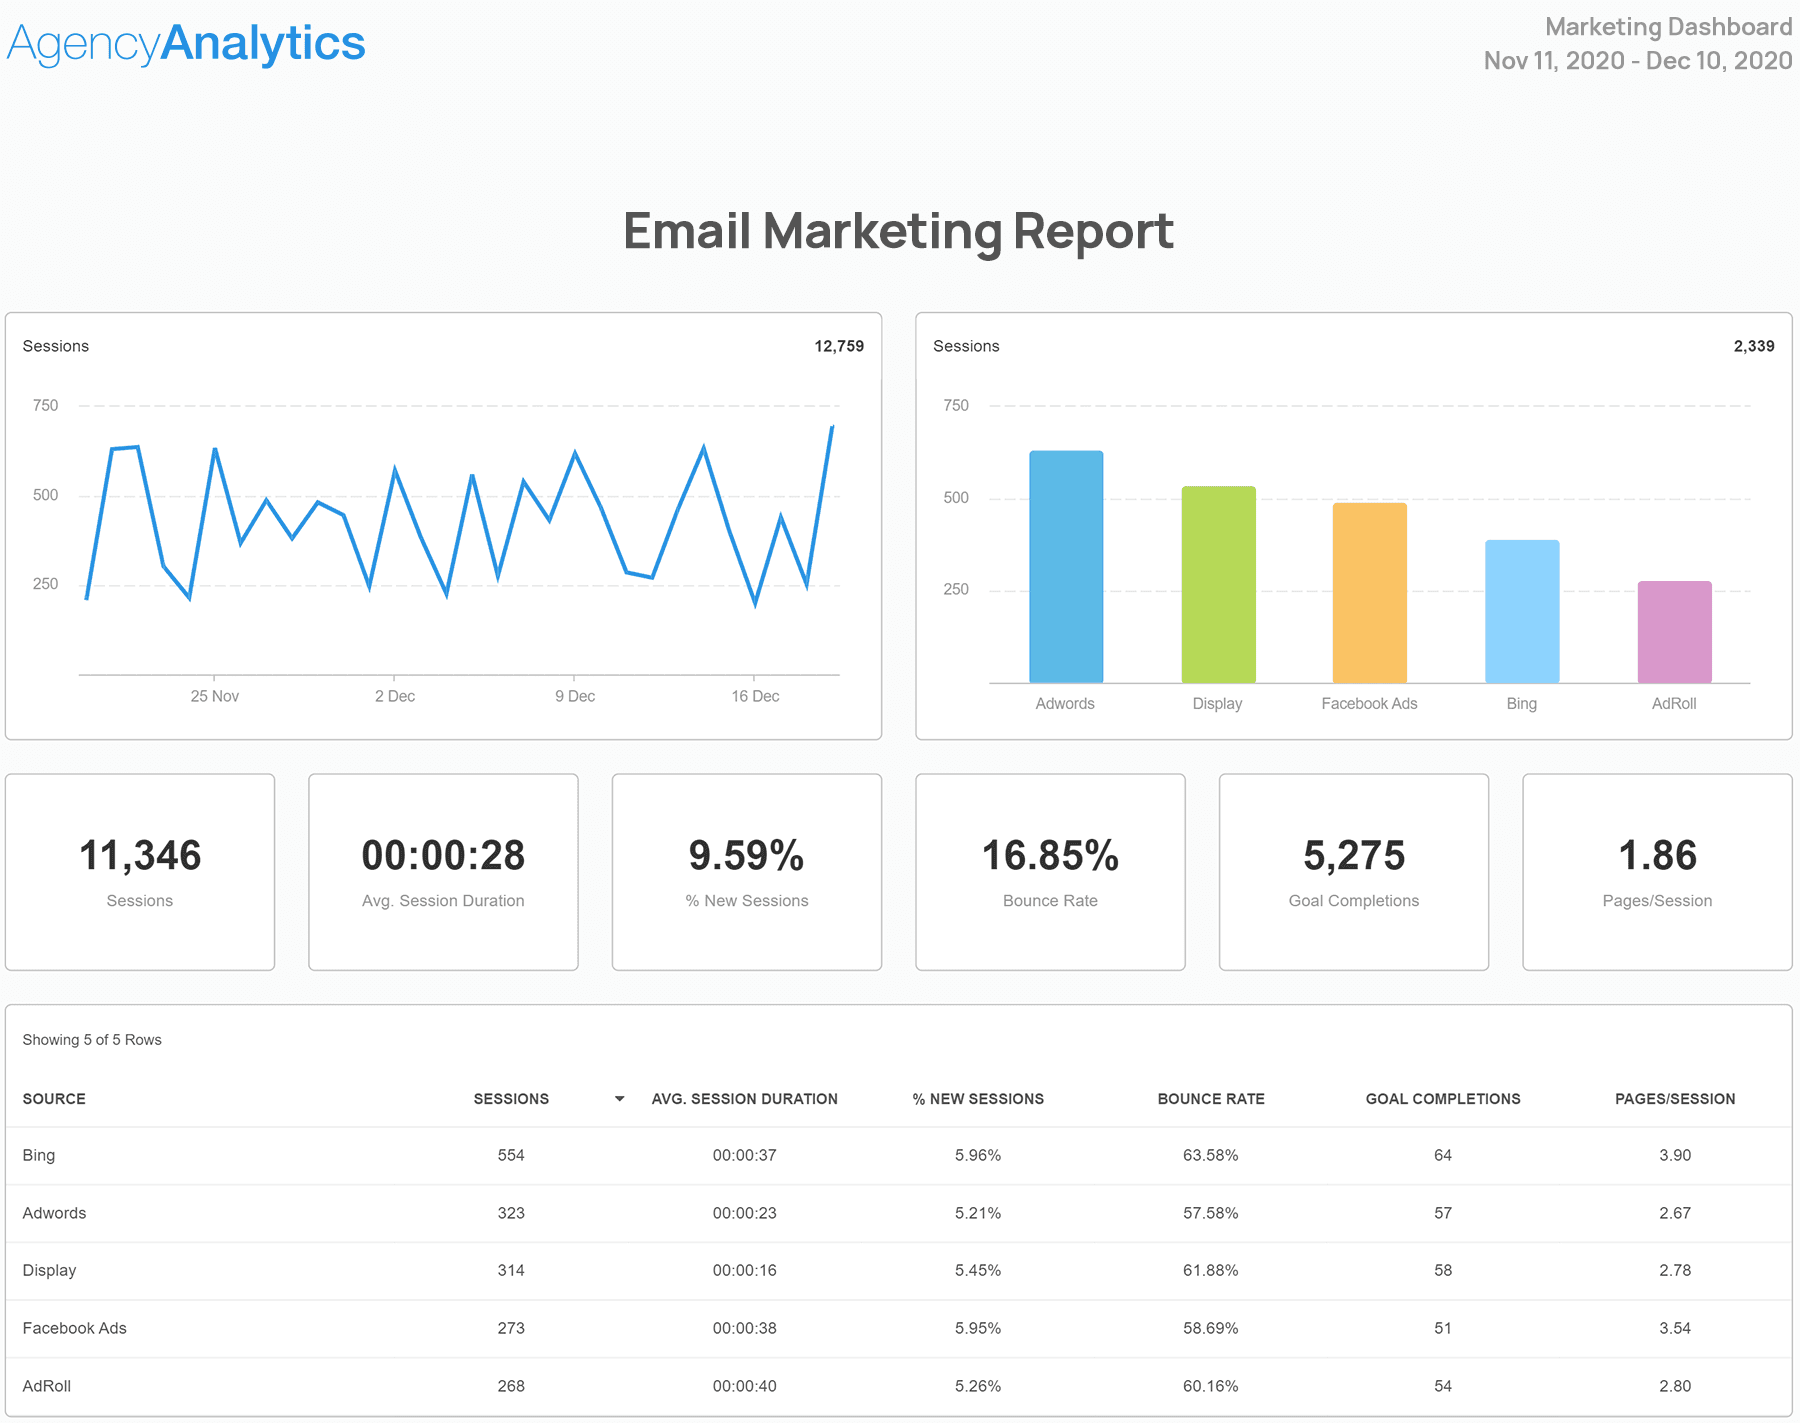
Ditch the time-consuming process of pulling together email marketing data. This customizable email marketing report template does the heavy lifting for you. Try it out free for 14 days.
7. Not Opened
The “Not Opened” metric tracks recipients who didn’t open an email. While it might seem like a negative metric, it can help identify potential list fatigue or disinterest. Tracking this metric over time can guide content adjustments, ensuring that subject lines and content formats stay engaging and relevant for clients’ audiences.
8. Open Rate
Email open rate measures the percentage of delivered emails that were opened. This metric provides a quick snapshot of interest and engagement, particularly for understanding the effectiveness of subject lines. A low open rate might signal that the email didn’t grab attention in the inbox, while a high open rate suggests the opposite.
9. Opens
The total number of opens counts how often recipients opened the email, including multiple opens from the same person. The total opens metric shows if readers are re-engaging with an email, which often suggests a strong interest in the content. Tracking total opens gives a fuller picture of audience interest than the open rate alone.
10. Sends
Sends represent the total number of emails attempted to be sent to recipients before considering bounces. This metric is a baseline for evaluating overall campaign reach and shows the total scope of each campaign effort. Understanding this number helps agencies assess the actual reach of a campaign against other metrics, like delivery and bounce rates.
11. Email Unsubscribe Rate
Email unsubscribe rate tracks the number of people who choose to remove themselves from an email list after receiving a campaign. High unsubscribe rates are a signal to rethink content relevance or frequency. Monitoring this metric helps agencies maintain a healthy email list by balancing engagement with client needs for a retained audience.
Each of these metrics offers distinct insights into how a campaign performed and how it resonated with its audience. These specific Constant Contact email KPIs help agencies create detailed reports that capture the full scope of engagement.
Impress clients and save hours with custom, automated reporting.
Join 7,000+ agencies that create reports in under 30 minutes per client using AgencyAnalytics. Get started for free. No credit card required.
Already have an account?
Log inTurning Raw Constant Contact Analytics Data Into Actionable Insights
Simply sharing raw Constant Contact data with clients isn’t enough to showcase the full value of a campaign. While numbers like open rates and click rates give a snapshot, clients benefit most when those numbers are translated into insights that highlight trends, show audience behaviors, and drive future strategies.
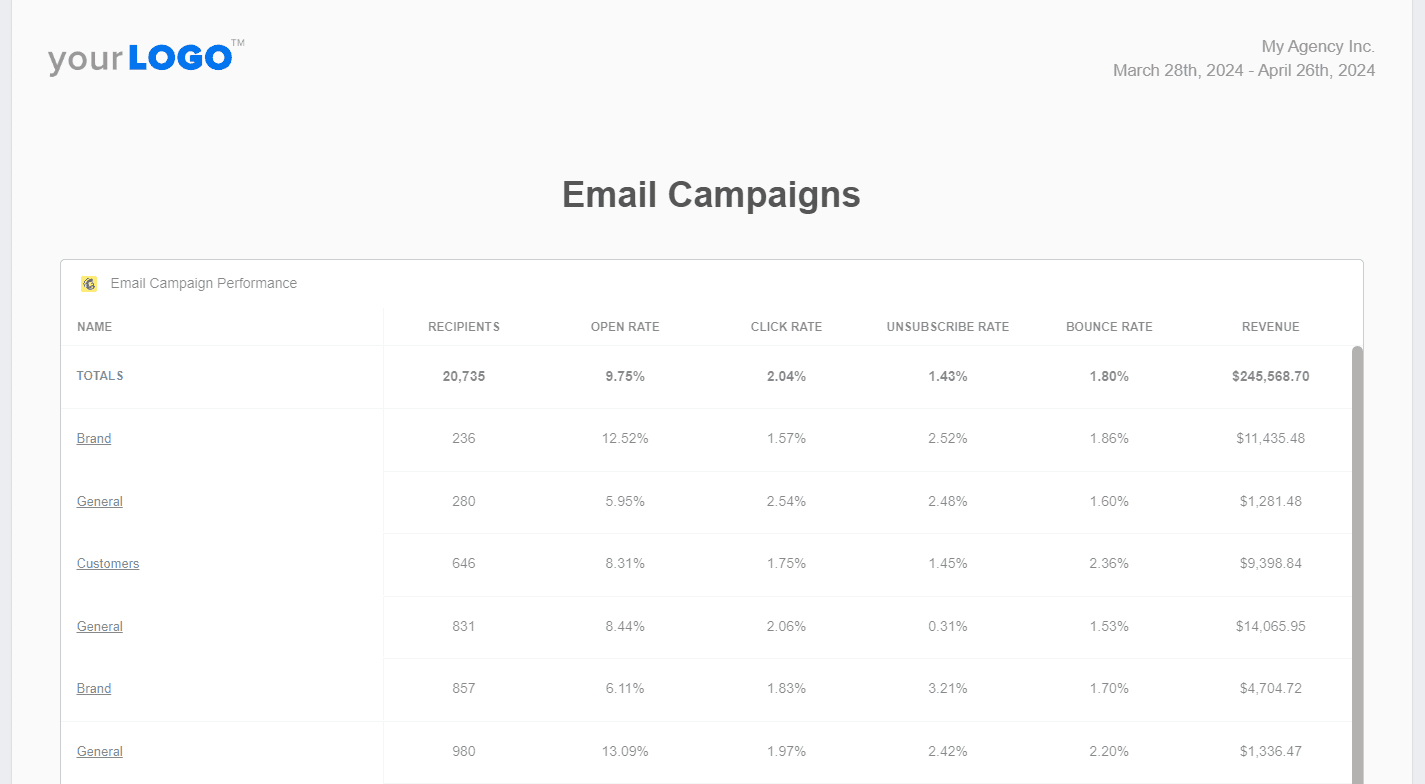
Communicate email campaign results in a visual, easy-to-understand format with AgencyAnalytics. Start your 14-day free trial today!
Going beyond raw data transforms your reporting into a strategic resource that helps clients understand what’s working, what needs improvement, and where future opportunities lie.
Here are some ways to turn Constant Contact analytics into actionable insights for your clients.
Set Clear Goals & KPIs: Define specific goals to measure campaign performance, aligning analytics with your client’s business objectives.
Identify Key Metrics: Focus on the metrics that align with the client’s goals, such as open rate, click rate, or conversion rate.
Analyze Trends: Look for patterns over time to understand audience behavior shifts, content performance, or seasonal changes.
Benchmark Against Competitors: Compare metrics to industry benchmarks to give clients context on their campaign’s relative performance.
Connect the Dots With Other Platforms: Integrate insights from other platforms to see how email engagement complements other channels.
Use Insights To Drive Strategy: Leverage the data to guide campaign adjustments, refine messaging, and improve overall effectiveness.
By transforming raw data into actionable insights, agencies provide a clear, data-driven roadmap for client success. This approach improves current campaigns and fosters long-term growth and strategy that aligns with clients’ business goals.
Read More: How to Break Through a Business Growth Plateau at Your Agency
How To Create Constant Contact Analytics Reports Using AgencyAnalytics
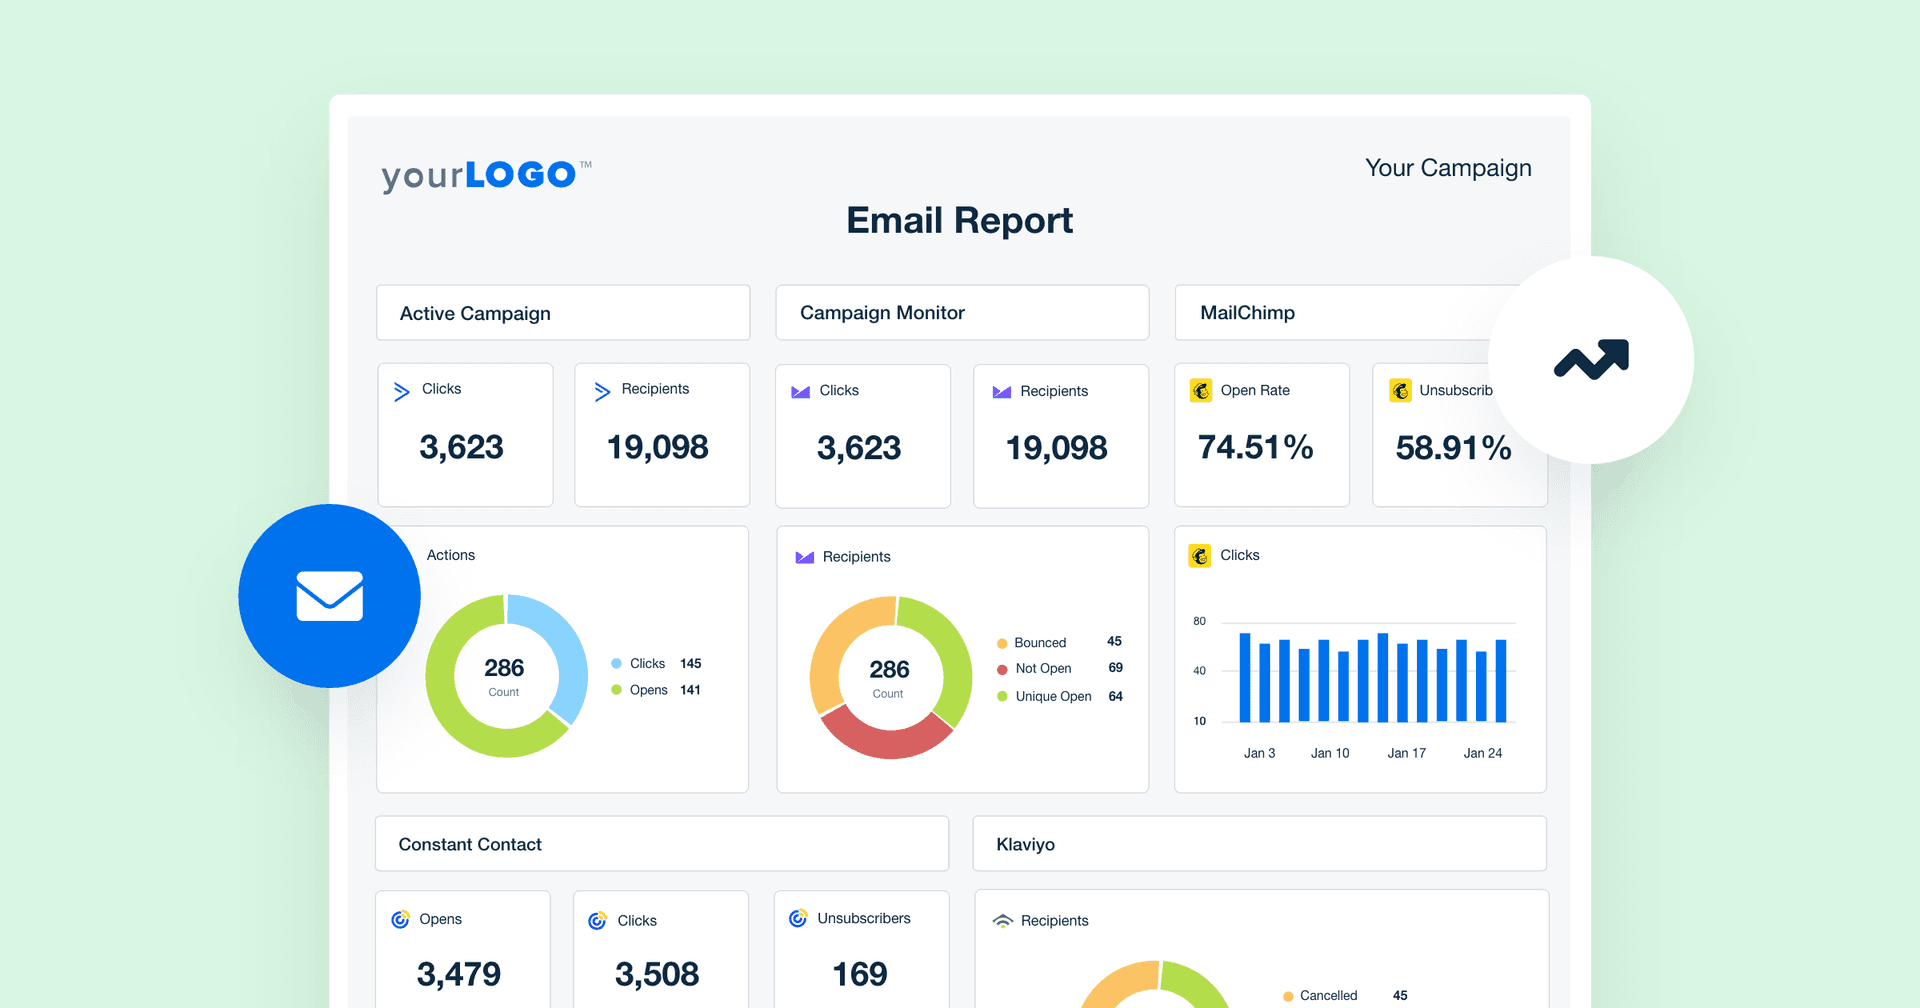
Agencies use AgencyAnalytics to simplify tracking Constant Contact metrics, making it easier to monitor campaign results in real-time. With AgencyAnalytics, they gather key data like open rates, click rates, and unsubscribes into clear dashboards, giving clients an easy way to see how their campaigns are doing.
Organizing these insights in one place helps agencies identify strategies to improve results across different client accounts. Marketers also link other platforms like Google Ads, Instagram, Hubspot, and Shopify to get a complete view of a client’s marketing data.
So where do you begin?
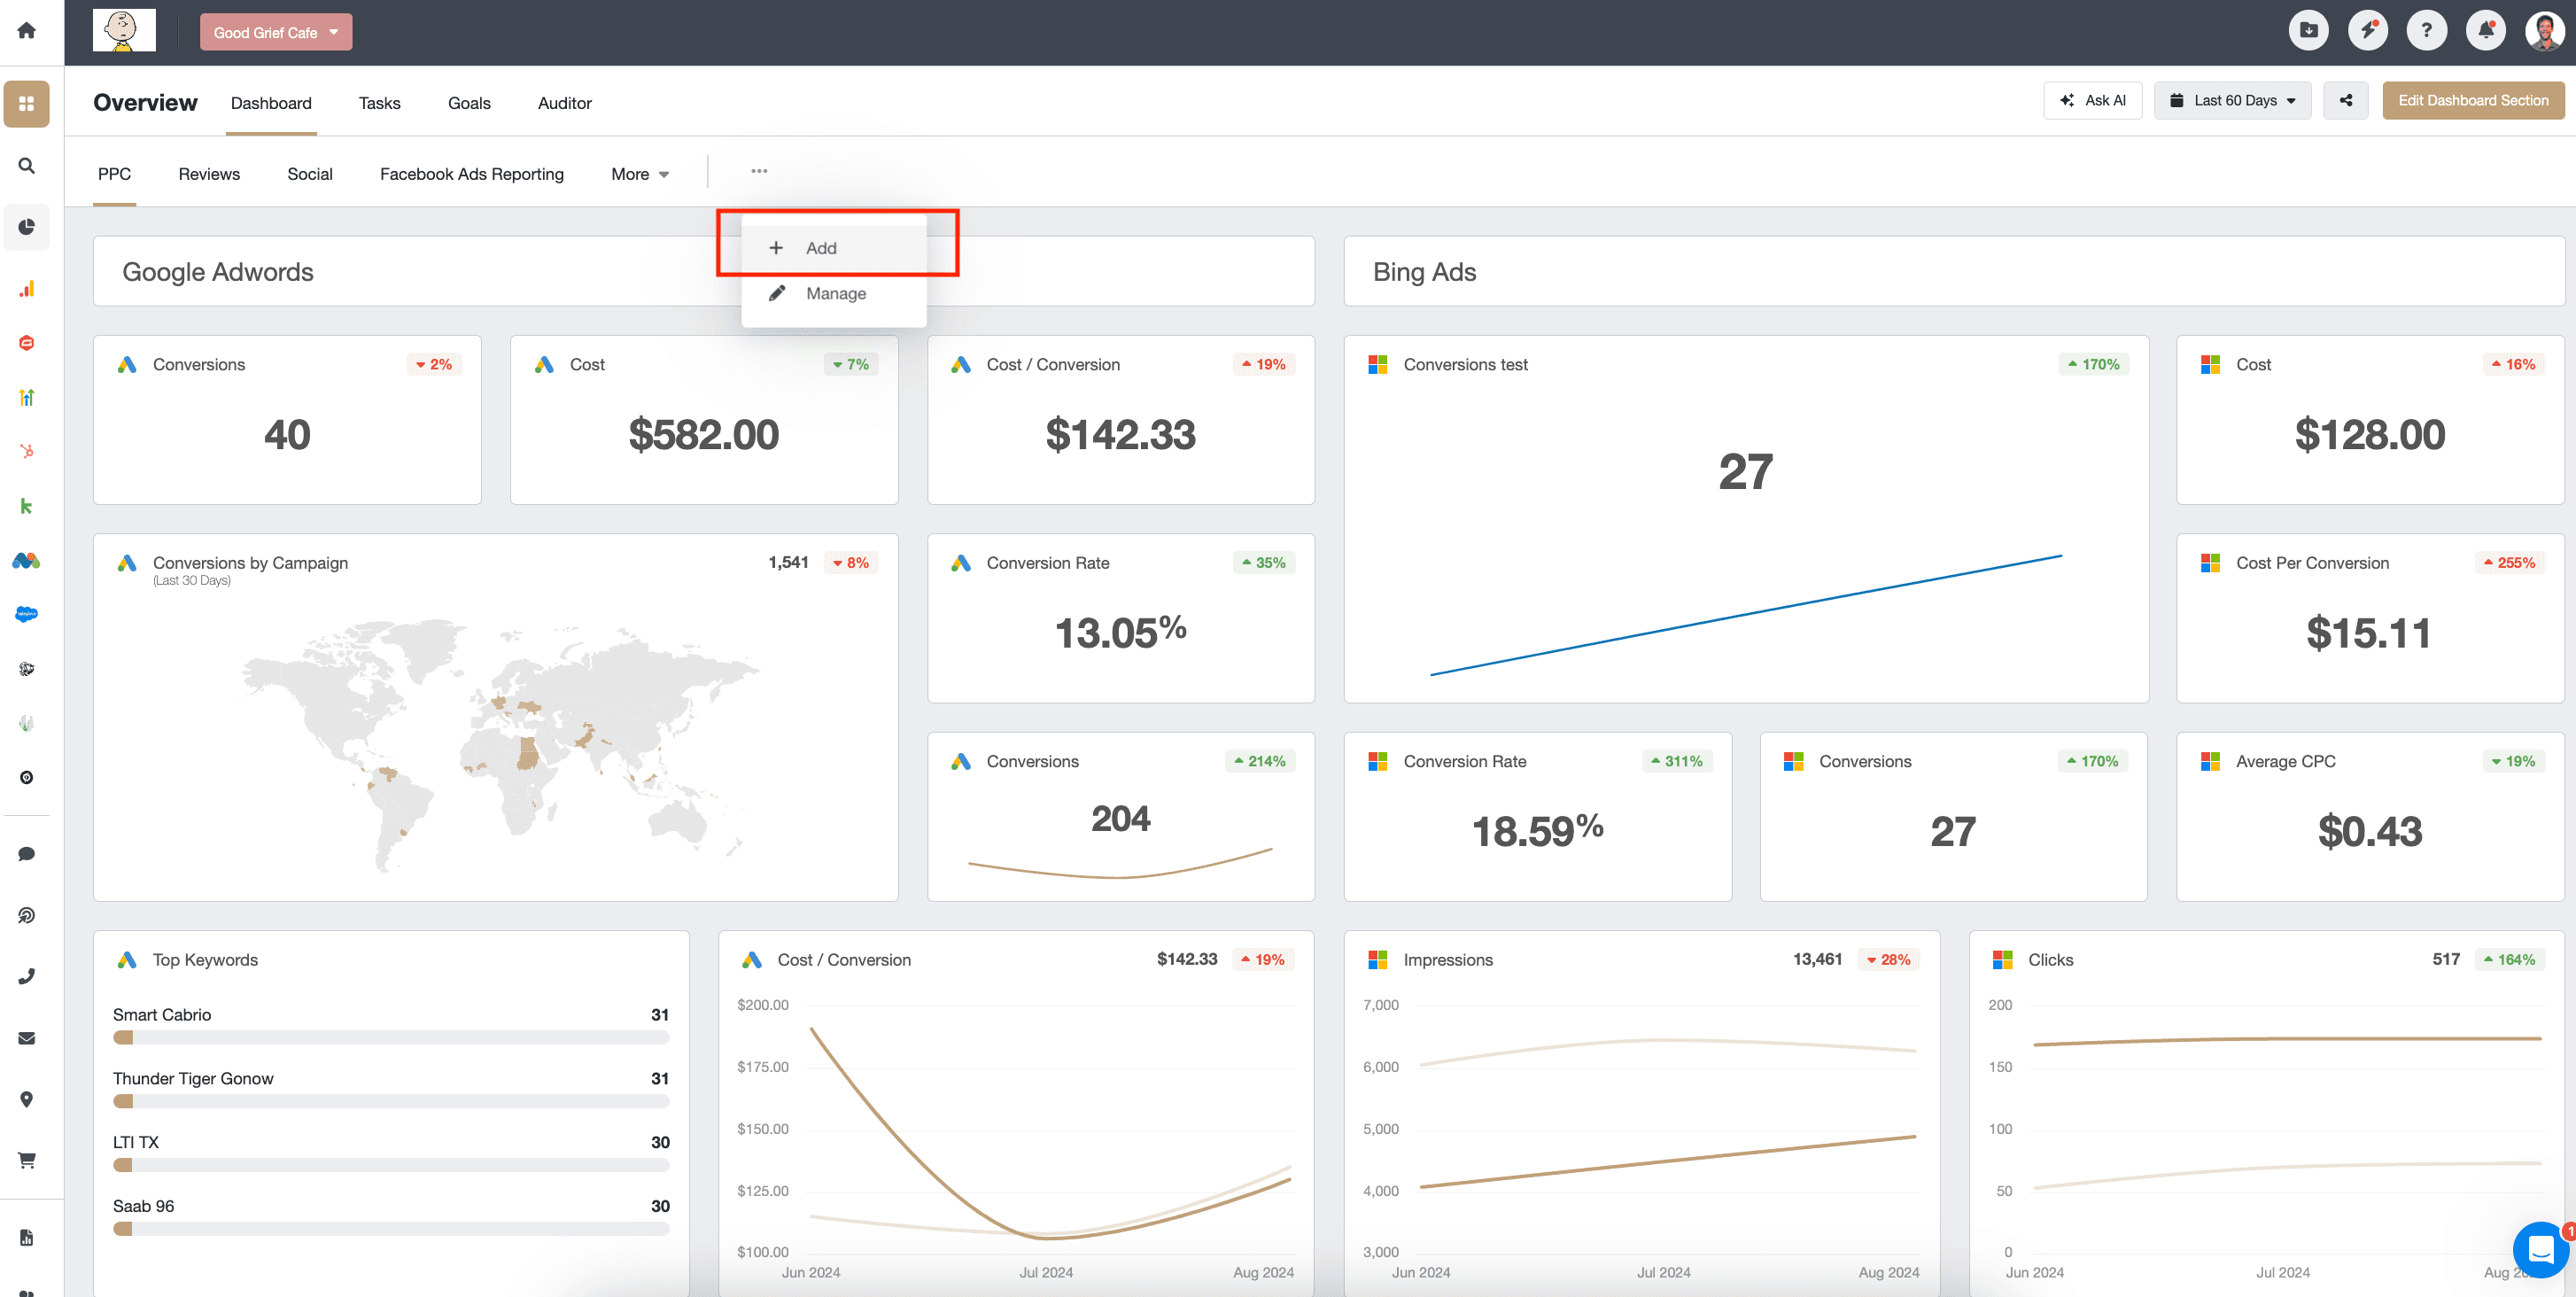
Start by logging into your AgencyAnalytics account and navigating to the client account for which you’d like to build a Constant Contact analytics dashboard. Then, select “add” in the drop-down menu to create a new dashboard.
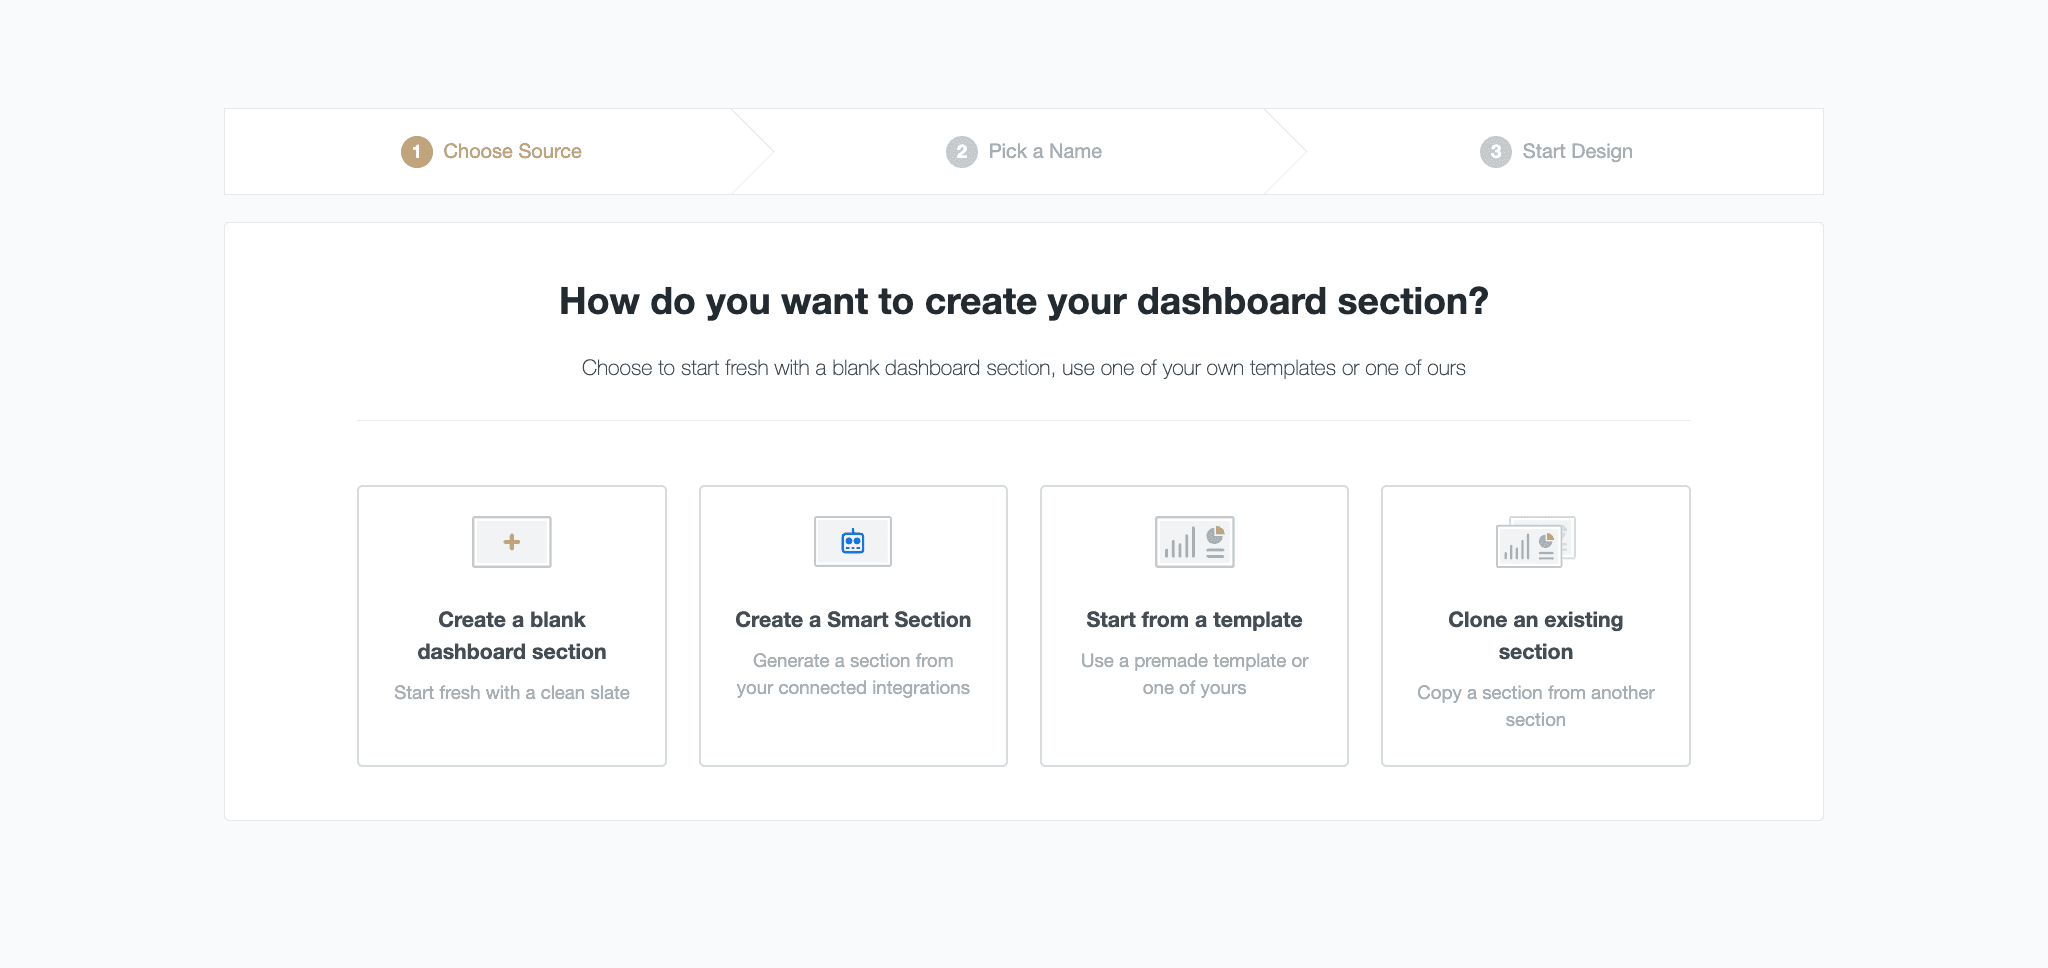
Next, you’ll be prompted to choose how you’d like to create the insights dashboard:
We’ve chosen to create a blank dashboard for this example. This allows you to drag and drop specific widgets you’d like from a variety of marketing platforms.
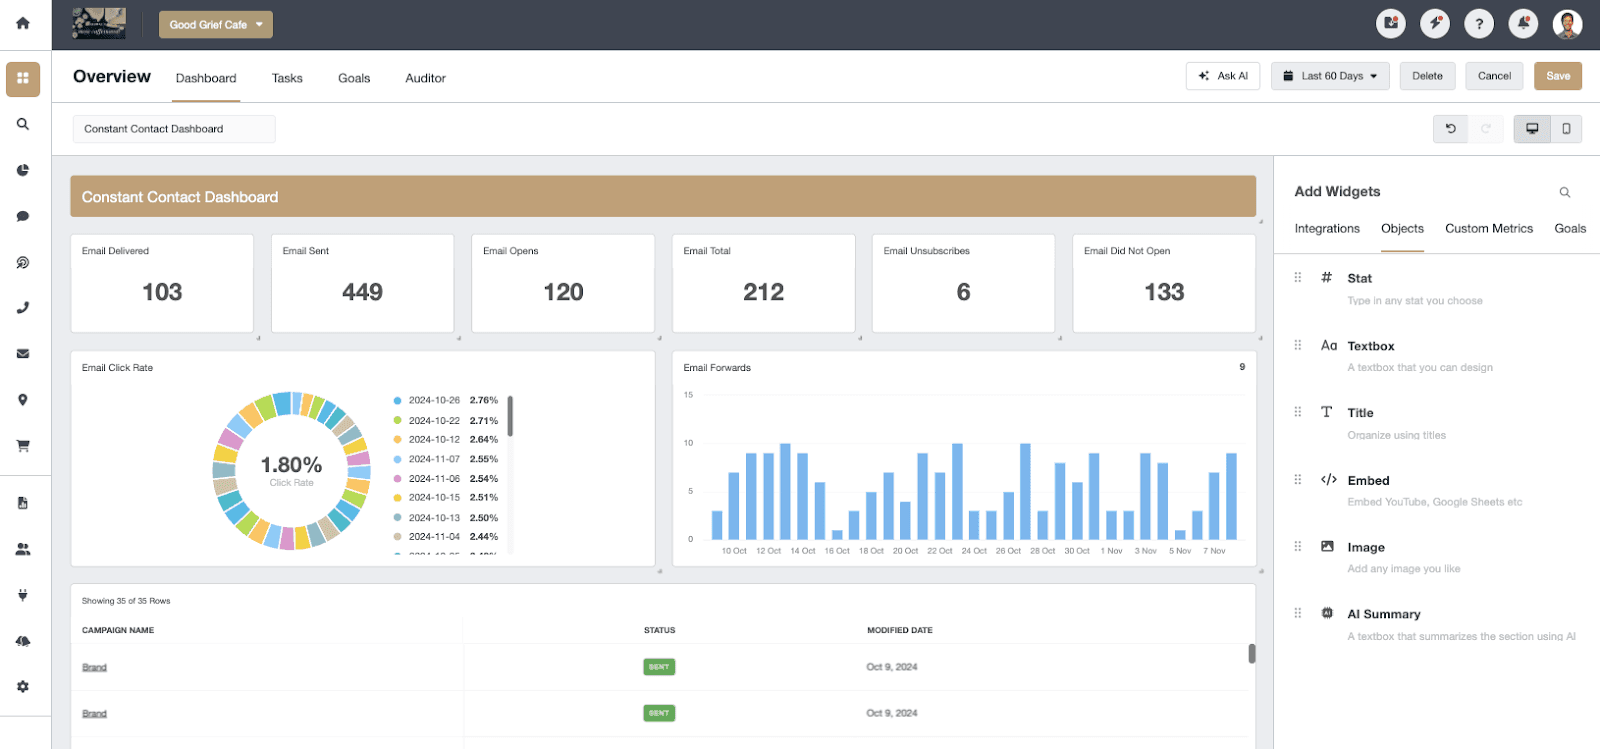
Under a time crunch? The Smart Reports and Smart Dashboards feature from AgencyAnalytics builds exactly what you need in 11 seconds or less. Try it out for yourself with a 14-day free trial.
With access to over 80 marketing channels, AgencyAnalytics gives agencies a complete picture of a client's marketing activity in one place. The platform’s user-friendly interface makes it easy to visualize data, identify trends, and make informed decisions, all while keeping clients in the loop with real-time insights.
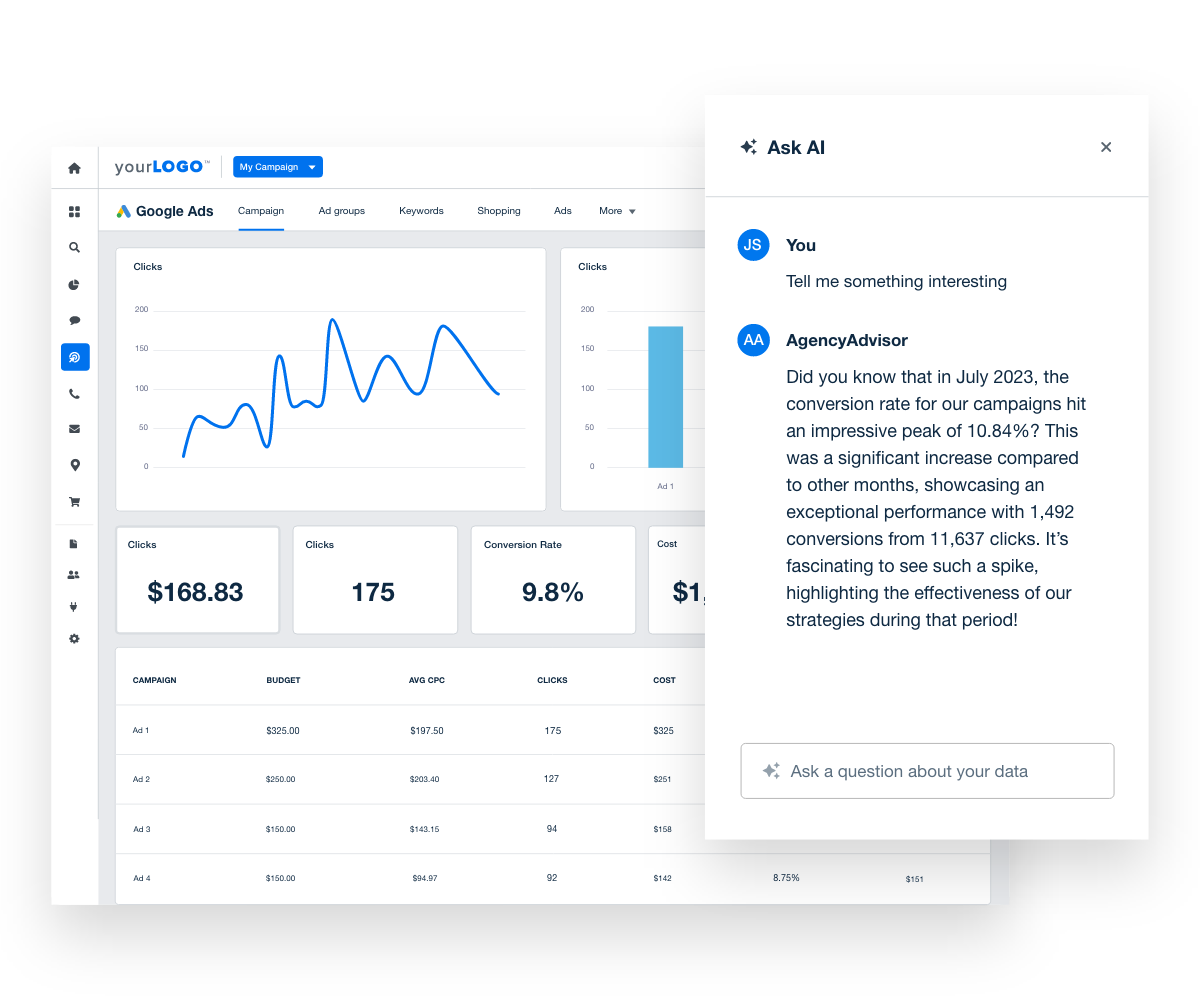
Highlight the most important aspects of your clients’ email performance in an easy-to-read report using Ask AI. This feature summarizes important findings and showcases your agency’s value front and center. Try it out with your 14-day free trial of AgencyAnalytics.
Summary and Key Takeaways
To make the most of Constant Contact analytics and create reports that truly benefit your clients, consider these action items:
Evaluate Your Current Constant Contact Analytics Approach: Assess how you currently track and report Constant Contact metrics to find areas for improvement.
Explore Third-Party Tools: Look into tools like AgencyAnalytics to streamline reporting and enhance your agency’s capabilities.
Customize Reports: Design your Constant Contact analytics reports to meet each client's specific needs, incorporating personalized insights and your agency’s white label branding.
Set Up Automated Reporting: Schedule automated email reports to ensure clients receive regular updates on their Constant Contact campaigns without extra effort.
Implement these steps to transform Constant Contact data into valuable insights and deliver professional, actionable reports that make a lasting impact.
Need help linking a client’s Campaign Monitor account? Check out our help article here.

Written by
Richelle Peace is a writer with a degree in Journalism who focuses on web content, blog posts, and social media. She enjoys learning about different topics and sharing that knowledge with others. When she isn’t writing, Richelle spends time teaching yoga, where she combines mindfulness, movement, and her passion for wellness.
Read more posts by Richelle PeaceSee how 7,000+ marketing agencies help clients win
Free 14-day trial. No credit card required.


