Table of Contents
QUICK SUMMARY:
LinkedIn Analytics measures a company page’s impact by tracking impressions, followers, clicks, shares, comments, and more, providing valuable LinkedIn data to inform your content strategies. It’s essential for understanding what content engages the audience. This data informs content strategies on LinkedIn and includes monitoring published posts, ads, and visitor interactions.
Generating a comprehensive LinkedIn analytics report helps you customize, track, and export the data needed to optimize your client’s LinkedIn strategy. Our LinkedIn analytics report template is a great tool to help you create reports quickly.
As a marketing agency, you understand the power of LinkedIn as the premier B2B social media platform. Crafting an effective LinkedIn marketing strategy is essential for your clients’ success, but tracking and measuring the right LinkedIn analytics is equally important.
Whether you’re promoting awareness of your client’s brand or boosting credibility among peers, tracking LinkedIn Analytics helps your agency identify which parts of your LinkedIn marketing campaigns are working and which aren’t.
Are you confident in your ability to track and analyze the metrics that matter most to your clients?
Are you using the best LinkedIn analytics tools to optimize campaigns and drive results?
How is your agency measuring its LinkedIn marketing efforts?
Do you know which metrics to monitor?
In this article, we’ll explore the critical LinkedIn analytics every marketing agency should track to maximize their clients’ online presence, generate leads, and establish their authority. We’ll cover both LinkedIn Page analytics (on your Company Page) and LinkedIn Ads analytics (inside Campaign Manager), since agencies usually need both sets of numbers.
We’ll also reveal the secrets to scaling your LinkedIn dashboard and reports, allowing you to efficiently manage multiple clients without compromising on quality.
Stay ahead of the competition and become an indispensable resource for your clients by harnessing the full potential of LinkedIn analytics tools.
What Is LinkedIn analytics?
LinkedIn Analytics is a selection of detailed metrics and analytics data that capture the performance of your LinkedIn company page. Like other social media platforms, LinkedIn analytics measure total engagement metrics, such as followers, clicks, shares, and comments.
KPIs allow us, as the agency, to demonstrate our value to the client. There are basic KPIs, such as spend, clicks, impressions, and ranking, but the real KPIs every client wants to know are leads and/or sales. Ultimately, what is their ROI from our efforts?
Jacob Hicks, Owner, Magnyfi
The content you publish on the platform, the ads that you run, and the people who visit your company page are all captured by these metrics. Tracking LinkedIn analytics is crucial when determining what content resonates with your target audience, which helps inform your client’s LinkedIn content strategy and drive business growth.
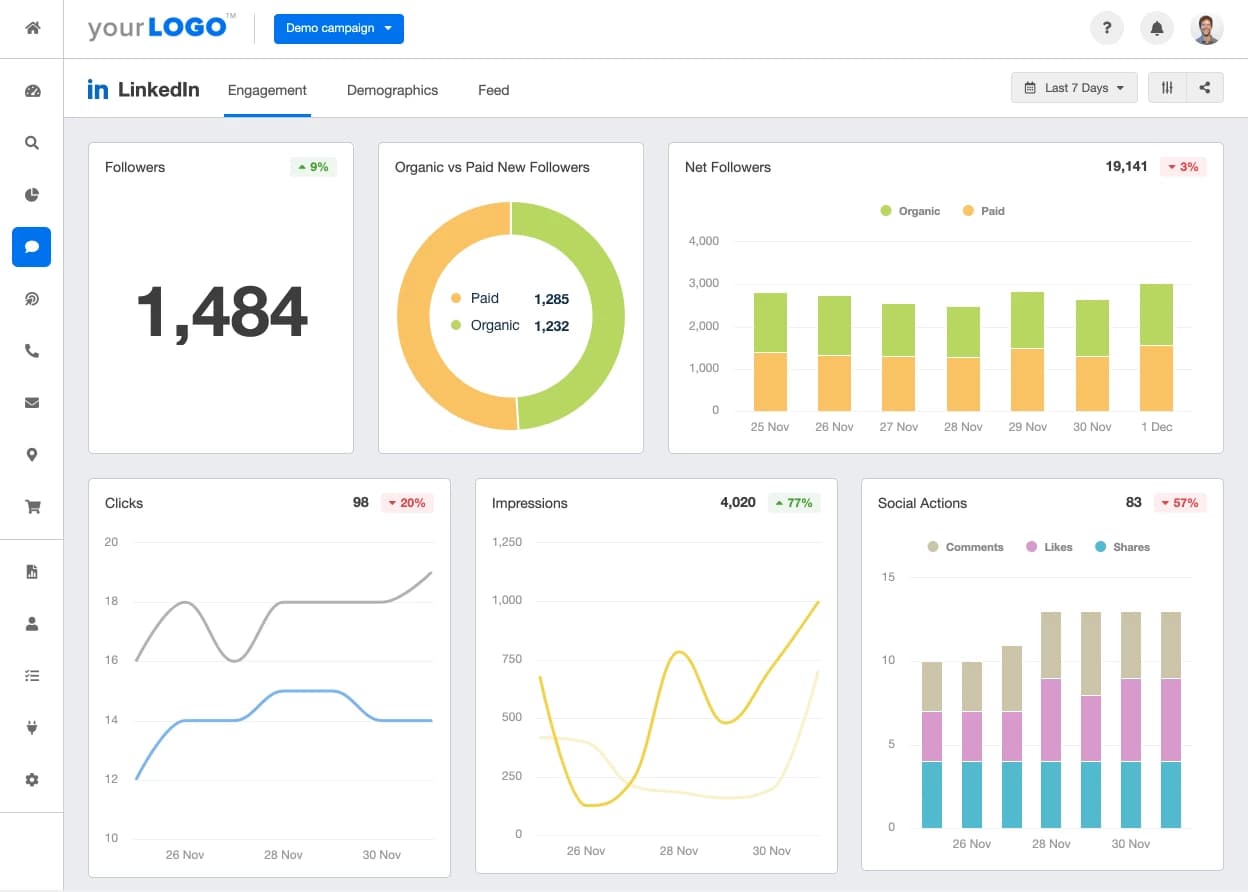
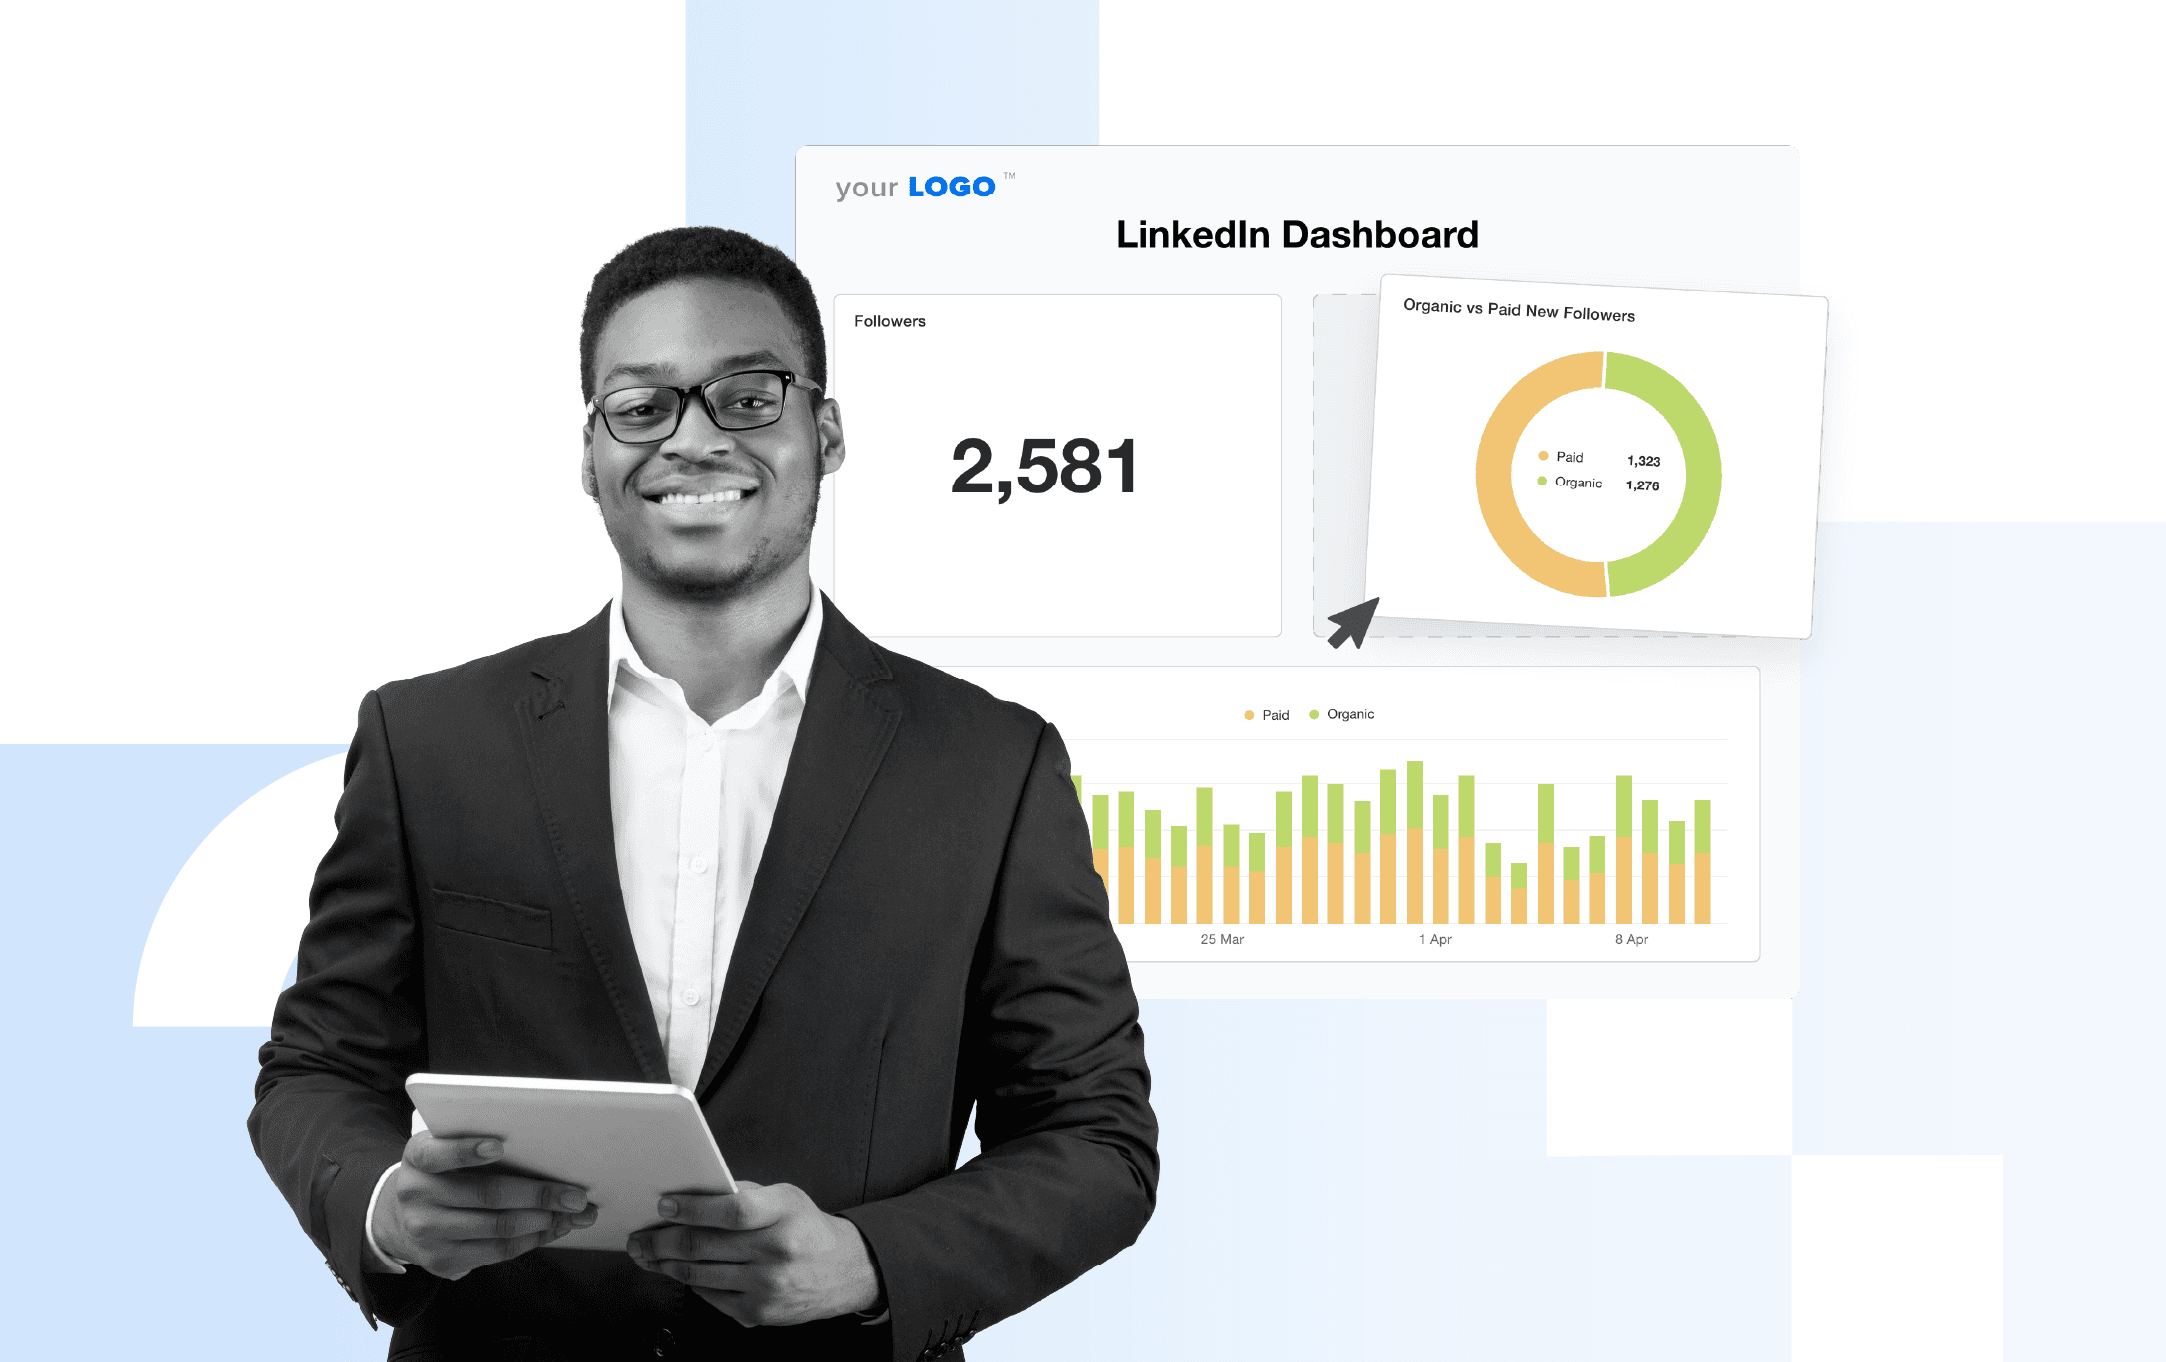
Use this LinkedIn Dashboard template to track all your clients’ LinkedIn metrics in one place and flip it into a client-ready report in seconds! Try AgencyAnalytics free for 14 days.
Where to find your LinkedIn analytics?
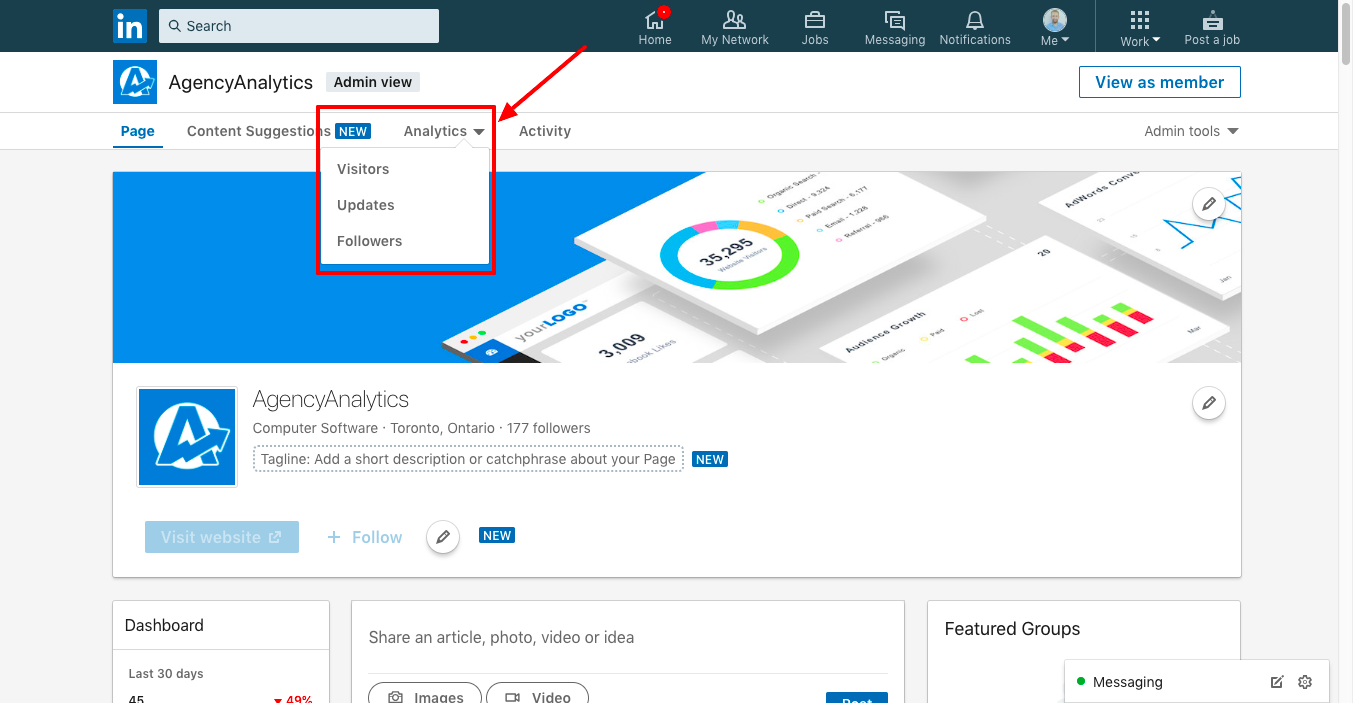
To access LinkedIn’s free Company Page analytics, make sure your (or your client’s) Company Page has been set up and that you’re an admin on the page.
Log into LinkedIn, navigate to the Company Page, and when you’re viewing it as an admin you’ll see an “Analytics” tab in the page’s top navigation. Click this tab (and its dropdown options like Visitors, Content, or Followers) to access your LinkedIn Company Page analytics.
Why LinkedIn analytics matter in 2025
In 2025, LinkedIn is one of the main places your clients’ buyers, partners, and future hires are hanging out. It’s a crowded space. LinkedIn analytics help you cut through the noise, so you can prove what’s working. That also means going beyond vanity metrics and digging into LinkedIn post analytics that show what actually moves the needle.
With analytics, you can quickly see:
Who your client is reaching (roles, industries, locations) and whether that matches their ideal LinkedIn audience
Which posts pull their weight so you can double down on the formats and topics that drive engagement data
How your client’s LinkedIn page grows over time, making it easier to connect LinkedIn efforts to leads, pipeline, or hiring goals
What to optimize next, from posting cadence to content mix, based on data, not gut feel
For agencies, this is how you move LinkedIn from “we’re posting consistently” to “we’re running a channel with clear results we can show clients.”
Which metrics does LinkedIn analytics measure?
LinkedIn Analytics is divided into three main categories to help measure social media performance:
Updates
Followers
Visitors
Each section reports on a different aspect of your LinkedIn company page.
Updates
In this section, you’re given metrics to track that help you determine if your company updates (posts) are generating customer engagement. These metrics to track include:
Update Title - The title of the update you posted.
Posted by - Who on your team posted the update.
Created - The date the update was published.
Impressions - The number of times an update was shown to a LinkedIn user.
Video views - When 3 seconds or more of a video were viewed, or the call-to-action (CTA) was clicked.
Clicks - The number of times your update or company branding was clicked.
CTR (Click-through rate) - Clicks divided by impressions.
Likes - Number of likes on your update.
Comments - Number of comments on your update.
Shares - Number of update shares.
Follows - Number of people who click ‘follow’ on your sponsored updates.
Engagement rate - (Clicks + Likes + Comments + Shares + Follows) / Total Impressions
Examples of company updates would include how-to articles, company achievements, advice, and other content that provides value to your target audience.
Make sure you have a well-defined LinkedIn strategy before posting updates. There should be a purpose and direction.
LinkedIn followers
In this section, you’re given follower metrics about who is following your Company Page. The key LinkedIn metrics to track for LinkedIn company pages include:
Total followers - Total followers of your company page.
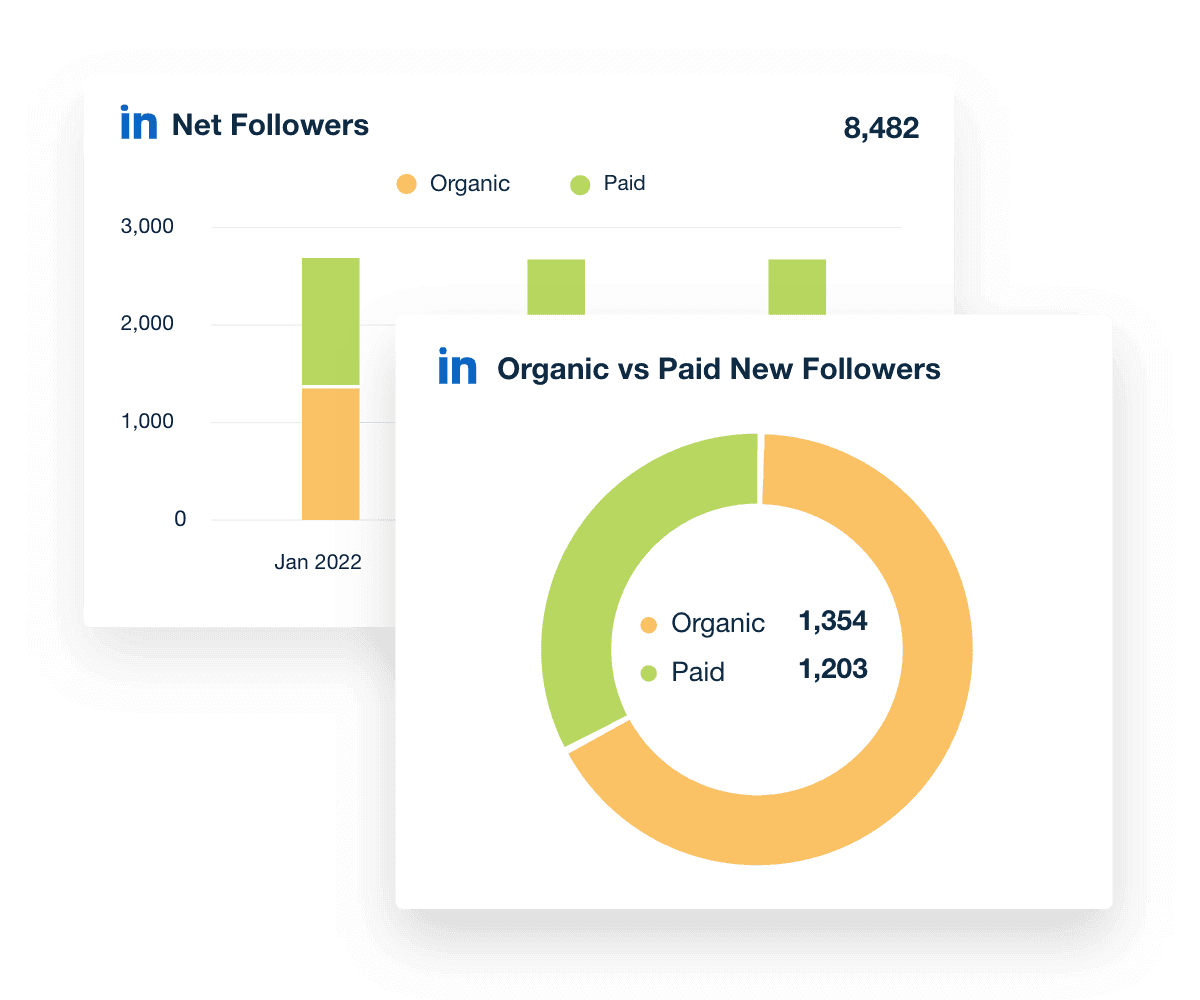
Organic followers - Followers acquired without ad spend.
Sponsored followers - Followers acquired through paid ads.
Follower demographics - Demographics of your company page followers broken down by location, job function, industry, and company size
Follower trends - A line chart that shows when followers were added over time.
Visitors
In this section, you’re given visitor metrics about people who have landed on your Company Page. These metrics to track include:
LinkedIn page views - Total number of views of your company page, including your career page.
Unique visitors - Unique LinkedIn page visitors. Excluding multiple visits from the same user.
Visitor metrics - This is a line chart that allows you to see the number of company page views over time.
Visitor demographics - Similar to follower demographics, this section gives the demographics of your LinkedIn page visitors.
Remember, visitor analytics give you data on who has visited your client's company page, but not metrics on content performance. Fill out every section of your company page in order to optimize the visitor experience. You don’t want a prospective customer to leave with more questions than they arrived with.
Phew! That’s a lot of LinkedIn metrics to track! With all these available metrics, it’s easy to get lost in a sea of digital marketing analytics available from LinkedIn. Which brings us to the next question: Which of these LinkedIn metrics should you actually report on?
Impress clients and save hours with custom, automated reporting.
Join 7,000+ agencies that create reports in under 30 minutes per client using AgencyAnalytics. Get started for free. No credit card required.
Already have an account?
Log inTop 10 LinkedIn analytics metrics to track
Let's now hone it down to the most important LinkedIn metrics for monitoring the health of your LinkedIn marketing efforts. Although each data point helps add context to the overall performance, like with all social media platforms, there is usually a set of social KPIs that are more important than others.
1. Post impressions
Content marketing is all about attracting potential customers by offering value upfront. Impressions are the total number of times your LinkedIn post has been seen. This includes LinkedIn users who see it more than once.
For example: If a user sees your update three times, it counts as three impressions. But it will only count as one unique impression.
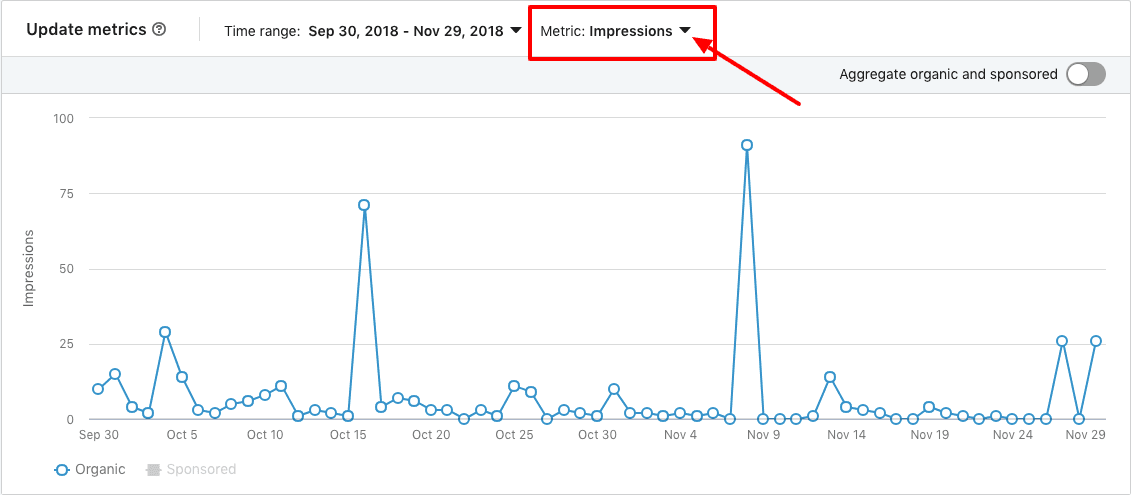
When viewing impressions data through the update metrics chart, you can gain additional insights, such as:
Determining the best time to post: You’ll be able to identify the days when your LinkedIn posts are seen most often, and then, refine your posting schedule to ensure that your customers are receiving your content when they are most likely to view it.
What posts to sponsor: By comparing organic and sponsored posts, you can quickly determine which organic posts are resonating with your existing followers. Making it easy to determine which posts and topics you should sponsor to broaden your follower base.
Long-term trends: Viewing your impressions over time will help you visualize the trajectory of your marketing campaigns. If you are seeing a downward trend in impressions, this could mean your content is not compelling and LinkedIn is serving it to fewer followers.
Use industry benchmarks to see how your LinkedIn analytics compare to competitors over time.
For example, based on industry benchmarks derived from over 150,000 digital marketing campaigns run by the 7,000+ marketing agencies that use AgencyAnalytics as their reporting partner, the average LinkedIn post receives just over 500 impressions.
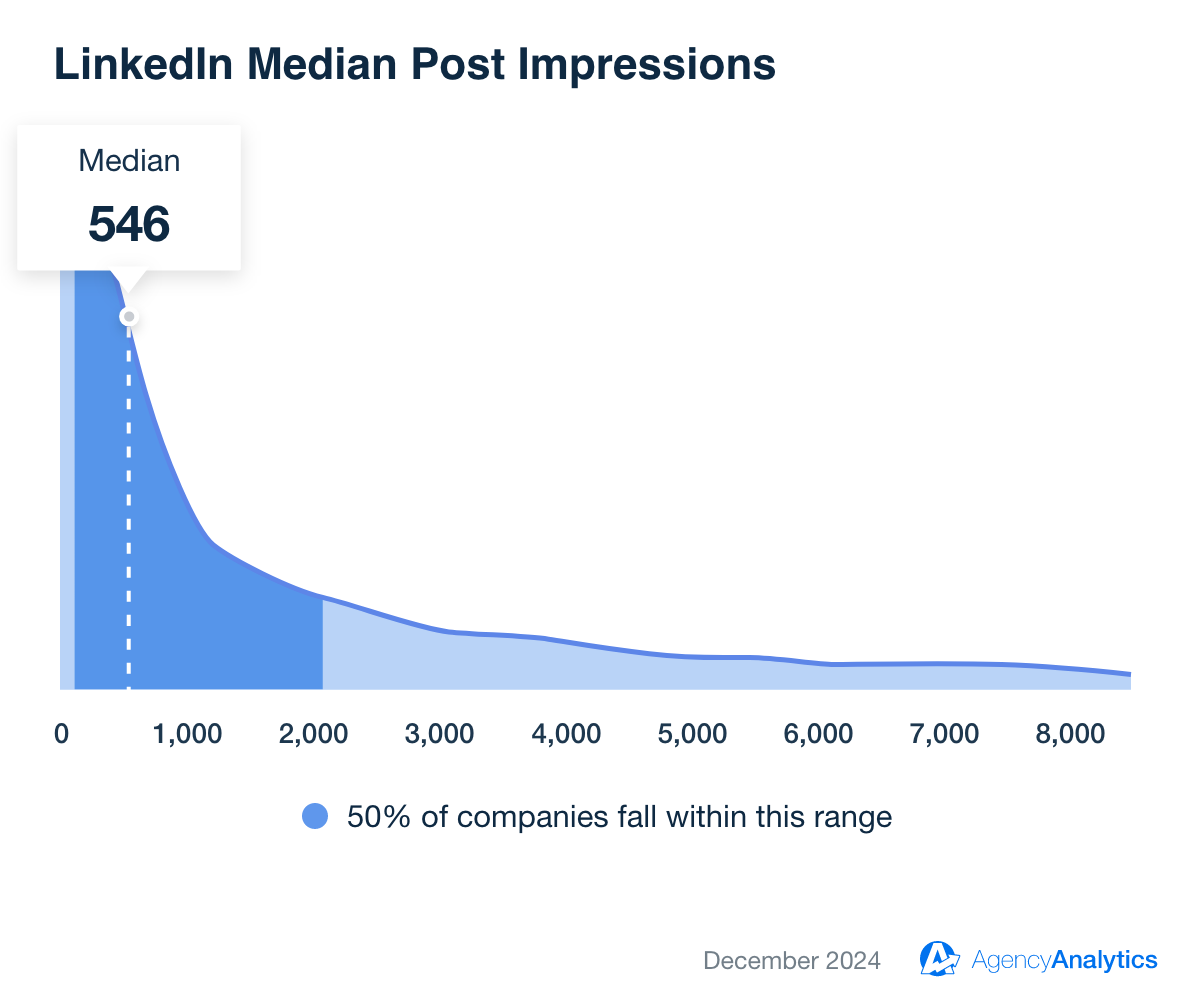
Having a high number of impressions doesn’t necessarily mean you’ve got a winning post, but it is a great indicator. You still need to use LinkedIn analytics tools to look at the following two metrics as well to understand how well your posts are resonating with your target audience.
2. Clicks
Clicks measure how many times someone actively engaged with your LinkedIn post or ad—whether that’s clicking on a link, your company name, or an image.
Tracking clicks gives you a baseline understanding of how well your content captures attention and drives action. If impressions are high but clicks are low, it signals your creative or offer may not be resonating with your target audience. On the other hand, steady growth in clicks—especially when paired with consistent engagement rates—indicates your content marketing strategy is connecting with the right people.
💡 Agency Pro Tip: Analyze clicks in the context of your campaign goals. For brand awareness, any increase in clicks suggests your message is sparking curiosity. For lead generation, focus on link clicks that move visitors deeper into your funnel—toward demo requests, downloads, or website visitors from LinkedIn ads.
3. CTR (Click-through rate)
How’s your performance?
All too often, clients obsess over how many clicks their content, and LinkedIn ads are receiving. But as many seasoned marketers know, it’s the click-through rate that gives you real insights regarding how relevant & engaging your posts are.
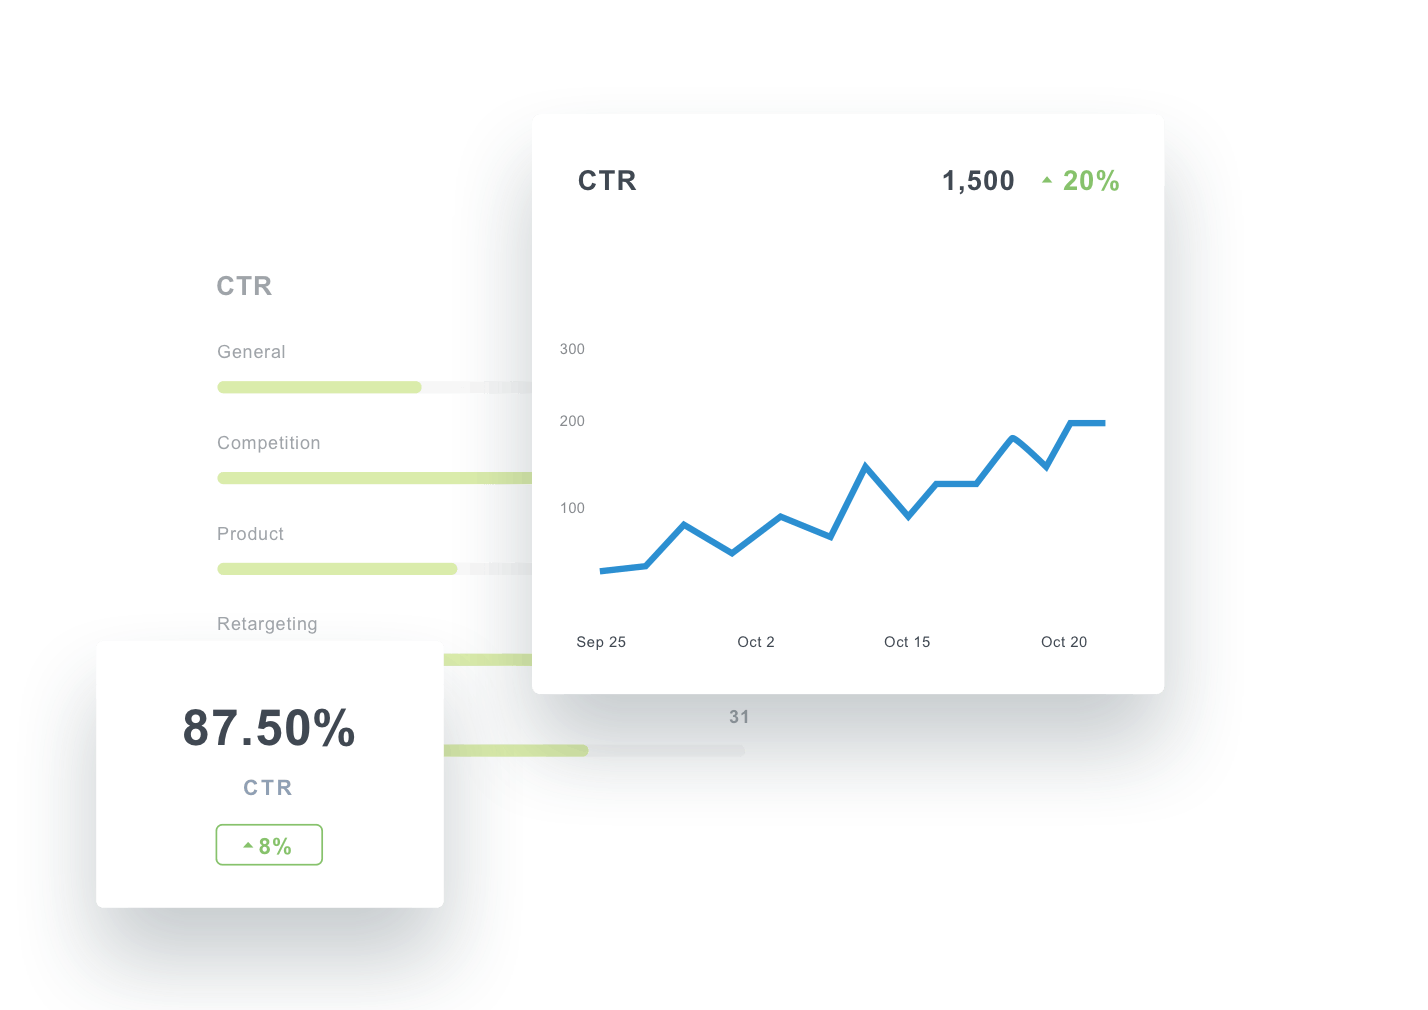
As mentioned before, CTR within LinkedIn analytics is the total number of clicks your post receives divided by the total number of impressions. It measures the percentage of people who see your post and click through to learn more.
Why is this metric important? Because a high CTR means a high percentage of people who saw your post are clicking your content and going to your site. This indicates that your LinkedIn ads–both imagery and copy–are effective and that your audience is willing to take action. The same applies to organic posts.
Monitoring your click-through rate will make you aware of underperforming content and signal you to act.
4. Engagement rate
Are people interested in what you have to say?
You need to do more than just reach an audience - you need to know that you're reaching the right audience and reach as many of them as possible. Look at your follower demographics to understand who your content reaches.
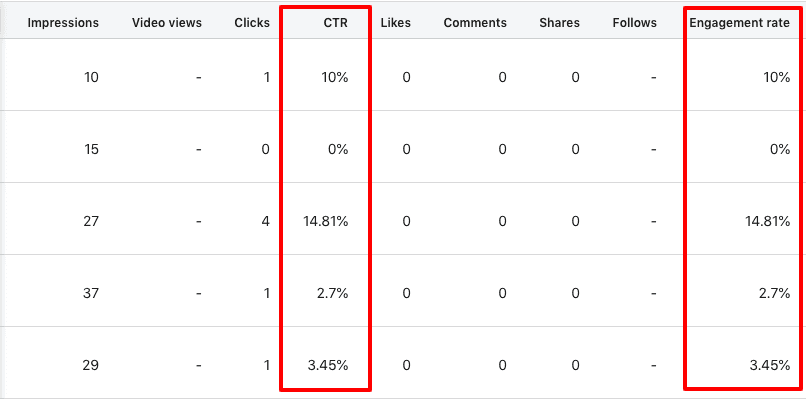
Key LinkedIn engagement analytics to measure
Click-through rate (CTR): A high CTR suggests that your content is relevant and appealing to your target audience, driving them to take action. By monitoring CTR, you are better equipped to identify the best-performing content types, headlines, and image creatives, enabling you to optimize campaigns for maximum impact.
Engagement rate: High engagement rates often lead to increased visibility on LinkedIn, as engaged users are more likely to share your content with their network, attracting new followers and potential clients.
Social actions (comments, likes, and shares): Positive social actions (e.g., likes, comments, and shares) help establish your clients as thought leaders and build their credibility within their industry. Comments and shares can lead to valuable user-generated content, fostering discussions around your clients' brand and topics of interest, further increasing engagement and brand awareness.
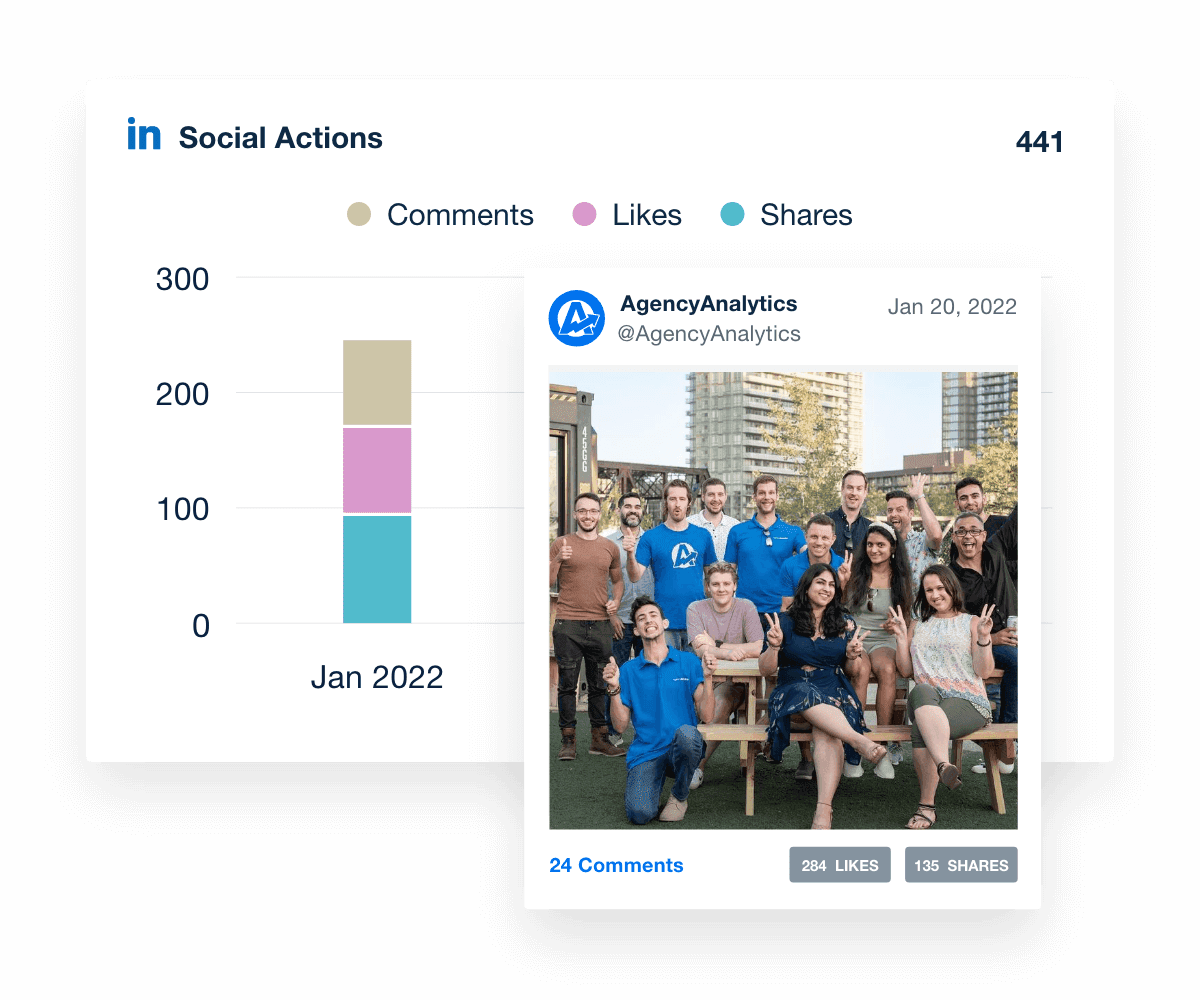
These data points, when visualized correctly on a LinkedIn analytics dashboard, will help you determine what resonates with your followers and allow you to create more of what your audience loves.
💡 Agency Pro Tip: Don’t forget to experiment with images and video. Images receive 200% more engagement than a standard text post.
5. Follower demographics
Who is liking what you’re saying? Use LinkedIn analytics tools to find out!
This section lets you connect the dots between the audience your agency is reaching on LinkedIn and your client's target market. Look at your follower demographics to understand who your content reaches. Does it align with the ideal target for your client?
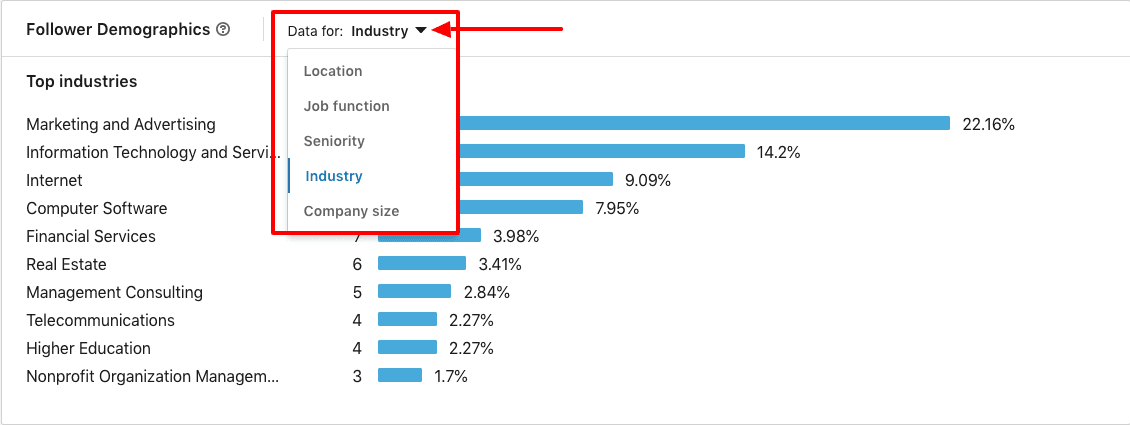
What role does your client play within an organization? Are they decision-makers? You can use a LinkedIn analytics tool to see if your audience comes from small businesses or large corporations, what job function they have within their company, and even their location.
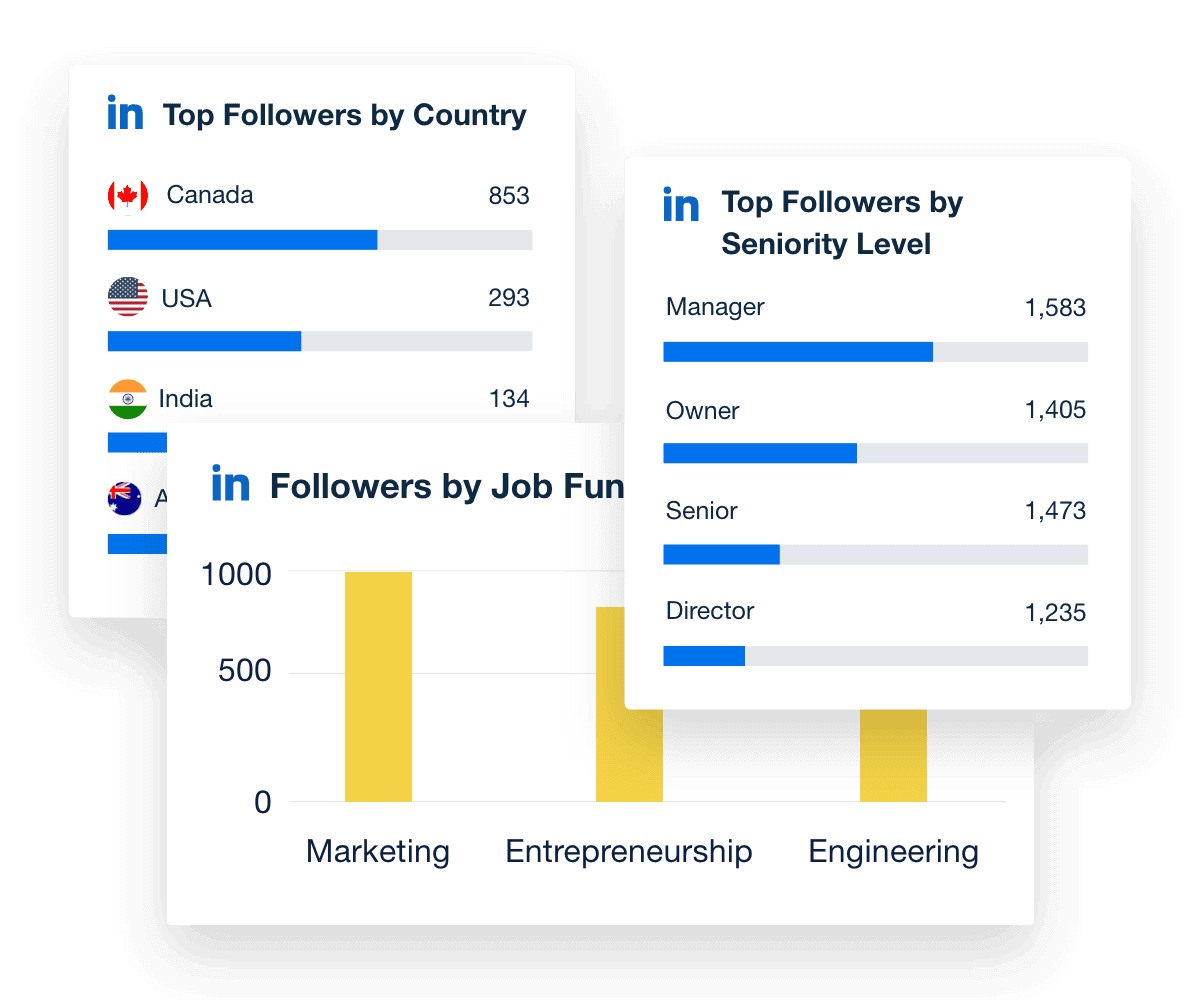
Do you want to target specific verticals? If so, you can target the industry in which most of your viewers work. When combined with CTR and engagement rate, demographic data helps determine who loves your content and craft your updates just for them.
6. Followers: Total and organic
Not surprisingly, the probability of your target audience seeing your posts in their feed increases if they follow your LinkedIn page.
This is why follower analytics are so crucial. It’s important to know and actively try to increase your client's total followers.

Having a high total number of followers also implies strong brand credibility in the eyes of future customers. In the follower metrics chart within the native LinkedIn analytics tool, you can see both your total followers and the trend in gaining followers.
This creates a visual representation of the followers metric under updates, which shows you which posts generated new page followers. Knowing which posts generated the most followers creates a feedback loop, allowing you to optimize content quality and improve the effectiveness of your content marketing.
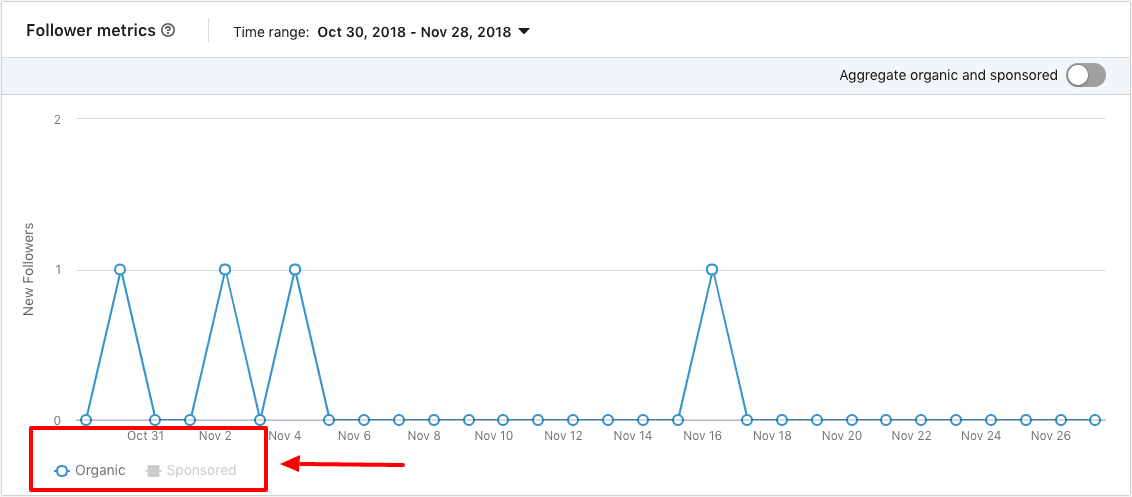
You can also gauge the effectiveness of your sponsored posts by seeing how many new followers they generated compared to your organic posts.
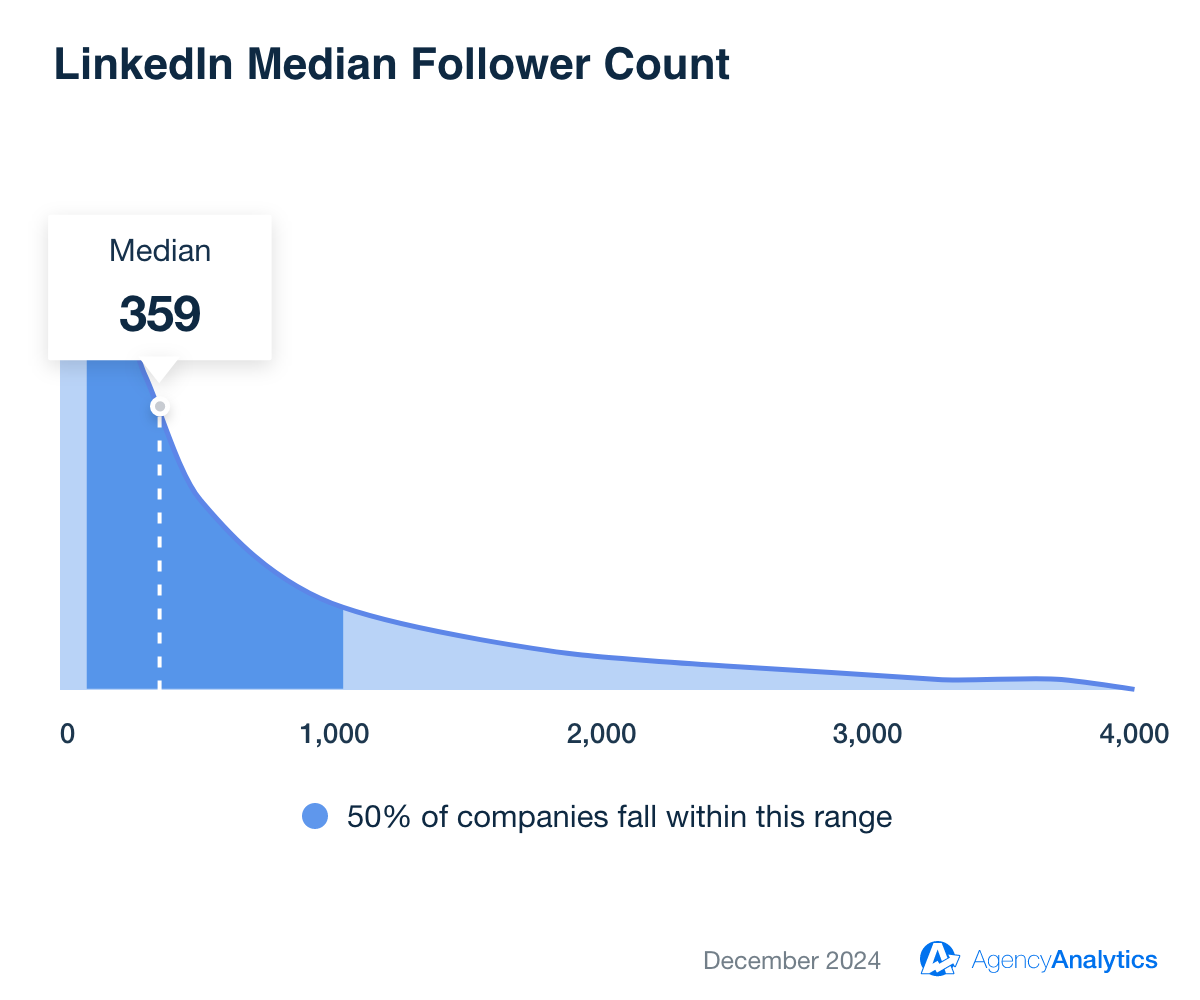
And you don't need a lot of followers to create a successful LinkedIn profile. For example, industry benchmarks show that the average SMB LinkedIn account has just over 300 followers.
7. Profile views (visitors or page views)
Profile views serve as an indicator of a client’s brand visibility and reach on the platform. When LinkedIn users visit a profile, it often means that your content, messaging, or branding has piqued their interest, driving them to learn more about the company (or personal brand).
Visitor metrics provide valuable insights into the traffic directed to your clients’ LinkedIn Pages and can be customized to display data based on specific time ranges, Page sections, total Page views, and unique visitor counts (excluding duplicates). Marketing agencies can analyze these metrics both in aggregate and non-aggregate forms, allowing for a comprehensive understanding of their clients’ LinkedIn performance.
Increased page views on the client’s profile page signal that your marketing efforts, such as posting high-quality content or engaging in relevant discussions, are effectively attracting attention and driving traffic to the profile page.
By monitoring profile page visits, you to assess the impact of any optimization efforts, such as updating the profile banner, headline, or summary. By tracking changes in profile views over time, you can identify trends and gauge the success of your agency’s profile optimization strategies.
It’s easy to use the native LinkedIn analytics tool to drill down into the profile page type, including the LinkedIn homepage, about page, insights page, and people page, or combine the data across all pages.
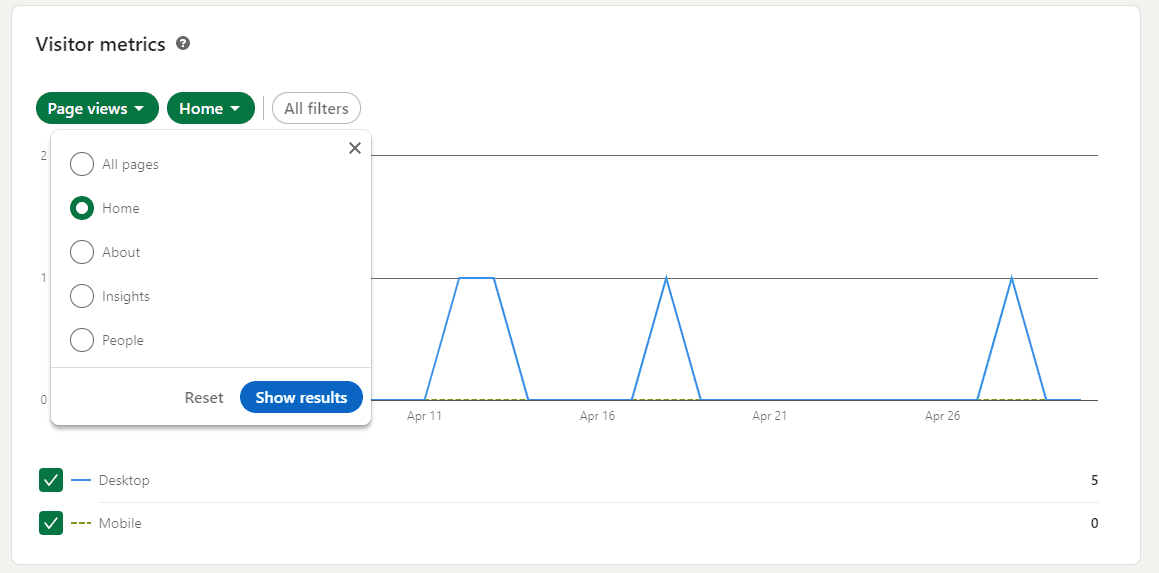
That being said, it’s equally important to exercise caution when relying on profile views as a key performance indicator, as it can easily become a vanity metric with limited actionable insights. While a high number of profile views may seem impressive, understand that this metric alone doesn’t necessarily translate to tangible business outcomes (such as lead generation or conversions).
To ensure that you’re deriving valuable audience insights from your LinkedIn analytics, consider profile views in conjunction with other metrics, such as engagement rate, click-through rate, and audience growth. By analyzing a comprehensive set of metrics, you are better equipped to make informed, data-driven decisions to optimize your clients’ LinkedIn campaigns and drive meaningful results.
Note: Profile Views are limited for users with a free account. To see the full range of data available, you need to upgrade to a premium account.
Top LinkedIn advertising analytics to track
Understanding LinkedIn ads metrics empowers agencies to make data-driven decisions, optimize ad campaigns, and ultimately deliver better results for their clients.
For this reason, it’s time to delve into the top LinkedIn advertising analytics to track. Using a LinkedIn analytics tool to keep a finger on the pulse of client LinkedIn ad campaigns helps an agency deliver successful LinkedIn ad strategies, drive success, and foster long-lasting client relationships. For more in-depth insights, check out this LinkedIn Ads guide.
8. Sponsored content performance
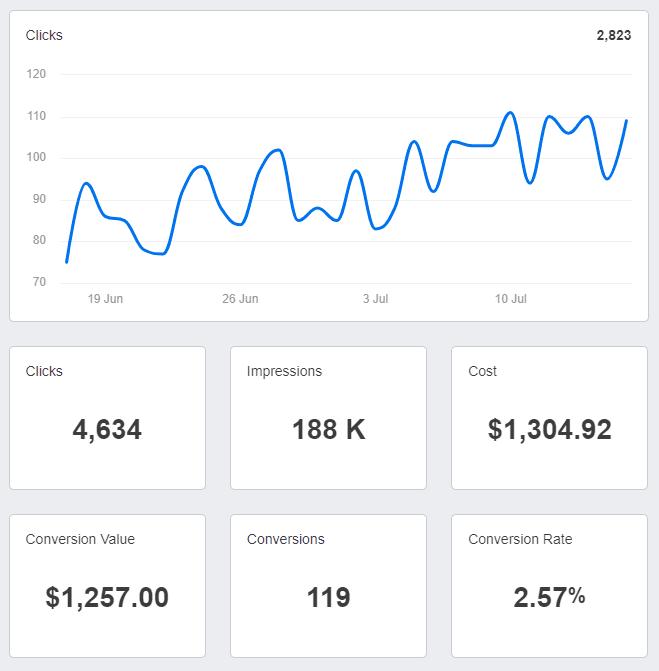
Sponsored content plays a critical role in promoting your clients' businesses on LinkedIn. To ensure your clients get the most out of a client’s LinkedIn advertising efforts, consider tracking the following metrics:
Impressions: This metric helps gauge the reach and visibility of your clients' campaigns.
Clicks: Gain insights into the effectiveness of your content and messaging in driving LinkedIn users to content on the client’s website.
Click-through rate: Calculates the clicks divided by impressions to make sure that the ad content, imagery, and targeting are on point.
Cost: Manage budgets effectively and assess the cost-efficiency of campaigns.
Cost per click (CPC): Evaluate the cost-effectiveness of campaigns and identify opportunities for optimization.
9. Lead generation form analytics
LinkedIn’s lead generation forms are a powerful tool for capturing high-quality leads on LinkedIn.
We love hearing feedback from clients that they are getting leads, getting results, and then showing them why with the data.
Valerie Jennings, CEO, Jennings Social Media & MarTech
To make the most of this feature, track the following metrics:
Leads: Measure the total number of leads generated and evaluate the success of your lead generation efforts on LinkedIn.
Cost per lead (CPL): Calculate the average cost for each lead acquired through LinkedIn to compare to other channels and campaigns. But remember to compare the lead quality as well. For example, if a Facebook lead closes at 2% but a LinkedIn lead closes at 8%, your LinkedIn CPL target should be around 4x that of your Facebook CPL target.
10. Conversion tracking and ROI
Monitor the total number of desired actions (e.g., purchases, sign-ups, downloads) completed by users after engaging with your clients' LinkedIn ads.
Ultimately, we know our clients hire us to help them close more deals, so the most important KPI we can track for them is how many deals we are helping them close. Everything else is secondary to that.
Jacob Hicks, Owner, Magnyfi
These conversion metrics inside the native LinkedIn analytics tool help your team assess the overall success of campaigns in driving meaningful outcomes.
Conversions: The total number of times LinkedIn users took appropriate action, such as signing up for a Webinar, downloading a whitepaper, or purchasing a product or service.
Conversion rate: Determine the percentage of users who complete a desired action after clicking on your clients' LinkedIn ads. Basically, your client’s LinkedIn ads have led the horse to water, but was it the right horse, and did the website make them drink?
Cost per conversion: This handy metric helps marketing agencies put on their detective hats and evaluate just how cost-efficient and ROI-tastic their clients' social media campaigns are.
Conversion value: And, of course, the Cost Per Conversion is more meaningful when measured alongside the Conversion Value, providing a clear view of the return on ad spend. This metric helps marketing agencies quantify the overall financial impact of their clients' campaigns and justify their advertising spend.
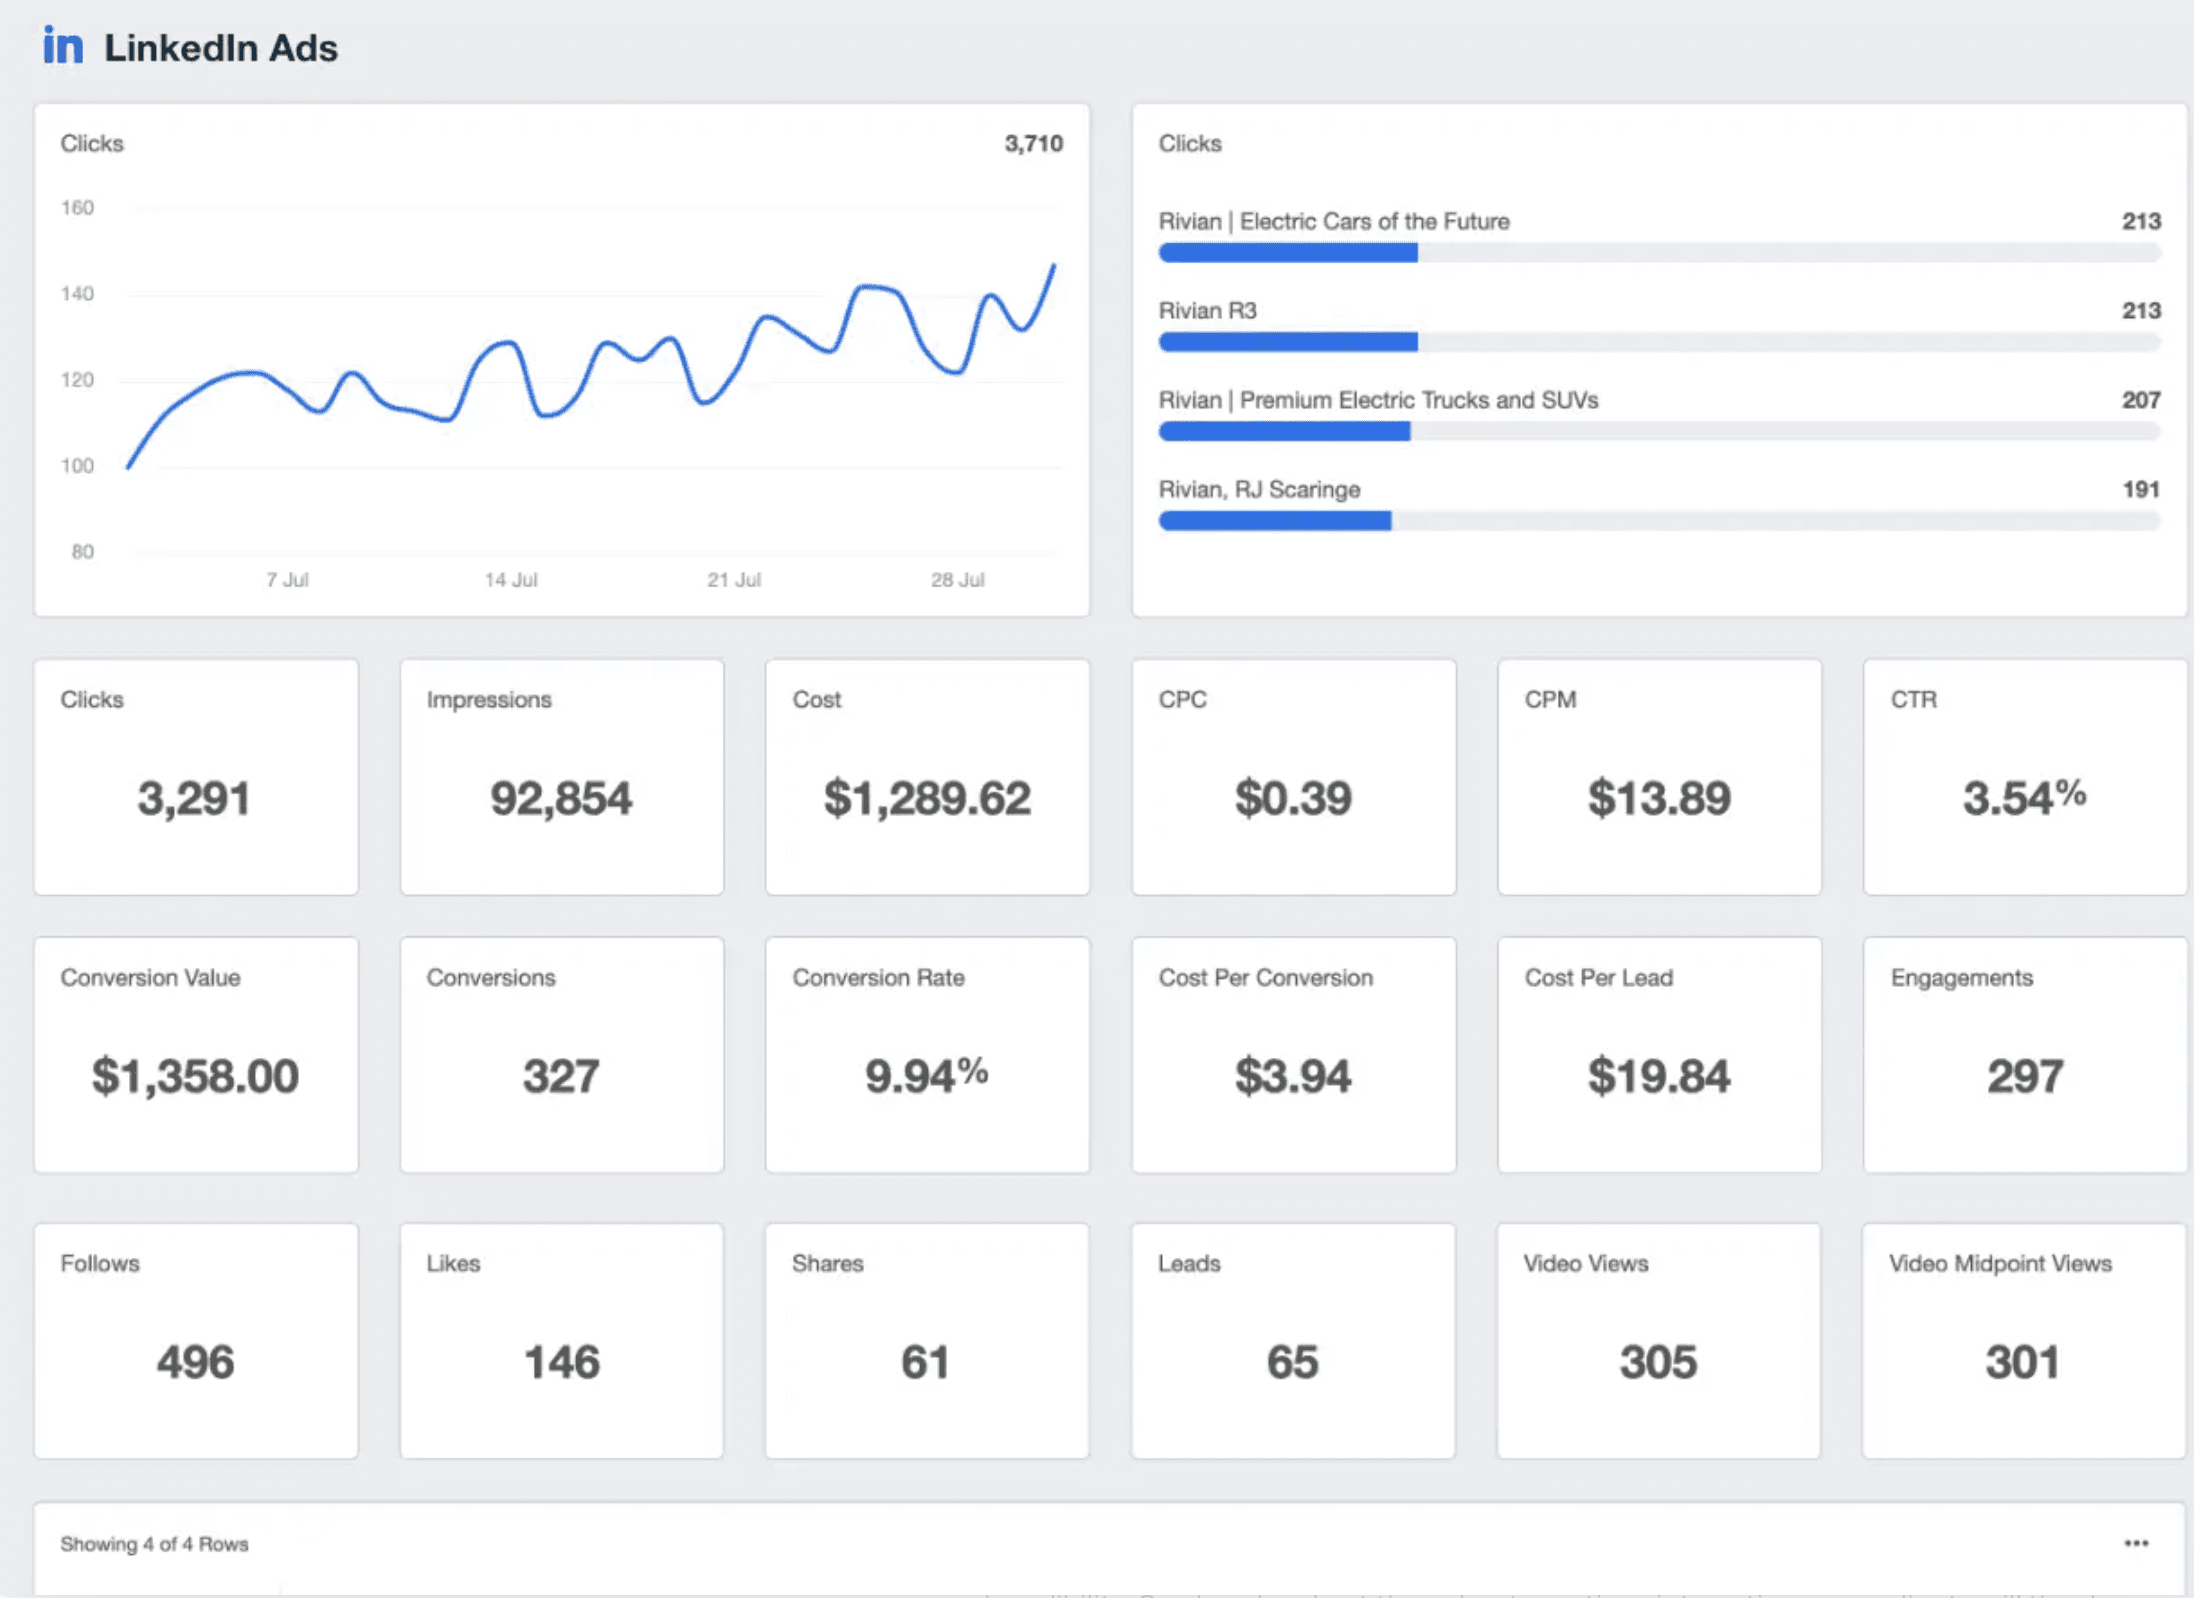
Quickly and easily create client reports that feature the metrics they care about with the LinkedIn Ads reporting dashboard. Try AgencyAnalytics free for 14 days.
Summary and key takeaways
To wrap things up, we've had a close look at the world of LinkedIn analytics and how marketing agencies can use it to help their clients thrive. The main takeaways here include recognizing the limitations of LinkedIn's native analytics dashboard and the benefits of opting for feature-rich third-party LinkedIn analytics tools like AgencyAnalytics for deeper insights, personalization, and handling multiple clients with ease.
We've walked through the must-track LinkedIn metrics for marketing agencies within a LinkedIn analytics report, covering areas like follower growth, post engagement, visitor analytics, and how well ad campaigns are doing. Plus, we've touched on the perks of using third-party tools for scheduling reports automatically, integrating with other platforms such as Google Analytics, and crafting tailor-made, branded reports for clients.
To get the most from your LinkedIn analytics, make it a habit to view analytics regularly through your LinkedIn dashboard or an integrated reporting tool. Start with the basic metrics—like impressions, clicks, and engagement—to understand how your content performs day to day.
Then, go deeper with more detailed metrics that reveal patterns in audience behavior and post performance over time. By learning how to access LinkedIn analytics effectively and track metrics consistently, you’ll gain detailed analytics that help strengthen your LinkedIn presence and demonstrate measurable growth to your clients.
After reading this article, you should be able to tackle this list of to-do items almost immediately:
Evaluate your current LinkedIn analytics approach: Assess the effectiveness of the LinkedIn analytics tools and metrics you're currently tracking.
Identify key metrics: Ensure you're tracking the most important LinkedIn metrics for your own optimization purposes, as well as the ones your clients care about, such as follower growth, post engagement, and ad campaign performance.
Explore third-party tools: Research options like AgencyAnalytics to find the best fit for your agency's needs.
Analyze competitor performance: Benchmark your clients' LinkedIn performance against their competitors and identify areas for improvement. Use this data to set goals for your own campaigns.
Customize reports: Tailor your LinkedIn analytics reports to align with each client's unique needs and goals and add your agency’s white-label branding.
Set up automated reporting: Configure automated report scheduling to keep your clients informed about their LinkedIn campaigns.
So, let's make the most of LinkedIn analytics, fine-tune those campaigns, and boost your clients' online presence and credibility. Go ahead and put these best practices into action—your clients will thank you, and you'll be the go-to LinkedIn experts in no time!
Impress clients and save hours with custom, automated reporting.
Join 7,000+ agencies that create reports in under 30 minutes per client using AgencyAnalytics. Get started for free. No credit card required.
Already have an account?
Log in
Written by
Paul Stainton is a digital marketing leader with extensive experience creating brand value through digital transformation, eCommerce strategies, brand strategy, and go-to-market execution.
Read more posts by Paul StaintonSee how 7,000+ marketing agencies help clients win
Free 14-day trial. No credit card required.


