Table of Contents
Table of Contents
- What Is StackAdapt?
- How StackAdapt Works for Programmatic Ad Management
- 11 Key Programmatic Advertising Metrics on StackAdapt
- Why You Need the StackAdapt Integration on AgencyAnalytics
- What To Include in Your StackAdapt Dashboard
- Connect StackAdapt With AgencyAnalytics in 3 Easy Steps
- Create StackAdapt Reports and Dashboards With Ease
7,000+ agencies have ditched manual reports. You can too.
Free 14-Day TrialQUICK SUMMARY:
StackAdapt reports are an important asset for agencies (and clients) to understand comprehensive, data-driven insights into programmatic advertising campaigns. These reports allow for a deeper understanding of ad performance across multiple channels, offering a way to visualize results alongside other marketing data for holistic analysis. This article guides agencies through the process of integrating StackAdapt data into AgencyAnalytics.
Every agency that offers programmatic advertising deserves an award… seriously.
From managing sizable budgets to integrating multiple agency teams, these ad campaigns are in the big leagues. Naturally, the stakes are high.
A platform like StackAdapt is a powerful solution that keeps campaign execution tight and simplifies multi-channel advertising. Along with these robust capabilities, there’s also a wealth of available data to guide strategic decisions.
While StackAdapt offers in-platform reporting, agencies need a way to consolidate metrics across multiple platforms. After all, clients often have related campaigns outside of StackAdapt, and they’ll need a comprehensive view of overall performance.
In this article, we’ll explore StackAdapt in more detail and why you should pair it with a client reporting tool for greater efficiency.
What Is StackAdapt?
StackAdapt is a programmatic advertising platform that simplifies the creation, execution, and management of multi-channel marketing campaigns.
Because of its in-platform collaborative feature, it becomes easier to streamline project management, especially when multiple agency teams are involved (e.g., media buying, graphic design, etc.).
This self-serve advertising platform also provides access to multiple publishers (e.g., display, video, and native advertisers) across various channels. This eliminates the requirement for manual placements, enabling agencies to distribute advertising content on a significant scale.
To break it down further, StackAdapt specializes in the following niche-based industries:
B2B
Finance
Government
Healthcare
Retail
Travel
Sensitive (e.g., cannabis advertising, gambling)
These verticals often come with specific rules and regulations, which gets complicated when coordinating large-scale ad campaigns. Any oversights or lack of compliance may mean penalties or even unfavorable brand perception on a massive scale.
To combat this, StackAdapt offers various solutions, like built-in ad disclosures and customer journey mapping for tailor-made messaging at each phase.
How StackAdapt Works for Programmatic Ad Management
To get a better understanding of how StackAdapt works, here’s a breakdown of its standout features:
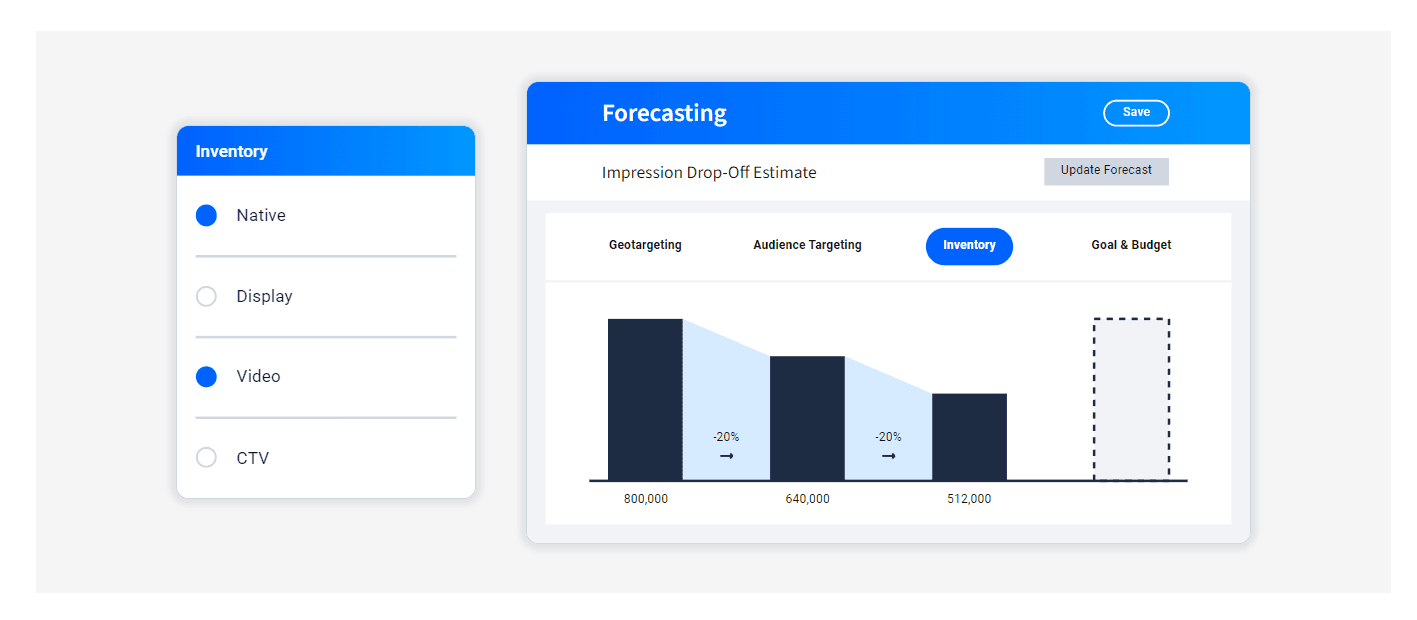
In-platform Planner. This helps agencies to plan projects step-by-step and make data-driven decisions. It includes:
Inventory across various channels (e.g., only native advertising may be available for a particular campaign)
Budget and performance forecasting. This is particularly useful for predicting advertising outcomes and guiding media buying decisions
Campaign Editor. This tool is used to launch, manage, and edit programmatic ad campaigns. To summarize, it includes:
A dedicated interface for setting goals, budgets, and timelines
Advanced geo-targeting options (e.g., reaching an audience within a particular radius or mass-targeting audiences based on multiple zip codes)
Publisher directories across different industries
A breakdown of the Conversion Journey to understand user behavior on a more granular level
Creative Studio. This feature gives agencies access to StackAdapt experts who assist with the optimization of ad creatives. It’s also possible to convert existing ad creatives into other formats (e.g., transforming a static display ad to an interactive design)
11 Key Programmatic Advertising Metrics on StackAdapt
Now that we’ve touched on how StackAdapt works, let’s delve deeper into the data side of things.
After you’ve launched campaigns, it’s essential to gauge advertising performance and make data-driven improvements where necessary. To help you keep things on track, here are the top eleven StackAdapt metrics to monitor.
StackAdapt Metric | Description |
|---|---|
The number of times your client’s ad was displayed to users, which is handy for gauging ad frequency and overall visibility | |
The number of times that users clicked on your client’s ad. Use this metric to understand ad appeal and whether it entices users to learn more | |
The percentage of users who interact with your client’s ads (e.g., clicks, likes) relative to the number of impressions. Address a low engagement rate by improving ad creatives, targeting, or messaging | |
The percentage of users who perform a conversion action (e.g., completing an online sale) after viewing and clicking on your client’s ad. This metric is often a primary goal and demonstrates campaign success | |
Conversion Revenue | The amount of money generated from ad-based conversions. Conversion revenue is a direct measure of financial success and ROI |
Effective Cost per Action (eCPA) | The average cost for conversions that stemmed from your client’s ad. Use eCPA to analyze incurred costs and how it affects revenue |
Effective Cost per Engagement (eCPE) | The average cost for user engagement with your client’s ad (e.g., comments, clicks). eCPE is a measure of ROI for campaigns with audience interaction goals |
Effective Cost per Listen (eCPL) | The average amount your client pays whenever a user listens to an audio-based ad. eCPL measures the cost-effectiveness of these types of campaigns |
The average cost incurred for every 1000 displays of your client's ad, which is helpful to refine bidding strategies if needed | |
How much revenue was generated for your client’s ad relative to its setup cost. ROAS shows how much a specific campaign contributed to the bottom line | |
The percentage of users that viewed your client’s video ad from start to finish. A low VCR rate may mean improving video length, content relevance, and targeting |
Why You Need the StackAdapt Integration on AgencyAnalytics
While StackAdapt has a dedicated reporting platform to analyze metrics, it’s limited to a singular viewpoint: StackAdapts campaigns.
What happens when clients run efforts outside the StackAdapt ecosystem (e.g., a complementary SEO campaign)? You’ll need a way to view those insights alongside StackAdapt data for a more holistic understanding.
Here’s another scenario–having multiple clients that run StackAdapt campaigns. Imagine the headache of logging into multiple StackAdapt accounts when end-of-month reporting time rolls around. Relying on outdated methods (like taking screenshots) isn’t time-efficient or sustainable.
No need to wallow in manual reporting woes–invest in AgencyAnalytics to:
Automate the data retrieval of StackAdapt metrics and stream it into real-time visual dashboards
Assess top-performing StackAdapt ad formats (e.g., display, native, video)
Pinpoint the most frequently used devices for interacting with StackAdapt ads
Create custom dashboards or reports to combine data from related marketing campaigns and platforms (e.g., Google Analytics)
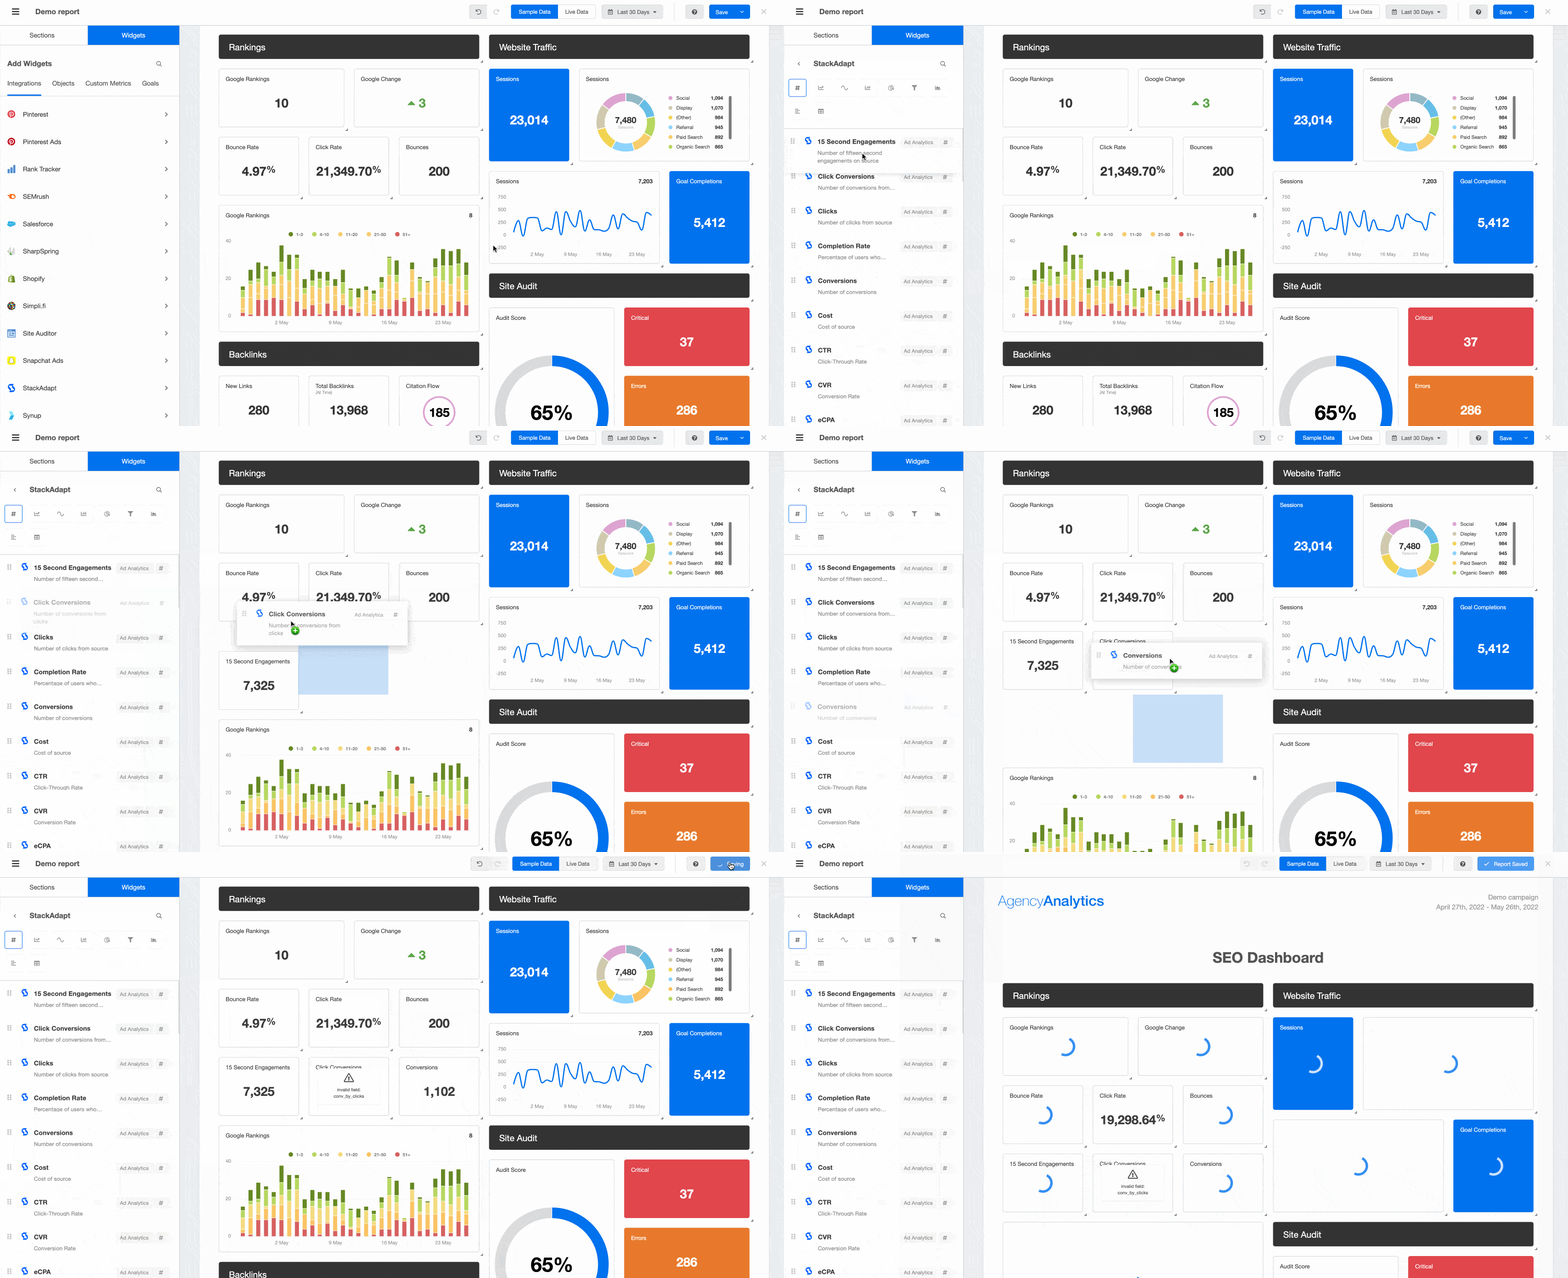
View StackAdapt metrics alongside SEO insights, PPC data, and more. Invest in a client reporting tool that produces sleek dashboards and ready-to-send reports–try AgencyAnalytics today, free for 14 days.
What To Include in Your StackAdapt Dashboard
To present the most valuable insights to your clients, use a comprehensive StackAdapt dashboard organized by:
Campaign Groups
Campaigns
Creatives
Supply Sources
Devices
Here’s a breakdown of each StackAdapt dashboard tab and how it ties into the overall reporting experience.
1. Campaign Groups
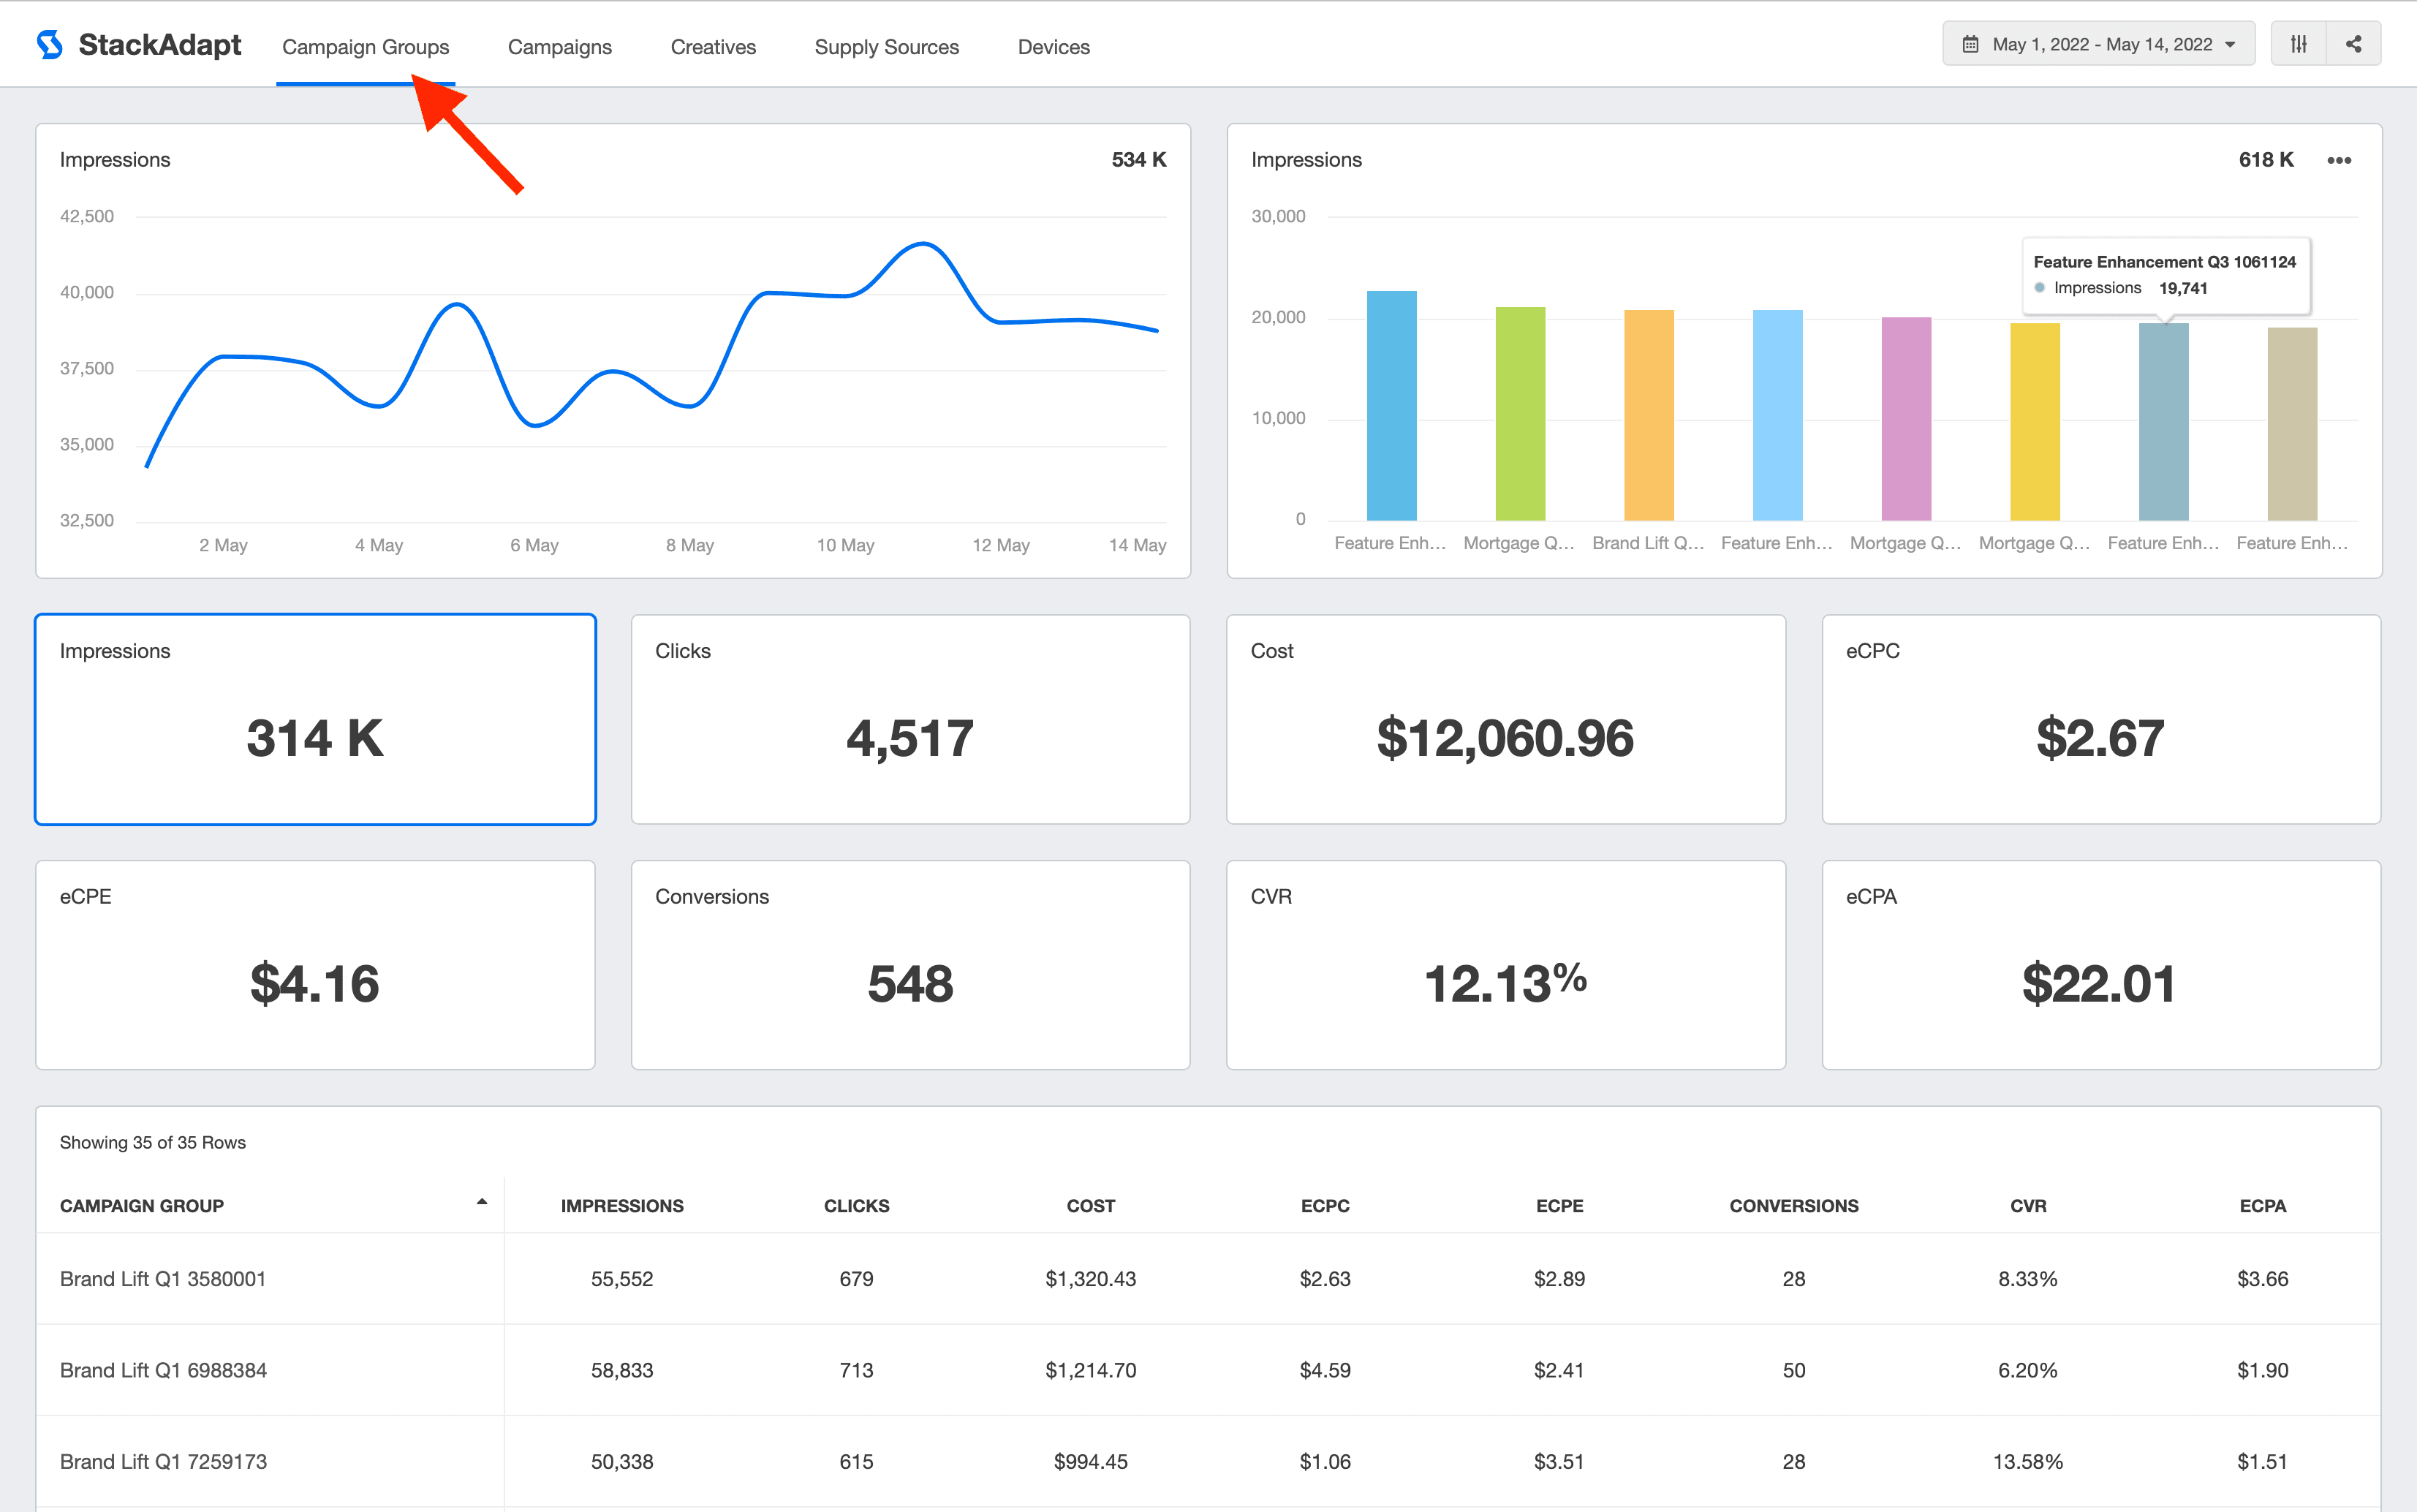
The Campaign Groups tab provides performance overviews for multiple StackAdapt campaigns over time.
This feature is similar to how data is presented on StackAdapt itself and gives you a bird’s eye view of long-term campaign results. Use this tab to identify top-performing campaigns, track historical insights, and showcase overall performance.
Monitor collated metrics like impressions, clicks, and conversion rates across campaign groups.
2. Campaigns
Use the Campaigns tab to get more granular insights on these individual campaigns, broken down by type (e.g., display, native). This is handy to:
Track and analyze performance for each individual StackAdapt campaign
Identify which campaigns drive the most clicks, impressions, eCPAs, and conversions.
Customize this view with other valuable metrics
Monitor ad spend to ensure campaigns stay on budget
See whether your clients are on track to meet OKRs or KPIs
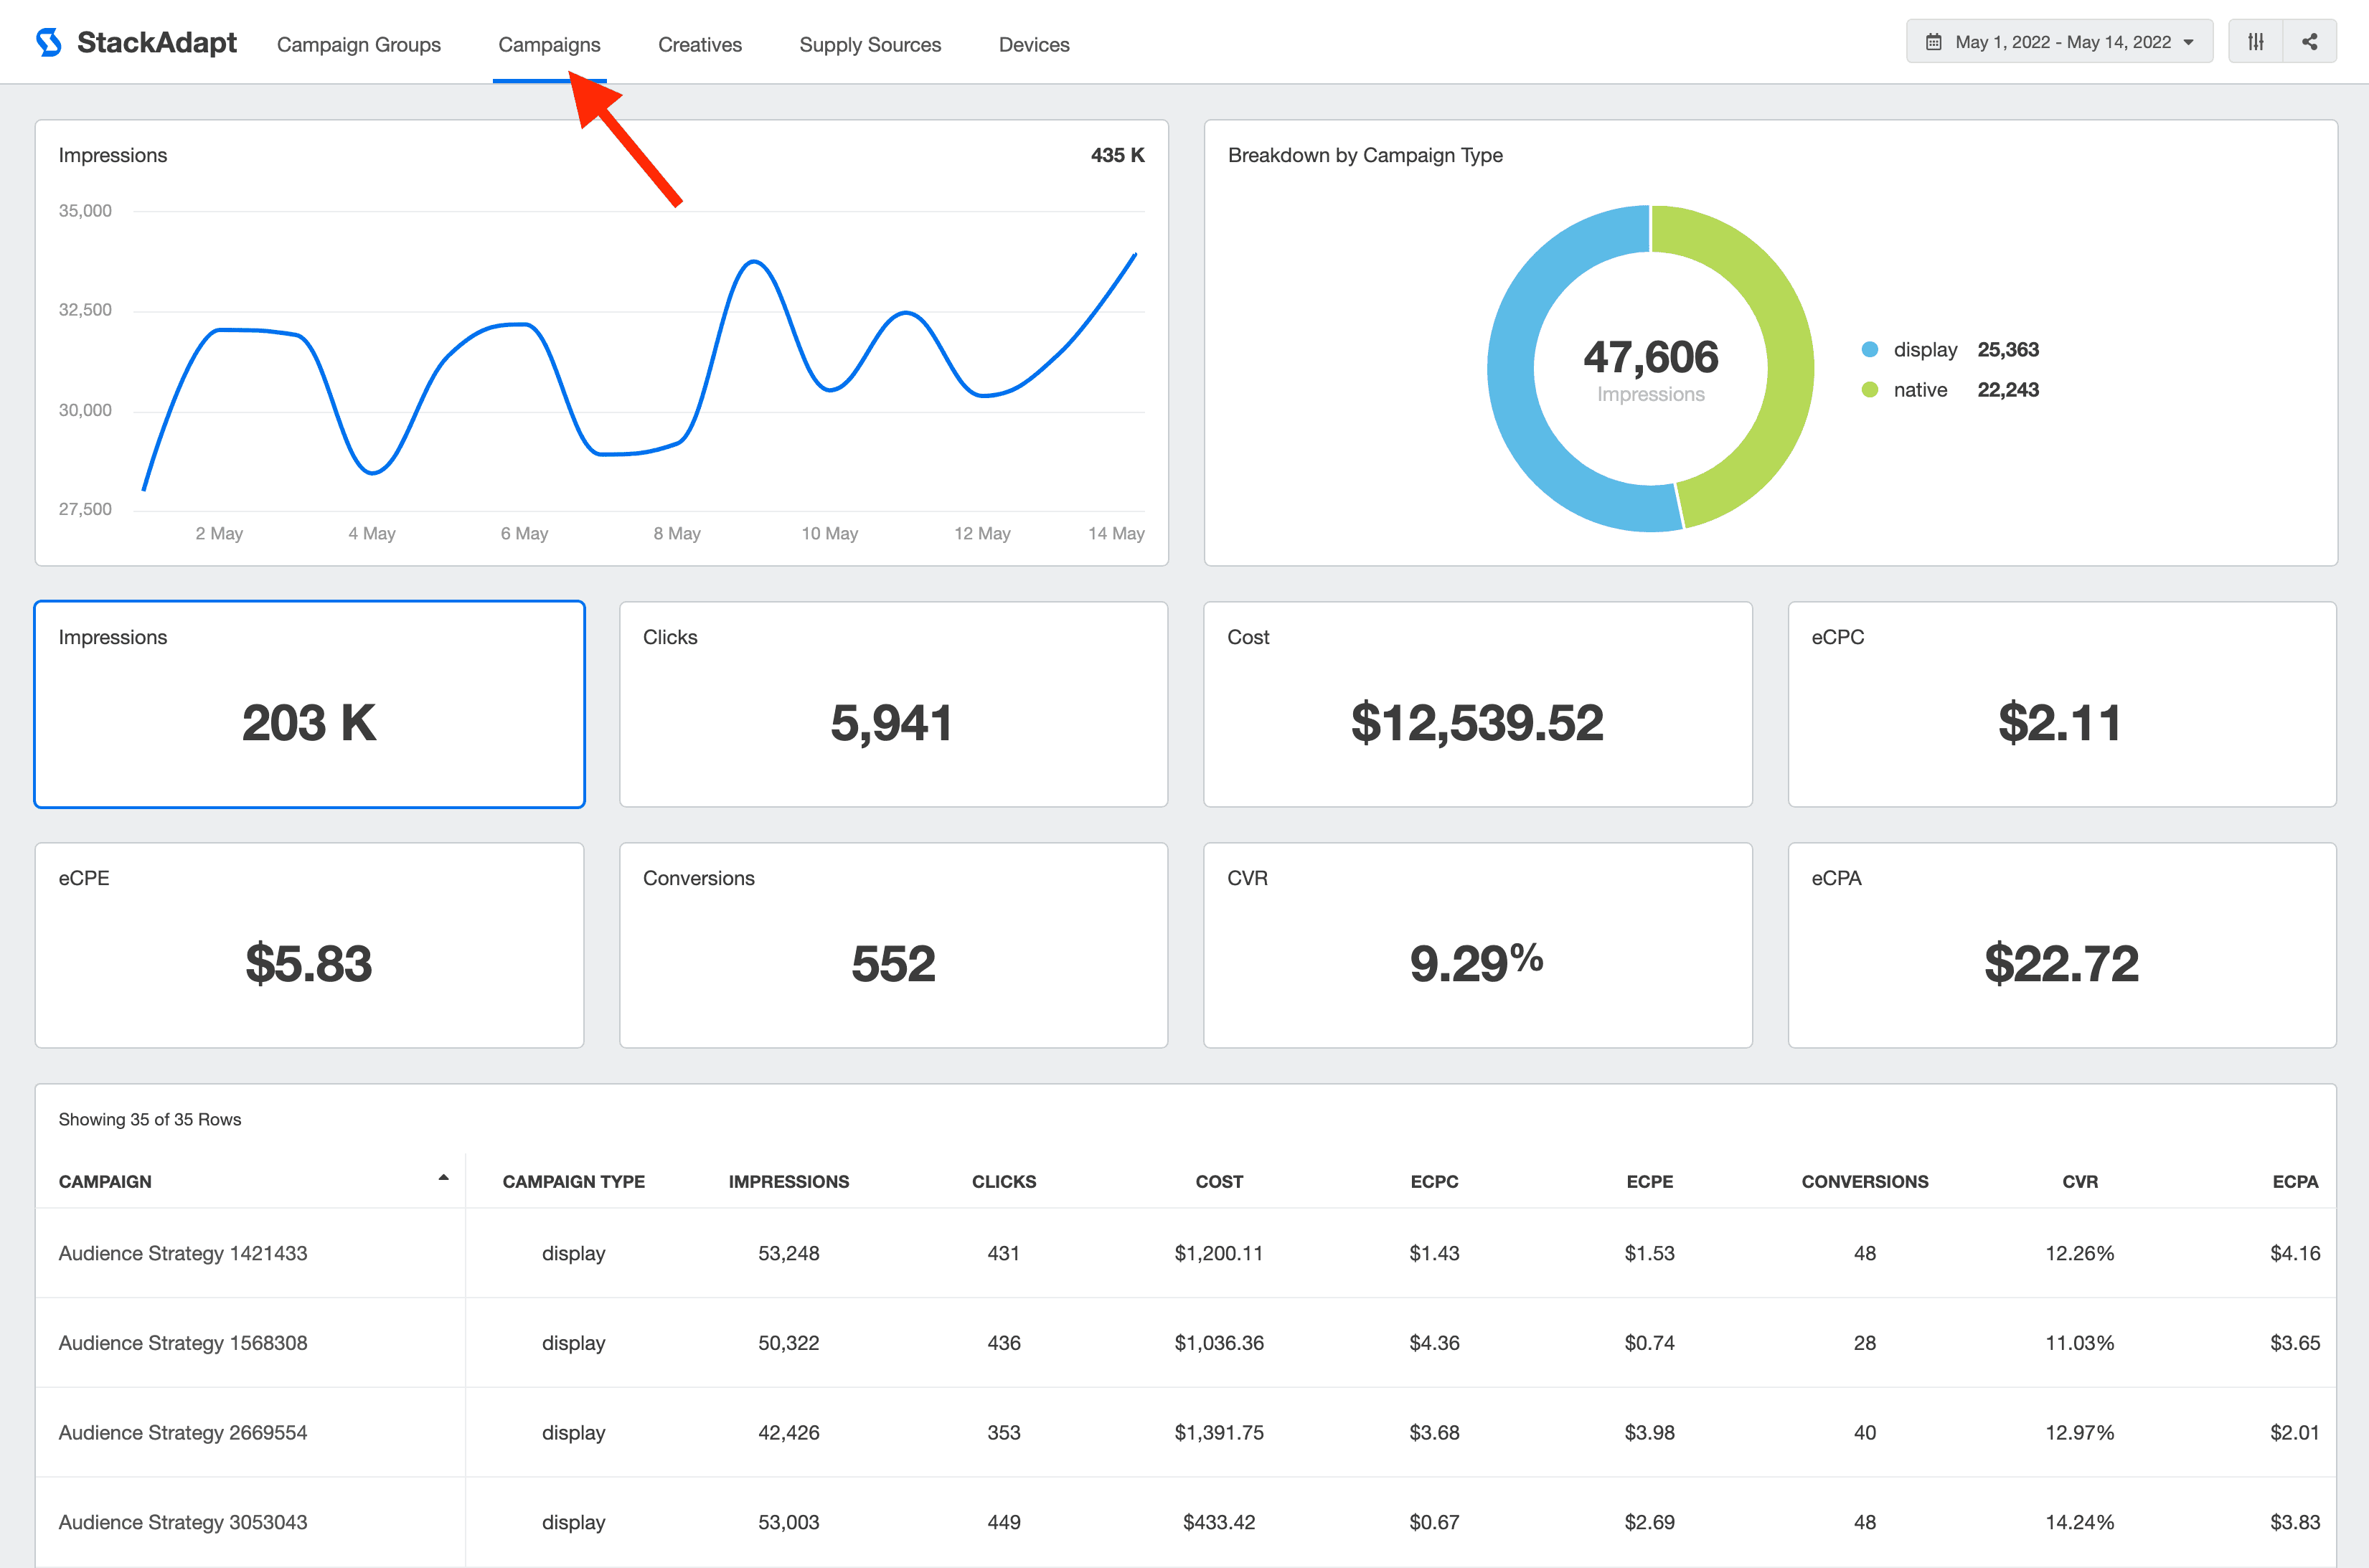
View macro-level StackAdapt metrics and analyze individual campaign insights. Create easy-to-understand dashboards and reports on AgencyAnalytics–sign up for your free 14-day trial today.
3. Creatives
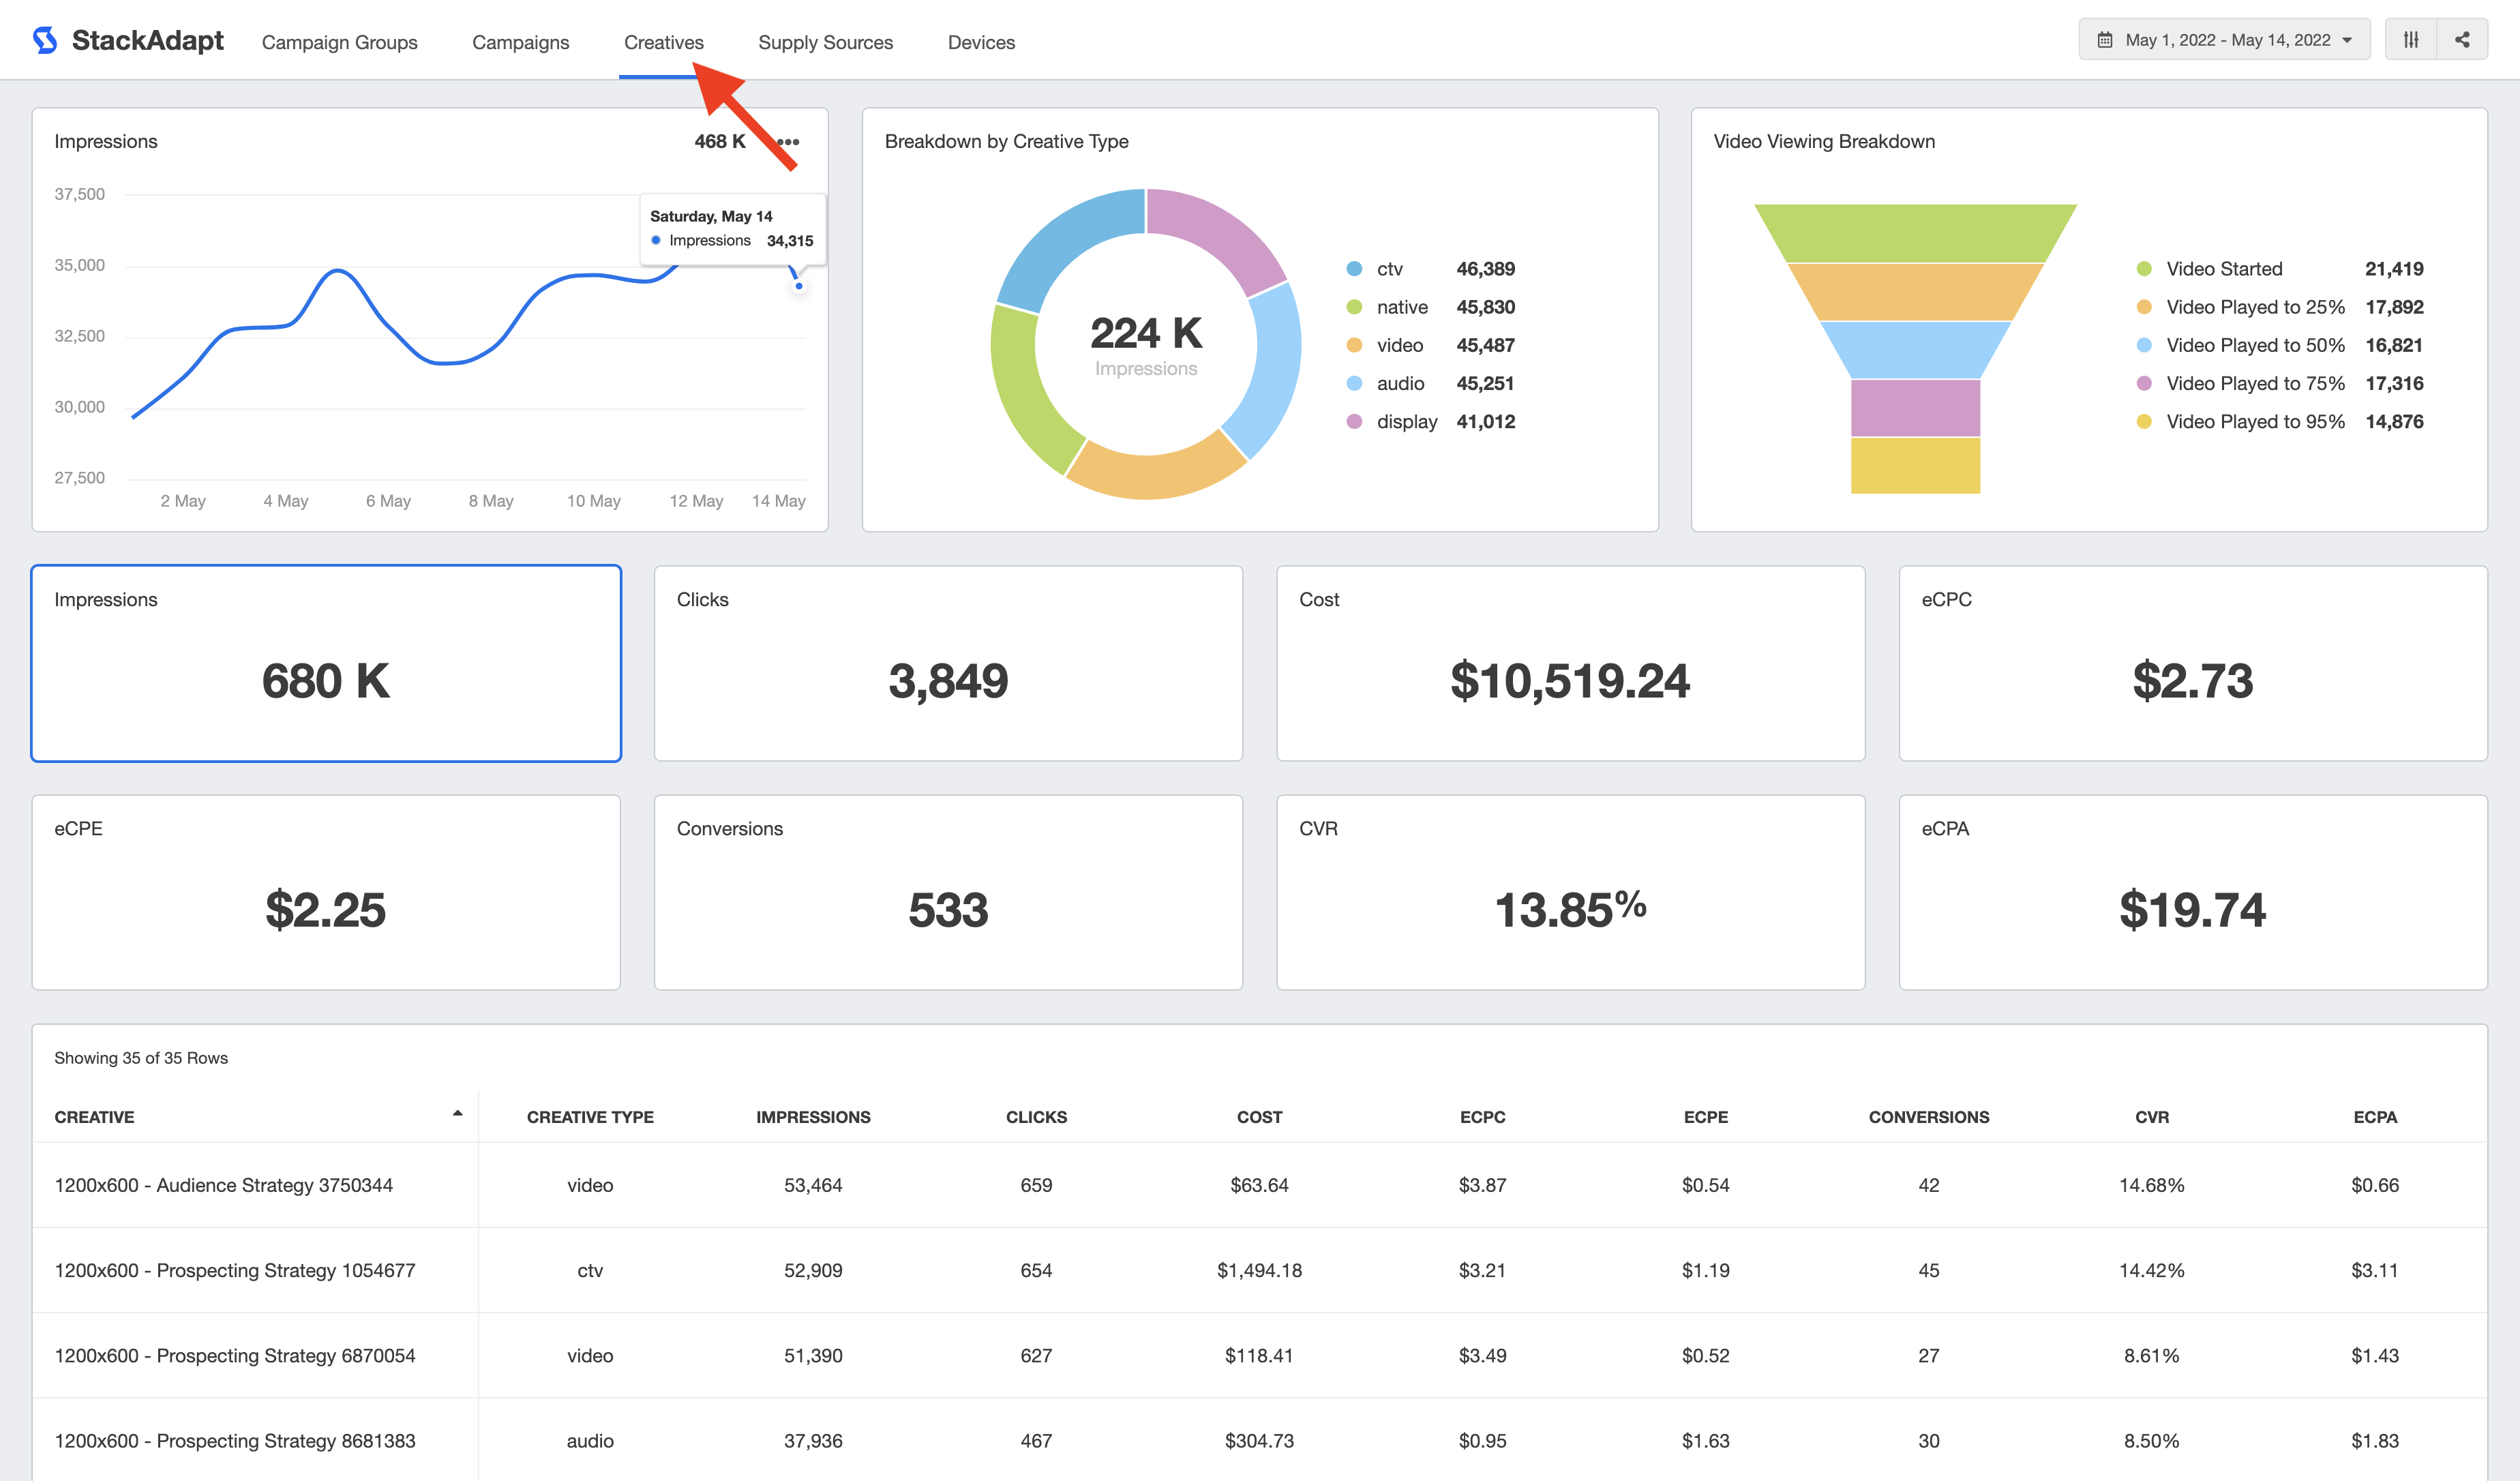
Here’s another vital part of the mix–tracking the performance of ad creatives.
The Creatives tab is crucial for identifying impactful content types, replicating top-performing ads, and making any adjustments (e.g., new images) when needed. Use this data to:
Identify conversion and engagement rates across various formats (e.g., video and audio ads)
Analyze cost-related metrics (e.g., eCPE, eCPL) and budget allocation across creative types (for example, native ads may have had a higher eCPE than display ads, which is useful to guide bidding strategies)
4. Supply Sources
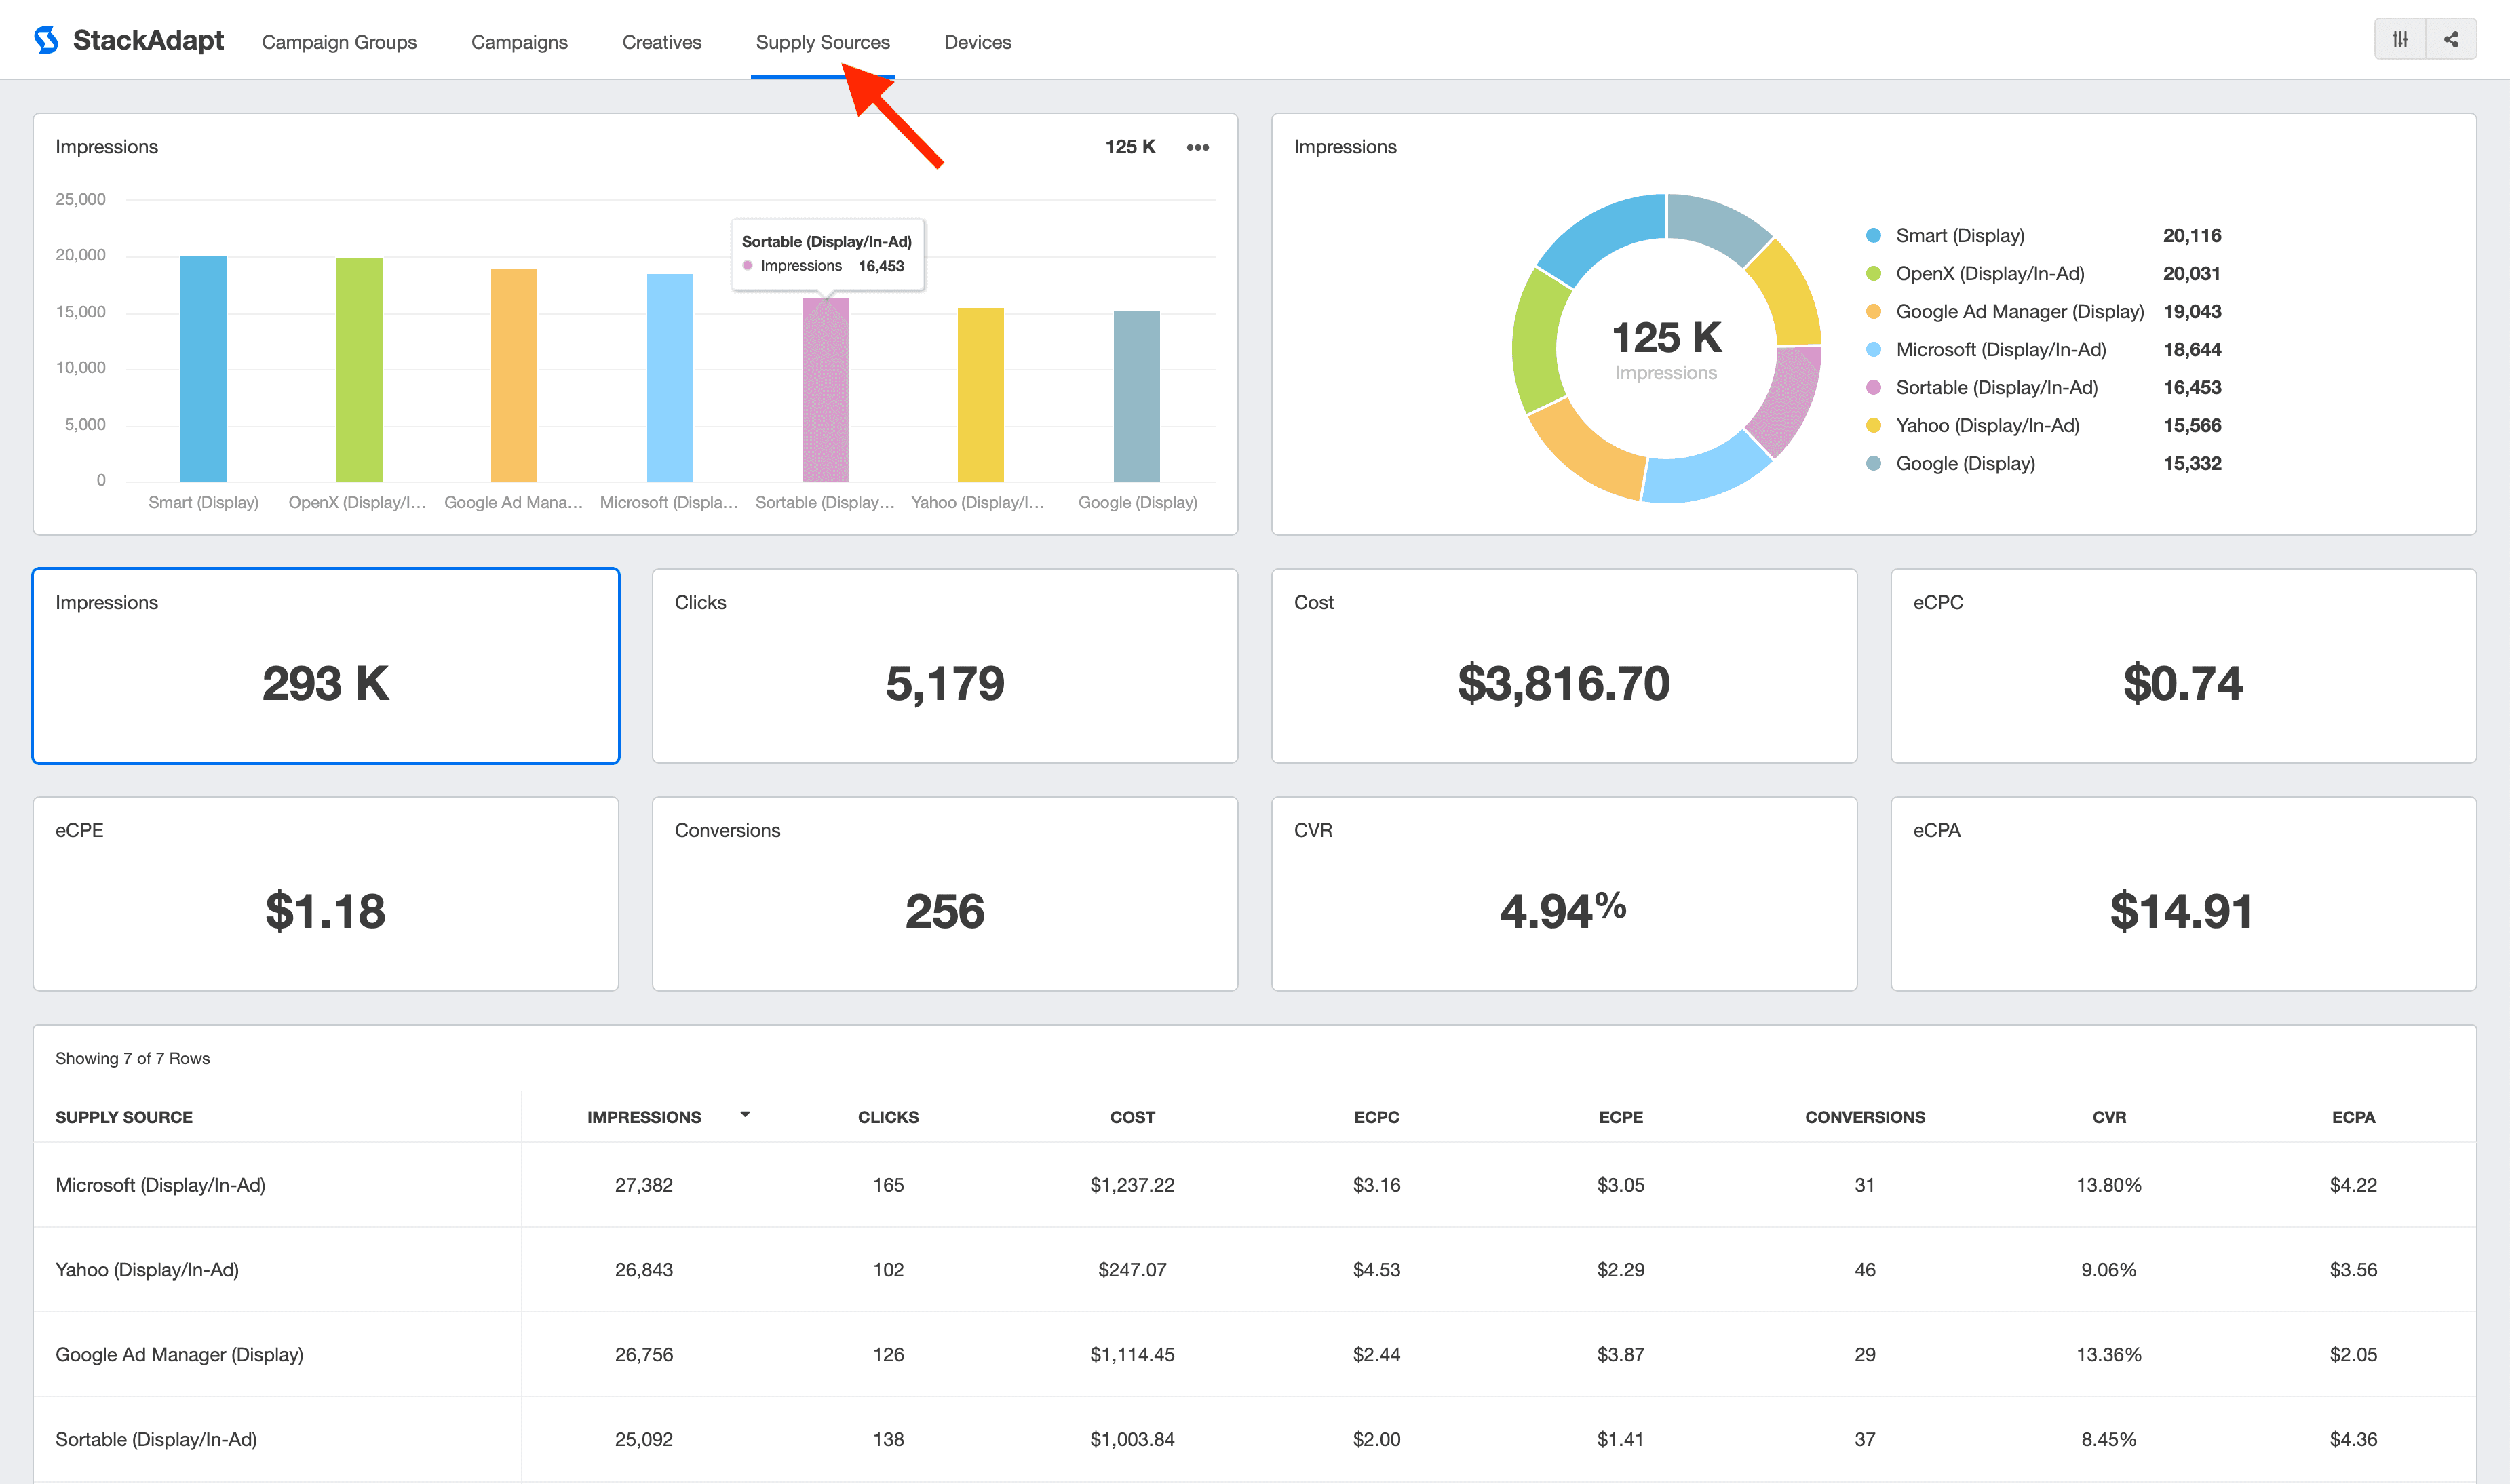
Next, use the Supply Sources tab to view the performance of each ad placement. Be sure to:
Compare clicks across different channels and placements (e.g., Google Display Ads, Yahoo In-Ads) to identify the ads with the most significant impact
Determine the most cost-effective placements by considering metrics like eCPEs, conversions, and ad spend
5. Devices
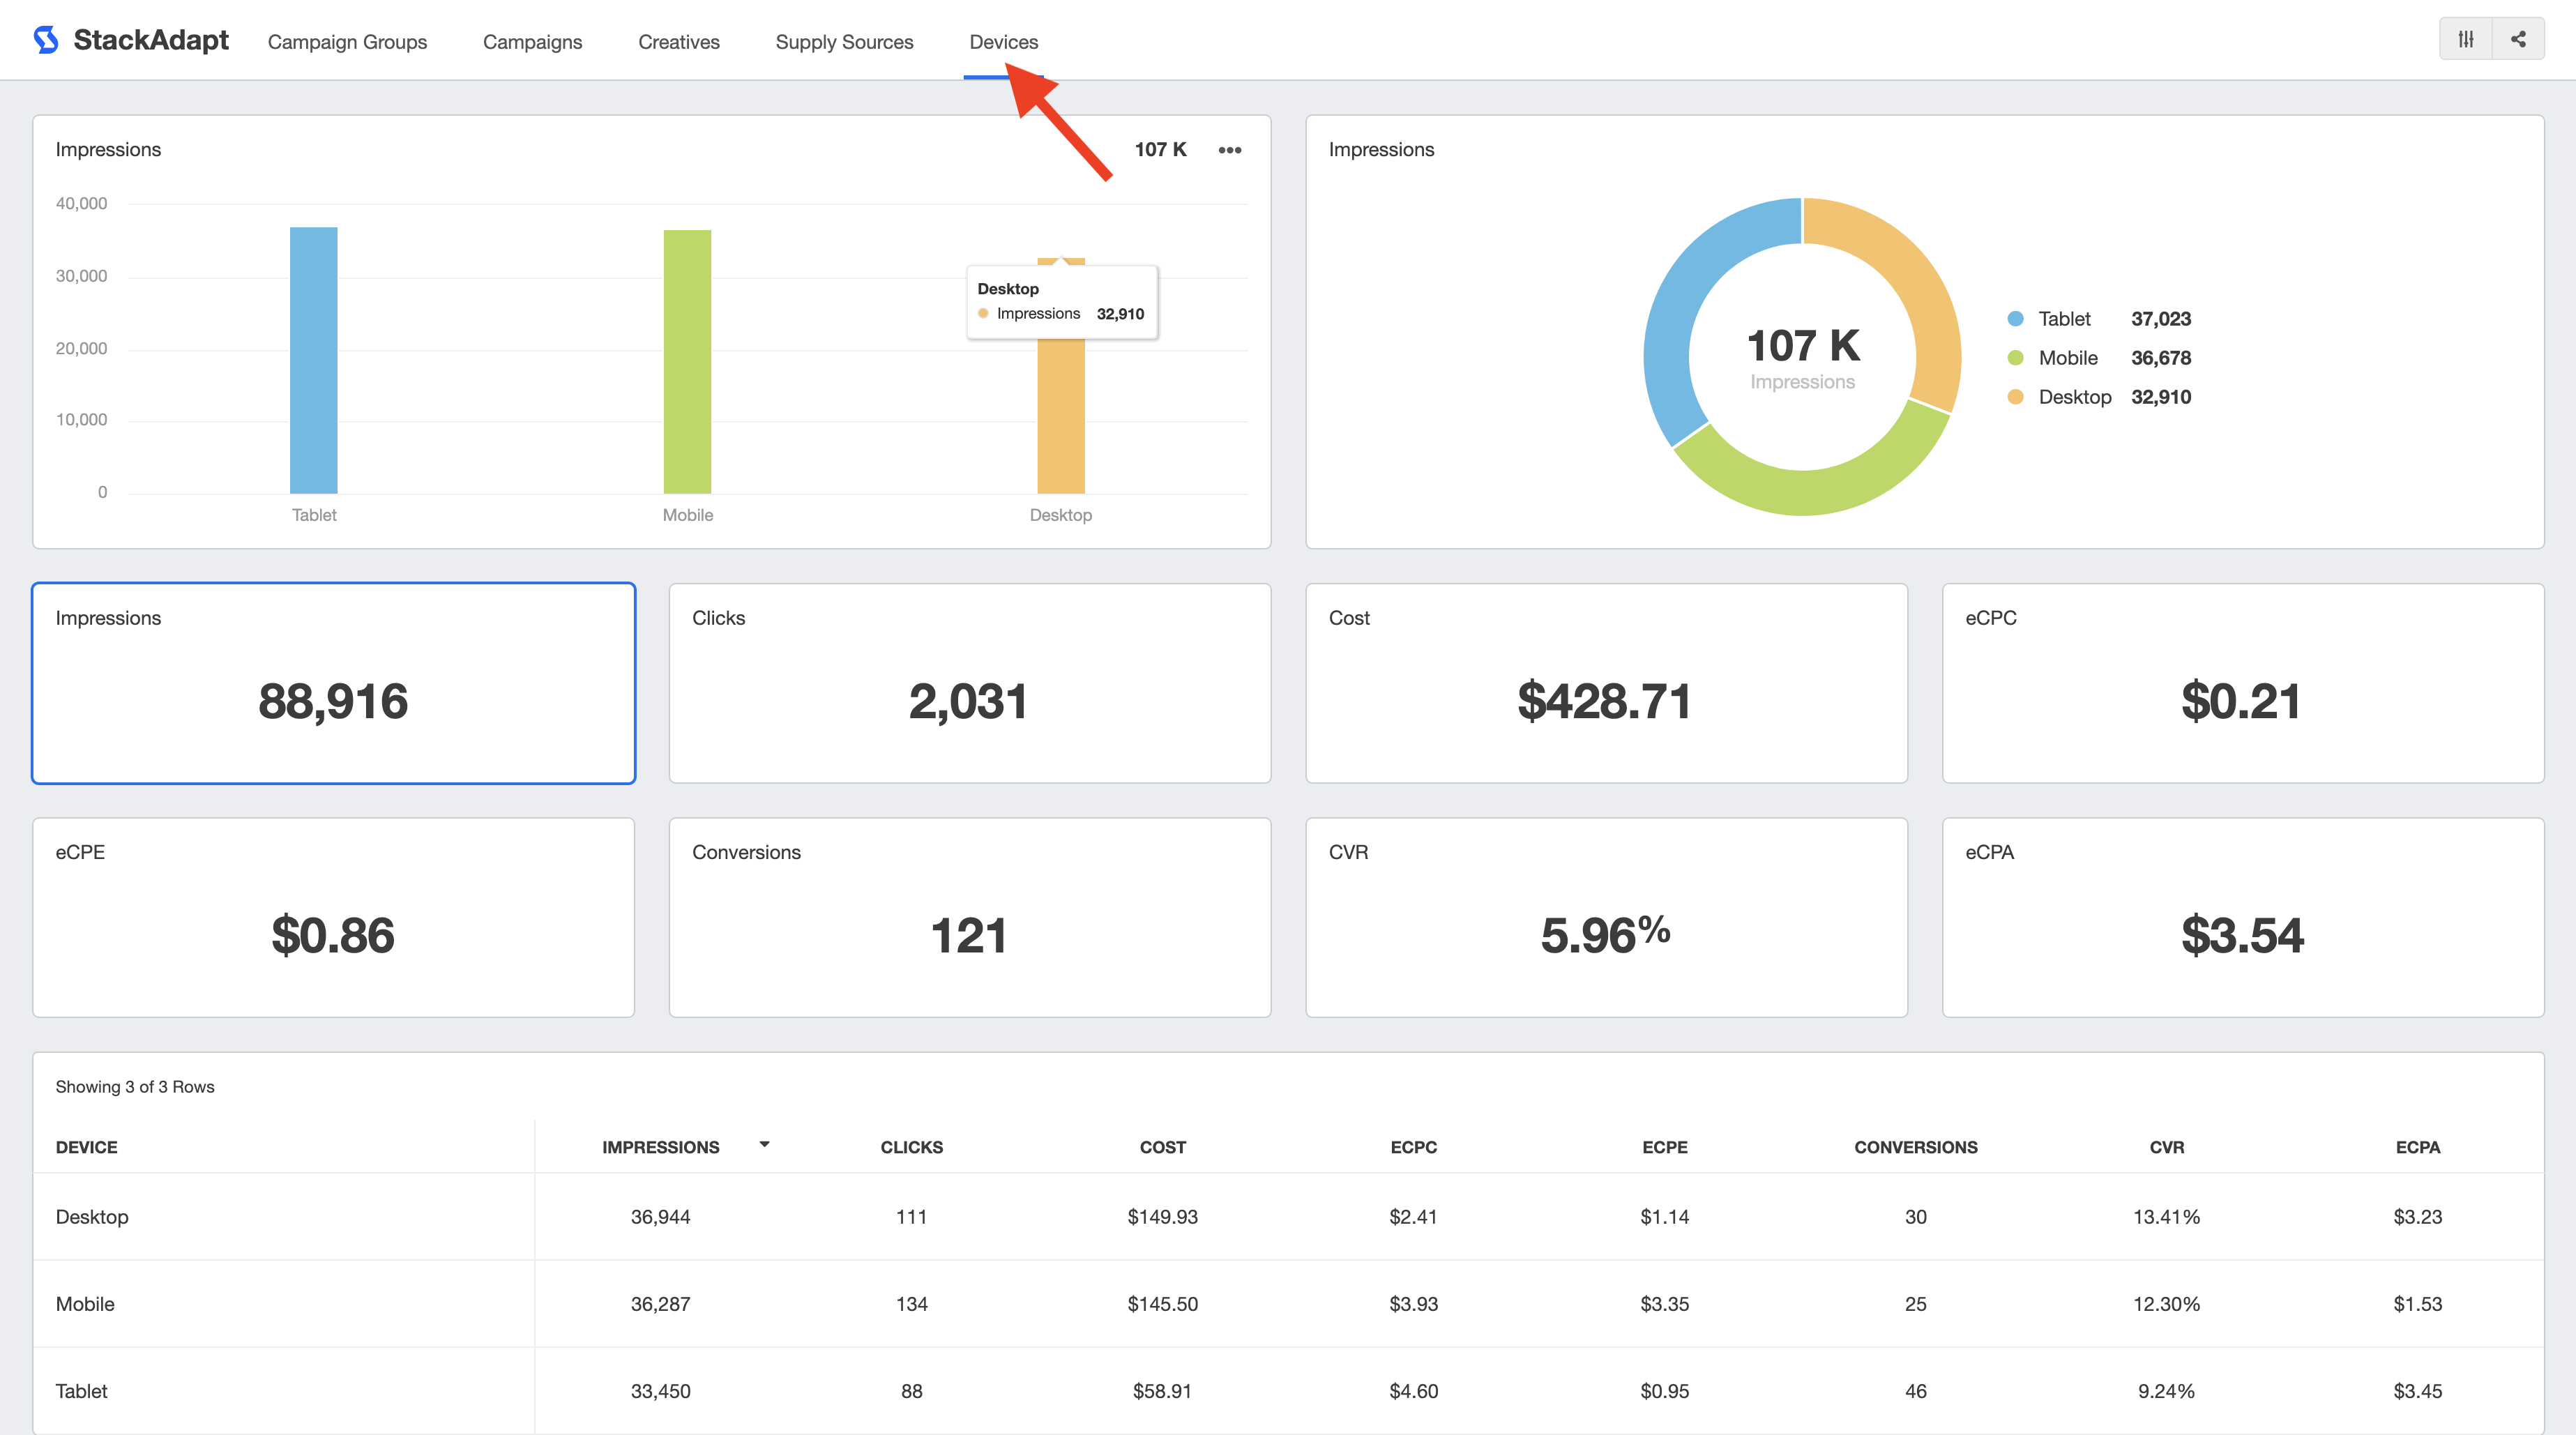
Last but not least is the Devices tab. As the name suggests, this tab breaks down ad performance by device type (i.e., mobile, tablet, and desktop).
Leverage this data by optimizing ad creatives for more frequently used device types.
Connect StackAdapt With AgencyAnalytics in 3 Easy Steps
Getting StackAdapt set up with AgencyAnalytics is a breeze! After logging into your AgencyAnalytics account:
1. Head to ‘Integrations’ on the left-hand menu, and click on StackAdapt (under ‘Paid Ads’ or ‘All Collections’).
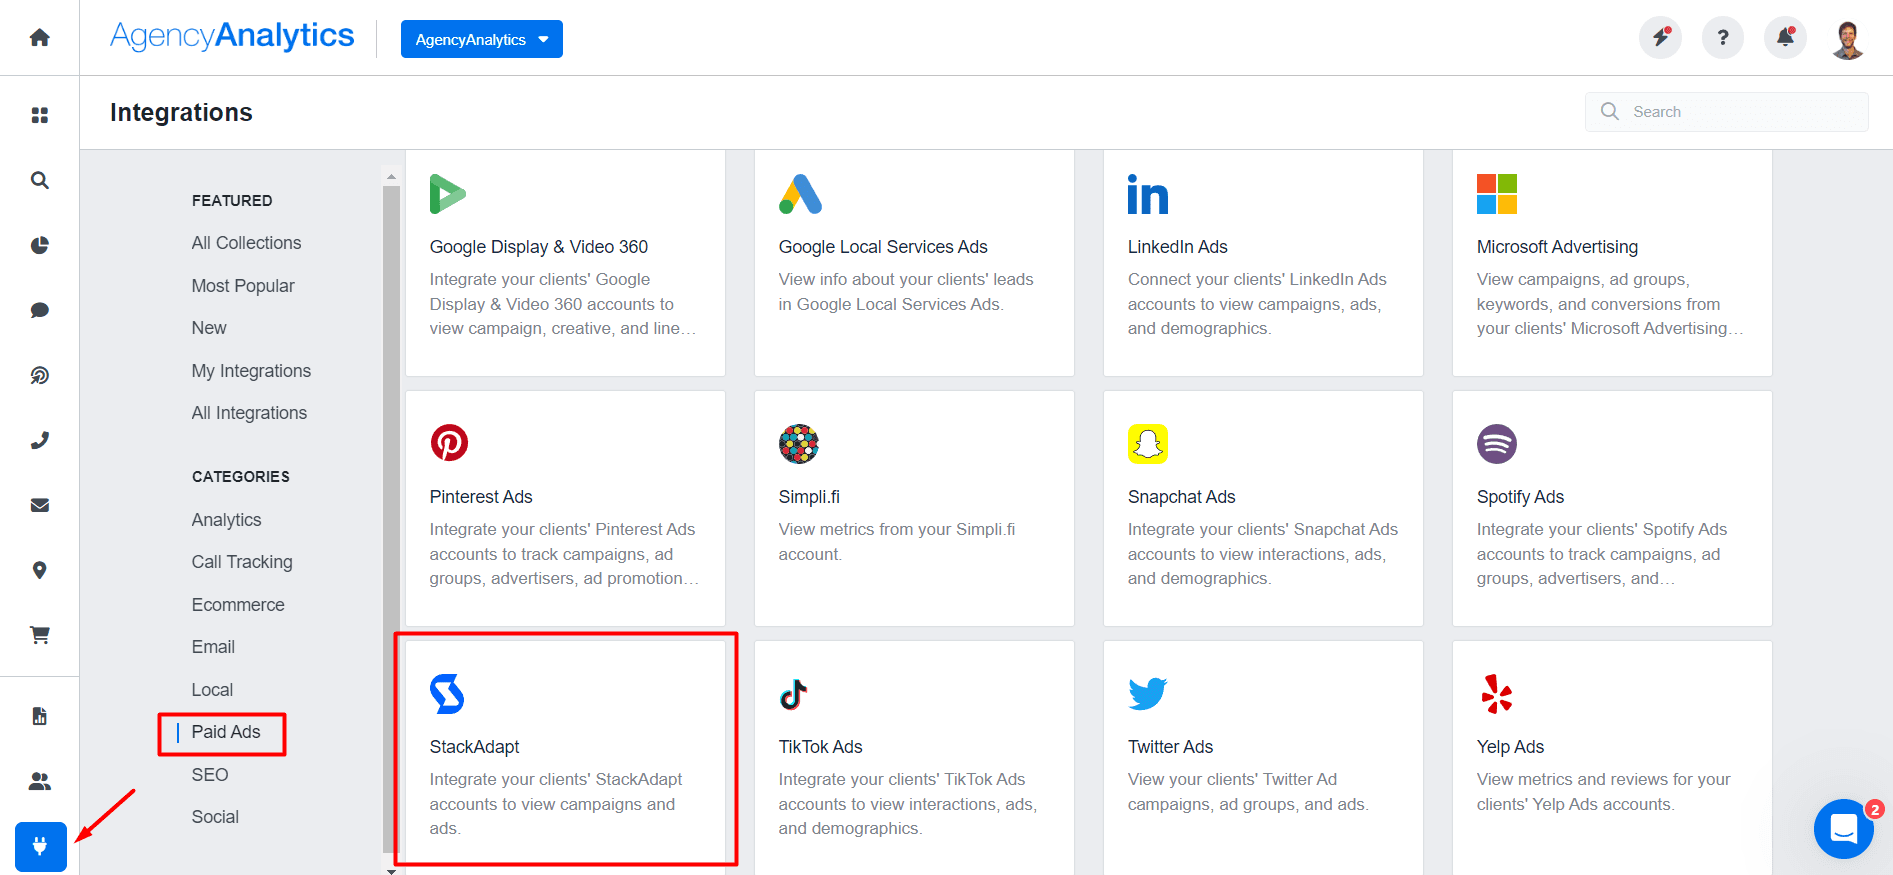
2. Enter your client’s StackAdapt credentials and follow the steps to complete the integration. To verify this connection, look for the small green tick above StackAdapt on the Integrations page.
3. On the left-hand menu, head to ‘Paid Ads’ and click on StackAdapt to view your dashboard. Easy-peasy!
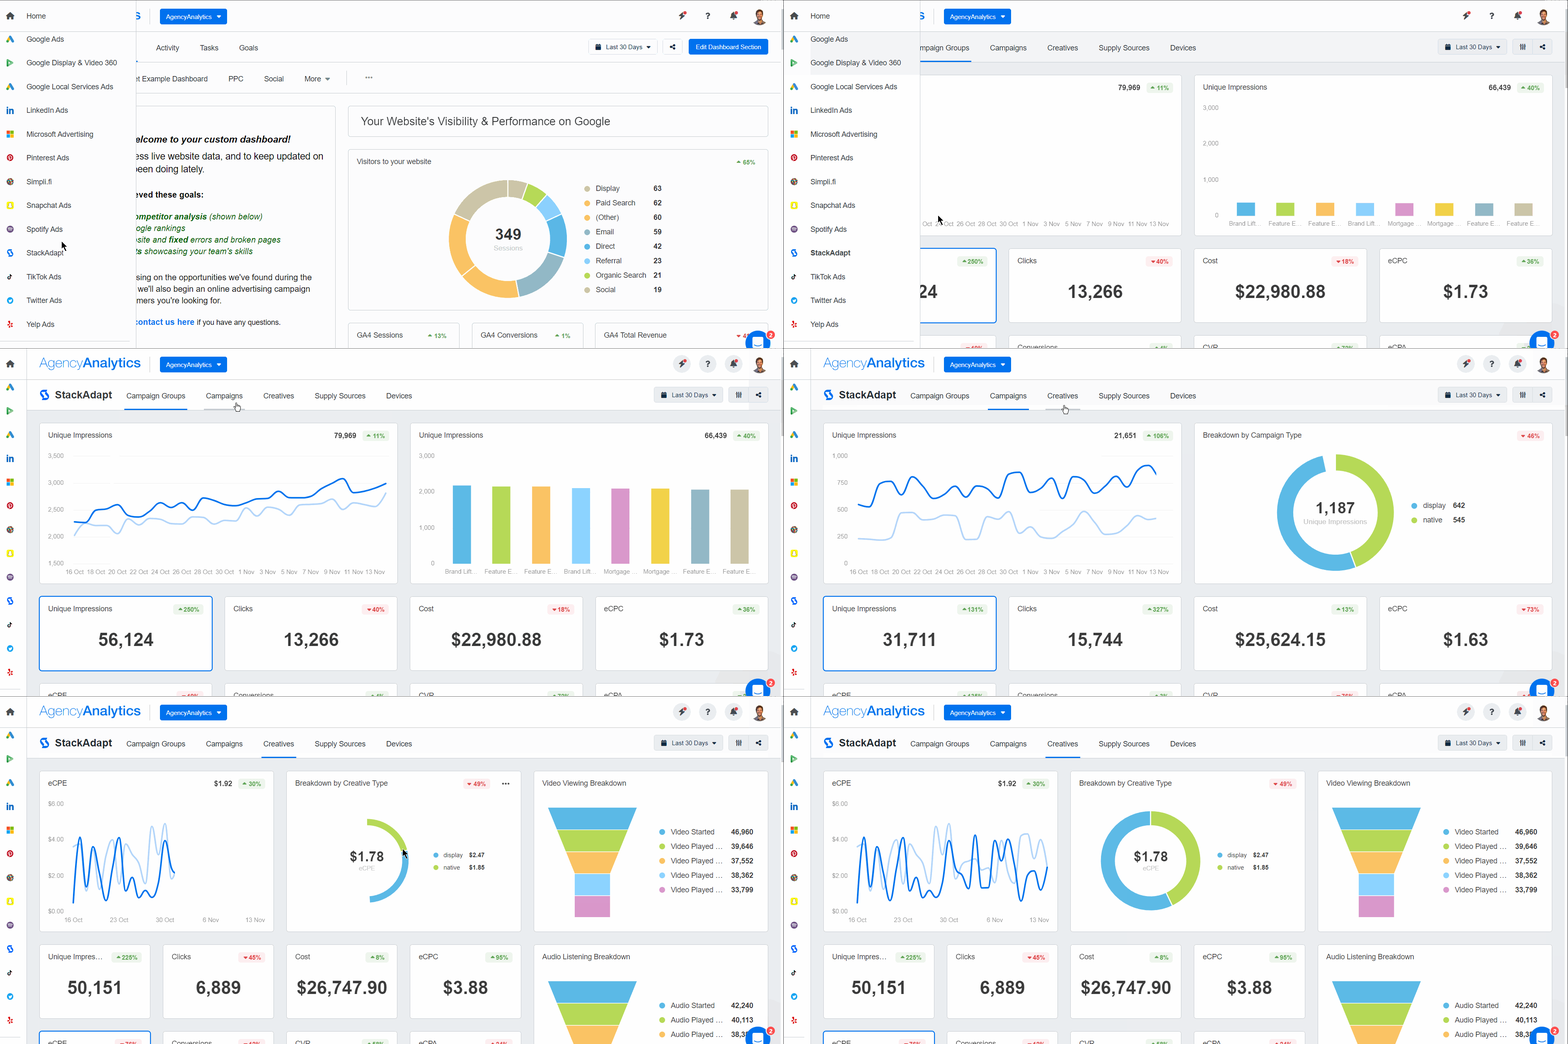
To convert this dashboard into a report, simply click the ‘Share’ button on the top right-hand corner, followed by ‘Download PDF.’
Create StackAdapt Reports and Dashboards With Ease
As we’ve covered, StackAdapt is a powerful programmatic advertising platform, enabling agencies to execute large-scale campaigns seamlessly. After setting up these complex campaigns, one crucial part remains–monitoring StackAdapt results.
While StackAdapt metrics are useful on their own, clients have related marketing campaigns outside the StackAdapt platform that provide additional context. Viewing related insights side-by-side is the only way to provide holistic marketing recommendations and demonstrate your agency’s capabilities.
Investing in AgencyAnalytics is the solution. Consolidate metrics across multiple platforms, create custom dashboards, or export a white-labeled report–you have options!
AgencyAnalytics has helped us simplify our reporting processes, eliminate hours and hours of manual grunt work, and demonstrate our value to our clients. Our clients appreciate the transparency and frequency of our reporting, which has significantly contributed to our growth over the past few years.
Graham Lumley, Director of Marketing at Blackhawk Digital Marketing
No need for multiple reporting tools. Invest in one platform to automate data retrieval and create an efficient agency process–try the StackAdapt integration on AgencyAnalytics, free for 14 days.

Written by
Faryal Khan is a multidisciplinary creative with 10+ years of experience in marketing and communications. Drawing on her background in statistics and psychology, she fuses storytelling with data to craft narratives that both inform and inspire.
Read more posts by Faryal KhanSee how 7,000+ marketing agencies help clients win
Free 14-day trial. No credit card required.


