Video Completion Rate
Engagement Insight
Track full views to gauge the appeal of video content and video ad campaigns.
Content Evolution
Adjust videos for better engagement based on completion data.
Audience Focus
Use rates to fine-tune video ads targeting for optimal viewer match.
ROI Evidence
Highlight in client reports, demonstrating campaign value.
Why Video Completion Rate Is Important
Video Completion Rate stands as a key metric for gauging the effectiveness of organic video content and video ads. This metric shines a light on how well a video captures and retains viewer attention from start to finish. A high Completion Rate often signals that the content or video advertising campaign is engaging and resonates well with the audience, indicating successful communication of the intended message.
In contrast, a lower rate prompts digital marketers to reevaluate and refine their video strategy, including new creative or rotating advertising videos to maintain freshness. This involves analyzing content elements, length, and viewer preferences. By focusing solely on this video advertising metric, marketers gain valuable insights into viewer behavior, preferences, and the overall impact of their video content in the digital space. This provides a solid foundation for successful future video advertisements.

Stop Wasting Time on Manual Reports... Get Insights Faster With AgencyAnalytics
How Video Completion Rate Relates To Other KPIs
Video Completion Rate closely interacts with several other video metrics and KPIs, creating a more comprehensive understanding of campaign performance. For example, it directly correlates with Click-Through Rates (CTR) which may lead to improved video ad placements. Higher Video Completion often leads to increased CTR, as engaged viewers are more likely to take the desired action. Similarly, this rate strongly indicates viewer engagement, which is integral to determining campaign success.
The frequency of a video ad (the number of times a video is shown to a particular user) also impacts Completion Rates, so it’s important to understand the impact of freshness on the Video Completion Rate.
There are more than 800 million videos on YouTube. If you don’t optimize your video to be found on YouTube and in search engines, you’ll most likely have little success with video marketing. As they say, there’s no point in buying an expensive car if you just keep it locked up in the garage.
How To Calculate Video Completion Rate
Video Completion Rate is one of the more important video metrics. To calculate, simply divide the number of complete video views by the total number of video plays to calculate. Then, this quotient is multiplied by 100 to express the result as a percentage. This calculation offers a straightforward yet powerful insight into how many viewers watch a video in its entirety.
Video Completion Rate Formula Example
What Is a Good Video Completion Rate?
A good average Video Completion Rate typically ranges from 70% to 80%. This indicates that a majority of viewers are engaged enough to watch through the entire video duration.
High Completion Rates suggest that the content is resonating well with the audience, fulfilling their expectations, and effectively communicating the intended message.
What Is a Bad Video Completion Rate?
Lower Video Completion Rates falling below 50% are often considered poor. This low rate may point to issues such as unengaging content, inappropriate audience targeting, or suboptimal video length.
This metric calls for a thorough review and adjustment of the video strategy to better captivate and retain viewer attention.
How To Set a Video Completion Rate Benchmark for Clients
In the absence of industry benchmarks, advertising agencies often establish their own standards by analyzing historical data. By examining past campaigns, they identify average Completion Rates that have historically correlated with successful outcomes. This approach allows for a tailored benchmark that aligns with specific campaign goals and audience characteristics.
Agencies also back-calculate the required Video Completion Rate to meet specific engagement targets, particularly for advertising videos. By understanding the relationship between Video Completion and specific outcomes, such as lead generation or sales, they determine the Completion Rate that typically leads to these results. This method offers a strategic approach to setting benchmarks, ensuring they are directly tied to the agency's overall objectives.
Granular Insights Into Video Completion
To gain deeper insights into the Video Completion Rate, agencies segment the data by various demographics, such as age, gender, location, or device used. This allows for an understanding of which segments are more engaged with the video content. Analyzing Completion Rates at different points in the video (e.g., at 25%, 50%, 75%) reveals viewer drop-off points, providing clues for content optimization and informing future videos.
Another approach is to correlate Completion Rates with other engagement metrics, like social shares or comments, to see if higher completion correlates with increased engagement. This multidimensional analysis uncovers nuanced insights, leading to more effective video content strategies.
Why Video Completion Rate Matters to Clients
For clients, Video Completion Rate is a direct indicator of how compelling their message is to their audience. A high rate suggests that the content is engaging, relevant, and resonates with viewers, which is crucial for brand building and message dissemination. It's a tangible way to gauge the effectiveness of storytelling and content appeal, vital for ensuring marketing investments are hitting the mark.
For clients with specific calls to action in their videos, Completion Rates are seen as a precursor to conversion rates. If a video is watched to the end, it implies the viewer's interest in the product or service, potentially leading to higher conversion rates. This metric becomes a key performance indicator for evaluating the direct impact of video content on business goals, such as lead generation or sales.

Why Video Completion Rate Matters to Agencies
For agencies, Video Completion Rate goes beyond measuring content effectiveness. This metric is a reflection of their expertise in creating targeted and engaging content. It provides valuable insights into the agency's ability to craft messages that capture attention and maintain it through the entirety of the video. This metric is a testament to the agency's proficiency in understanding and appealing to the client's target audience.
Agencies also use this KPI as a diagnostic tool. Low Completion Rates signal areas for improvement, whether in video length, content pacing, or audience targeting. This metric guides agencies in fine-tuning their strategies, showcasing their adaptability and commitment to delivering results. High Completion Rates, on the other hand, serve as a portfolio highlight, demonstrating the agency's capability to craft compelling video narratives that drive engagement and results.

Win Back Billable Hours by Automating Your Client Reporting
Best Practices When Analyzing and Reporting on Video Completion Rate
Evaluating Video Completion Rate allows for a deep dive into audience engagement, revealing insights that help refine content strategies and boost campaign effectiveness. By examining this metric from multiple angles, marketers gain a holistic view of an audience's behavior, guiding them toward more impactful and efficient campaigns.
Ensure Data Accuracy
Accuracy is key when measuring Video Completion Rate. This precision in measurement forms the basis for actionable insights and strategic decisions.
Analyze Video Completion Rate Over Time
Examining Video Completion Rate over time reveals trends and patterns in viewer engagement, guiding future content creation and strategy adjustments.
Interpret Trends and Anomalies
Interpreting trends and anomalies in Video Completion Rate helps understand unexpected shifts in viewer behavior and underlying factors affecting engagement.
Put Video Completion Rate in Context
Putting Video Completion Rate in context with other marketing metrics and campaign objectives ensures that conclusions drawn are relevant and aligned with overall goals.
Visualize Video Completion Rate Performance
Visualizing Video Completion Rate performance with clear, concise graphs or charts aids in quick comprehension and effective reporting.
Include Actionable Recommendations
Actionable recommendations based on Video Completion Rate analysis offer specific, practical steps to improve this KPI, directly impacting campaign success.
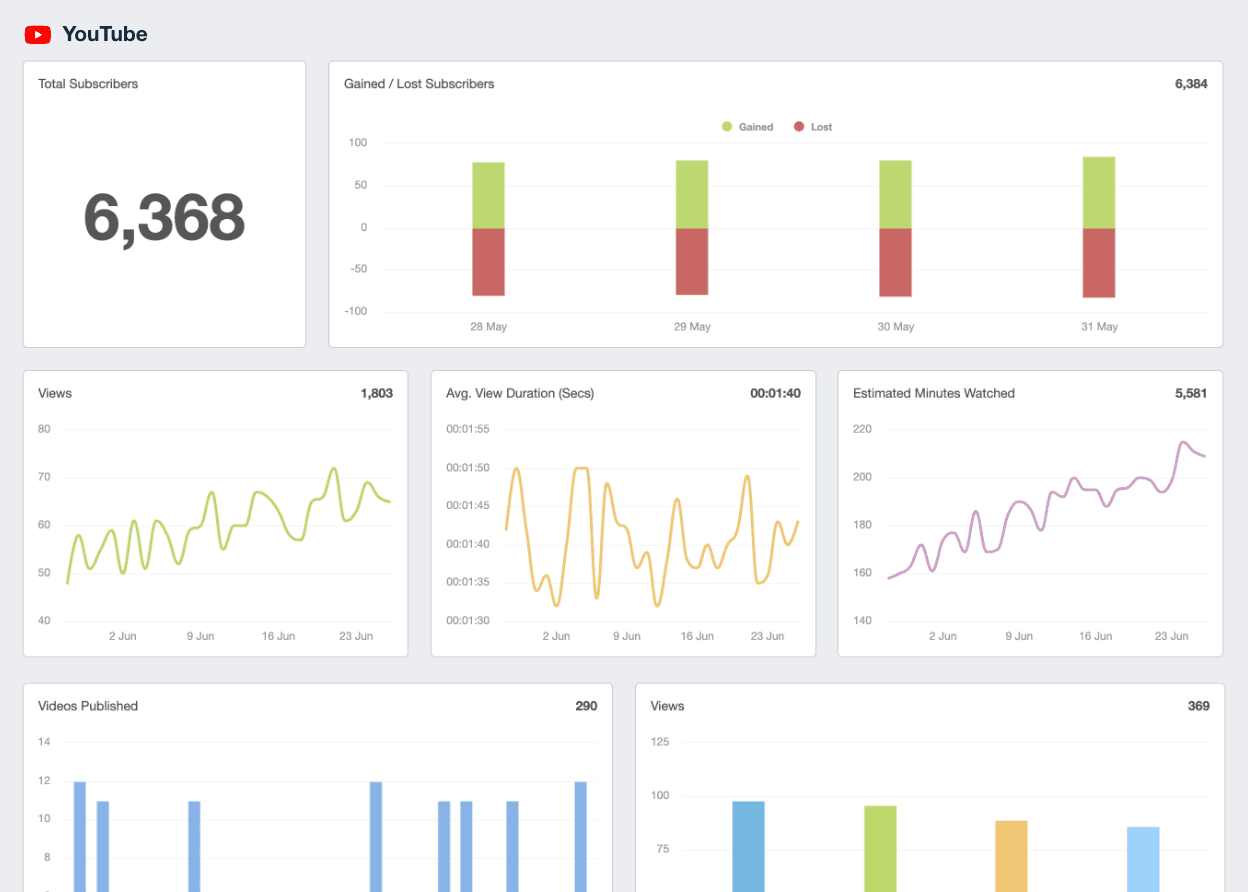
YouTube Dashboard Example
Related Integrations
How To Improve Video Completion Rate
To enhance the effectiveness of video marketing efforts, improving Video Completion Rate is key. Here are some actionable tips to increase the likelihood of viewers watching videos to the end.
Engaging Start
Create an enticing beginning to immediately grab the viewer's attention. The first few seconds are crucial in deciding whether a viewer will stay or leave. Use compelling visuals, intriguing questions, or surprising facts to ensure a captivating start.
Optimal Length
Keep videos concise and to the point. The ideal length varies, but shorter videos tend to retain attention better. Aim for 1-2 minutes for informational or promotional content, adjusting based on the audience's preferences and complexity of the subject.
Strong Storytelling
Incorporate storytelling to make the video more engaging. A narrative structure with a clear beginning, middle, and end helps maintain interest. Use relatable characters, conflicts, and resolutions to create an emotional connection with the audience.
Related Blog Posts
See how 7,000+ marketing agencies help clients win
Free 14-day trial. No credit card required.


