Google Analytics Reporting Tool for Intelligent Agencies

Google Analytics Report Generator From Raw GA Data to Client-Ready in Minutes
Turn complex GA analytics into clear, actionable reports that clients understand. From traffic and engagement to conversions and ROI, delivers insights that drive smarter marketing decisions for clients with the GA reporting tool built for smart agencies.
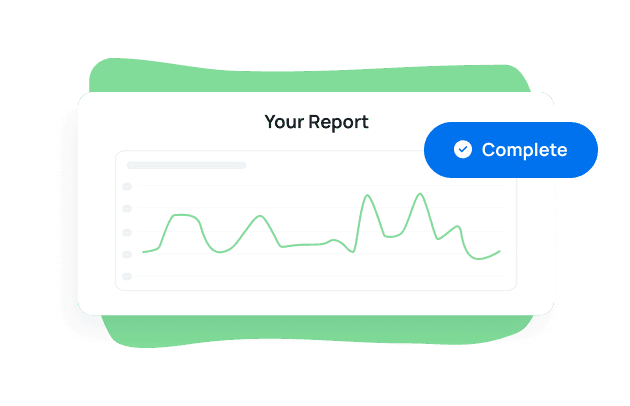
Clear Data Visualization
Ditch the spreadsheets. Use bar graphs, line charts, and other visualization widgets to turn Google Analytics data into client-friendly visuals that make your wins easy to see.
Segment Marketing Channels
Break down Google Analytics traffic by channel to show exactly what’s driving traffic, events, and conversions—so clients see what’s working and where to invest.
Understand the Audience
Deliver insights on who’s engaging—from device types to language and location—so your clients get the audience analytics they expect from a professional agency.
Conversion & Event Tracking
Show the full picture with reports that track conversions, events, and revenue. Impress clients with dashboards that make every dollar of ROI crystal clear.
Eliminate manual data work with a Google Analytics reporting software
Logging in and out of all your clients’ Google Analytics accounts to gather actionable data is tedious and time-consuming. Automate your entire data-collection process with a customizable Google Analytics dashboard populated with live data that automatically puts metrics and KPIs into intuitive graphs. Turn them into white labeled client reports in seconds. No need for separate reports in GA!
Creating Google analytics reports for clients for multiple sites has never been easier! From SEO metrics and social media performance to website bounce rates and more, easily turn raw data into a compelling, custom Google Analytics report for clients that reinforces your agency's ROI in minutes.

Explore All Available Google Analytics Metrics
- Active 1 Day Users
- Active 28 Day Users
- Active 7 Day Users
- Active Users
- Add To Carts
- Average Purchase Revenue
- Average Purchase Revenue Currency
- Average Purchase Revenue Per Paying User
- Average Purchase Revenue Per Paying User Currency
- Average Purchase Revenue Per User
- Average Purchase Revenue Per User Currency
- Average Revenue Per User
- Average Revenue Per User Currency
- Average Session Duration
- Bounce Rate
- Cart To View Rate
- Checkouts
- Conversions
- Crash Affected Users
- Crash Free Users Rate
- Date
- Dau Per Mau
- Dau Per Wau
- Ecommerce Purchases
- Engaged Sessions
- Engagement Rate
- Event Count
- Event Count Per User
- Event Value
- Events Per Session
- Field Status
- First Time Purchase Conversion Rate
- First Time Purchasers
- First Time Purchasers Per New User
- Item List Click Events
- Item List Click Through Rate
- Item List View Events
- Item Promotion Click Through Rate
- Item Revenue
- Item Revenue Currency
- Item View Events
- Items Added To Cart
- Items Checked Out
- Items Clicked In List
- Items Clicked In Promotion
- Items Purchased
- Items Viewed
- Items Viewed In List
- Items Viewed In Promotion
- New Users
- Promotion Clicks
- Promotion Views
- Publisher Ad Clicks
- Publisher Ad Impressions
- Purchase Revenue
- Purchase Revenue Currency
- Purchase To View Rate
- Purchaser Conversion Rate
- Screen Page Views
- Screen Page Views Per Session
- Screen Page Views Per User
- Scrolled Users
- Session Conversion Rate
- Sessions
- Sessions Per User
- Shipping Amount
- Shipping Amount Currency
- Tax Amount
- Tax Amount Currency
- Total Purchasers
- Total Revenue
- Total Revenue Currency
- Total Users
- Transactions
- Transactions Per Purchaser
- User Conversion Rate
- User Engagement Duration
- User Engagement Duration Per Session
- User Engagement Duration Per User
- Wau Per Mau

CREATE NEW REPORTS & DASHBOARDS IN MINUTES
Build GA Reports That Highlight Your Agency’s Impact
Experience the power of streamlined GA monitoring and management for your agency. Automatically connect your clients' Google Analytics data streams for real-time reports and data collection across more than 85 channels.
With a dynamic reporting interface, create custom reports or dashboards with live and historical data that provide a comprehensive view of your clients' key metrics and your agency’s marketing efforts.
Start with a report template or use the free-form report builder to pull together all your clients’ key GA metrics in seconds, any time you need to create a new report.

Organic, PPC, Email, Social, Display, and More
Easily Access Key Analytics for Every Traffic Channel
Whether you're using the pre-built GA reporting template or creating your own with the drag & drop editor, create custom reports using data directly from your client's Google Analytics account.
Add widgets to a Google Analytics dashboard to clearly demonstrate traffic acquisition, average engagement time, and conversions for each marketing channel. Use the traffic acquisition report to highlight the value your agency is generating from SEO, PPC, email campaigns, social channels, and more.

Location, Language, Age, Devices
Leverage GA Audience Data For Deeper Insights
Visitor demographics offer some surprising insights. Notice a high bounce rate for your client’s iPhone users? Their site might be in need of some reformatting for that device’s display. Easily share a quick reports snapshot and show clients that you're on the ball.
Is audience age skewing in a new direction? Boost engagement by tweaking site messaging accordingly. Leverage GA's audience data to optimize your clients' websites and marketing strategies. Create custom user reports with related insights, like rankings from Google Search Console and other marketing efforts.

Optimize Pages Based On Events & Conversions
Fine-tune Site Performance With Page-Level Data
Filter and review pages by GA performance metrics like user engagement, events, and conversions. Identify top-performing web pages and take note of low-performing pages for optimization and re-writes. Drill into all pages, landing pages, content groups, and more. Even create a custom user acquisition report, it's all up to you.
Use the landing pages report to identify the engagement rate, total users, conversions, and purchases to segment landing page data by top marketing objectives.
Quickly identify top-performing and underperforming pages based on engagement rate, conversions, and bounce trends.

DELIVER ENGAGEMENT INSIGHTS
Track the Engagement Signals That Show How Users Behave
Track core engagement metrics—like active users, engaged sessions, average engagement time, bounce rate, and conversions—directly inside client dashboards and reports.
Surface the metrics that matter most for each client, compare engagement trends over time, and connect user behavior to business outcomes. Clear engagement reporting helps clients understand not just how many users arrived—but what they did next.

MANAGE THE ENTIRE CUSTOMER FUNNEL
Use GA Events & Conversion Tracking to Monitor Customer Journeys
Elevate your agency's standard reports to deliver the results your clients care about. Arrange your GA reports to emphasize event tracking, user interactions, conversions, and revenue across the customer journey. Use the intuitive drag & drop report builder to customize your multichannel funnel reports and enhance them with data from various streams such as eCommerce, PPC, SEO, and more to fully demonstrate your agency’s value and ROI.

TRUSTED BY 7,000+ AGENCIES
Why Agencies Choose AgencyAnalytics for Google Analytics Client Reporting
Thousands of agencies trust AgencyAnalytics—rated 4.7 stars on G2—to simplify GA reporting, automate client communications, and scale effortlessly.
Here’s why they choose us:
Purpose-built for agencies: Manage every client’s Google Analytics data in one easy-to-use dashboard.
Automation that saves hours: Eliminate repetitive data work with scheduled reports and live dashboards that update automatically.
Full white-label control: Customize every dashboard and report to reflect your agency’s brand and professionalism.
AgencyAnalytics delivers reliable reporting tools that free your team to focus on what matters most—strategy and results.

Discover the white label reporting tool trusted by 7,000+ marketing agencies.


FAQs About Google Analytics Client Reporting for Marketing Agencies
Still have questions about Google Analytics reporting? You’re in the right place. Get clear, expert answers tailored to agencies managing client GA reporting and web performance.
Google’s native GA reports are designed for individual site owners—not for agencies managing dozens of clients at scale.
AgencyAnalytics transforms raw GA data into client-ready dashboards that are automated, branded, and built for collaboration. Deliver performance reports that combine analytics, goals, and commentary in one interface—without the manual exports or multi-account chaos of standard GA reporting.
The result: streamlined workflows, stronger client communication, and a level of polish that reinforces your agency’s expertise on every report.
Connecting GA to AgencyAnalytics takes just a few minutes—and once linked, your data flows automatically into dashboards and reports without any extra setup.
Each client’s property stays synced automatically, so you always have accurate engagement, conversion, and traffic metrics ready to share.
There’s no need for manual exports, spreadsheet merges, or repetitive data work—your team moves straight from setup to insight, saving hours every reporting cycle.
Agencies should monitor sessions, users, bounce rate (or engagement rate), average session duration, events, goal completions, and traffic sources (like paid search, organic traffic, referral, and social media). This set provides a rounded view of site performance, user behavior, and conversion effectiveness.
Here are the five most important Google Analytics reports your agency should use:
Acquisition – shows how users arrive at your site (channels, ad campaigns, search, referrals).
Audience – offers insights on who your visitors are, their device type, geography and behaviour.
Conversions – tracks goals, purchases and total revenue, linking marketing efforts to results.
Pages (Behaviour) – examines individual pages, bounce rate, events and how content performs.
Events – evaluates discrete actions (downloads, clicks, video plays) and helps refine content strategy and audience targeting.
GA3 (also called Universal Analytics) used a session‑based model, whereas GA4 uses an event‑based model which unifies web and app data under a single property. GA4 also supports advanced features like machine learning, cross‑device tracking and more detailed analytics data, while GA3 is deprecated and no longer processes new data.
Yes. Agencies use tools that connect directly to GA and automatically pull updated metrics for live dashboards and scheduled reports. This eliminates manual exports, saves time, and ensures accurate, timely insights for clients.
Yes. You can combine Google Analytics data with other marketing platform data — such as TikKok, Meta Ads, LinkedIn Ads, Google Search Console, and Google Ads — in the same report. This lets your team pull app data and web‑site metrics, merge ad campaigns and analytics tools into one unified dashboard, and track performance across multiple channels and marketing channels.
Agencies white label GA dashboards and reports on select AgencyAnalytics plans by adding client‑specific logos, colors, and custom URLs. With white‑label branding, agencies reinforce their brand and maintain professional consistency across client deliverables.
To create a custom GA report, agencies choose essential metrics (sessions, users, goals) and organize them using drag‑and‑drop widgets. They also integrate white label branding, add expert annotations through custom commentary, enable automated goal tracking, and display data via advanced data visualizations to make the report actionable and client-centered.
Agencies report on GA data across multiple clients using standardized dashboard templates. Once built, templates can be duplicated for each client property, with live GA data flowing automatically. This setup maintains consistency, streamlines workflows, and scales reporting without increasing resource demands as your client roster grows.
Automated Google Analytics reporting removes manual data work by using templates, scheduled exports and custom widgets to pull performance data automatically. Digital marketers receive in‑depth analysis faster, focus on insights rather than data aggregation, and deliver consistent client reporting. The use of advanced features and insights helps your agency make data‑driven decisions and scale across multiple clients without re‑building every report.
Using ready‑made templates and custom widgets in our analytics tool, agencies build a white‑labeled Google Analytics report in under 30 minutes. After initial setup, data pulls automatically each reporting period so your team focuses on interpreting performance data rather than assembling reports.
Everything your agency needs
Automated Reports

White Label Dashboard
Client & Staff Access

Connect Your Data
AI Powered
