Table of Contents
QUICK SUMMARY:
A board report is used to communicate results, align on strategy, and guide leadership-level decisions. It’s often prepared by mid-market to enterprise clients, who use it to update board members on performance and justify future investment. These reports may include overviews of marketing impact, spend efficiency, and strategic priorities. This article shares how agencies can support the process with clear data and the importance of using tools like AgencyAnalytics to share board-ready insights.
Board reports enable big decisions.
They help leadership teams see what’s working, what’s not, and where a business should go next. That includes a closer look at marketing, especially when there’s budget, growth targets, or a funding round on the line. If your agency works with mid-market or enterprise clients, there’s a higher chance of being pulled into this process. Maybe you’ll be called on to prep a few slides ahead of a quarterly board meeting, show how recent campaigns influenced a sales pipeline, or summarize results for an investor update.
That said, most marketing reports aren’t built for the boardroom–they include too much technical language and granular details. What the board actually wants is simple: A high-level view of how marketing is contributing to growth. This data is crucial information for your agency, too. The board has a direct say in budget approvals and vendor partnerships, which means they play a big role in whether your work continues to get funded.
Even if this item lands on your to-do list, you won’t always be in the room during the board reporting process. After all, there may be precautions to ensure data security. Board meetings often involve sensitive discussions around internal cash flow statements, financial reports, and corporate governance issues. Who knows—maybe they’re reviewing a sensitive HR board report about declining employee engagement, talent acquisition woes, and widespread burnout (yikes).
Extra noise aside, your data plays a key role in showing marketing value and helping leadership see the bigger picture. Feeling the pressure? Don’t worry–you don’t need unicorn board portal software to get the job done.
This guide explains what goes into a board-level marketing report, when these requests come up, and how to deliver insights that drive decisions. It also provides practical examples of such reports, key metrics to include, and tips on delivering results in a timely manner.
What Is a Board Report?
A board report is a written, high-level overview of an organization’s performance. It’s prepared ahead of a board meeting, giving members a chance to review performance, assess risks, and evaluate progress.
Depending on the organization, these reports might also focus on financials, operational objectives, marketing performance, or a mix of everything. Whether you’re preparing a standalone report or contributing a dedicated section, your agency’s job is the same: Deliver data that helps your client show the value of marketing initiatives.
That said, it isn’t about sharing day-to-day details, like individual email open rates or ad-level performance metrics. Instead, think outcome-focused. That could refer to lead growth, visibility, ROI… whatever the board cares about most.
Why Are Board Reports Important?
Board reports provide leadership teams with the clarity they need to make confident decisions. When done right, they connect the dots between strategy, execution, and outcomes. And that’s what keeps your agency’s work funded and valued.
More specifically, a comprehensive board report:
Shows how specific marketing campaigns contributed to quarterly or annual business objectives.
Provides decision-makers with the data they need to approve continued or increased investment in your agency’s work.
Shares issues like underperforming channels, overspend, or missed KPIs before they impact results.
Gives board committees enough context to greenlight strategic initiatives like new market exploration, product launches, or campaign pivots.
Links metrics like lead volume, CAC, or ROAS to broader outcomes like revenue growth or improved retention.
By delivering a solid board report, you’ll help your client to secure budget and show how marketing contributes to the company’s performance.
Board Reports vs. Board Meetings
It’s easy to mix these up, but they serve very different purposes. More specifically:
A board report is a document. It’s created ahead of time to give board members a clear view of what’s happening across the client’s business. It lays out key operational updates, financials, ROI-driven marketing metrics, and any major wins or challenges.
Think of it as the prep work–it’s typically read by board members prior to the meeting. On the other hand:
A board meeting is the actual discussion. It’s where decisions are made, questions get answered, and priorities get realigned. The report sets the agenda and gives structure to the conversation, but the meeting is where the action happens.
This distinction matters. Your agency’s job is to contribute solid insights for the board report, which ensures the client looks sharp in that room. That way, they’ll have the right data to make a strong case for continued marketing investment.
The Different Types of Board Reports
Not every board report is the same… and neither are the clients who request them.
The content, tone, and focus all depend on who’s in the room and what the business is trying to achieve. Understanding the context behind each request will lead to a well-written document with solid insights. For more context, here are common types of board reports and the best ways to present data.
Board Reports for Directors
This board deck supports internal oversight, planning, and budget reviews. Directors use them to assess whether marketing is contributing meaningfully to business strategy.
They’re typically presented by:
Mid-to-late stage B2B SaaS companies with a formal board structure.
National nonprofits preparing for board funding discussions.
Franchise or multi-location businesses reviewing regional performance.
When presenting information, focus on how marketing aligns with company-wide objectives, such as revenue, retention, and brand growth. Also, clearly outline budget utilization, progress toward business-related OKRs or KPIs, and updates on strategic initiatives (e.g., rebrands, market expansion).
Board Reports for Investors
Investor reports are all about growth, efficiency, and market traction. They’re designed to show that marketing spend is driving real, scalable results. These reports will typically be prepared by:
Startups (Seed to Series B) preparing for a funding round.
Fast-growing ecommerce brands tracking CAC, ROAS, and new customer growth.
Tech companies in fintech, healthtech, or AI using marketing results to support valuation and investor confidence.
Be sure to highlight marketing-led growth signals like customer acquisition trends, CAC efficiency, and brand reach. Also, frame performance in terms of market demand and return on capital, which is what investors care about most.
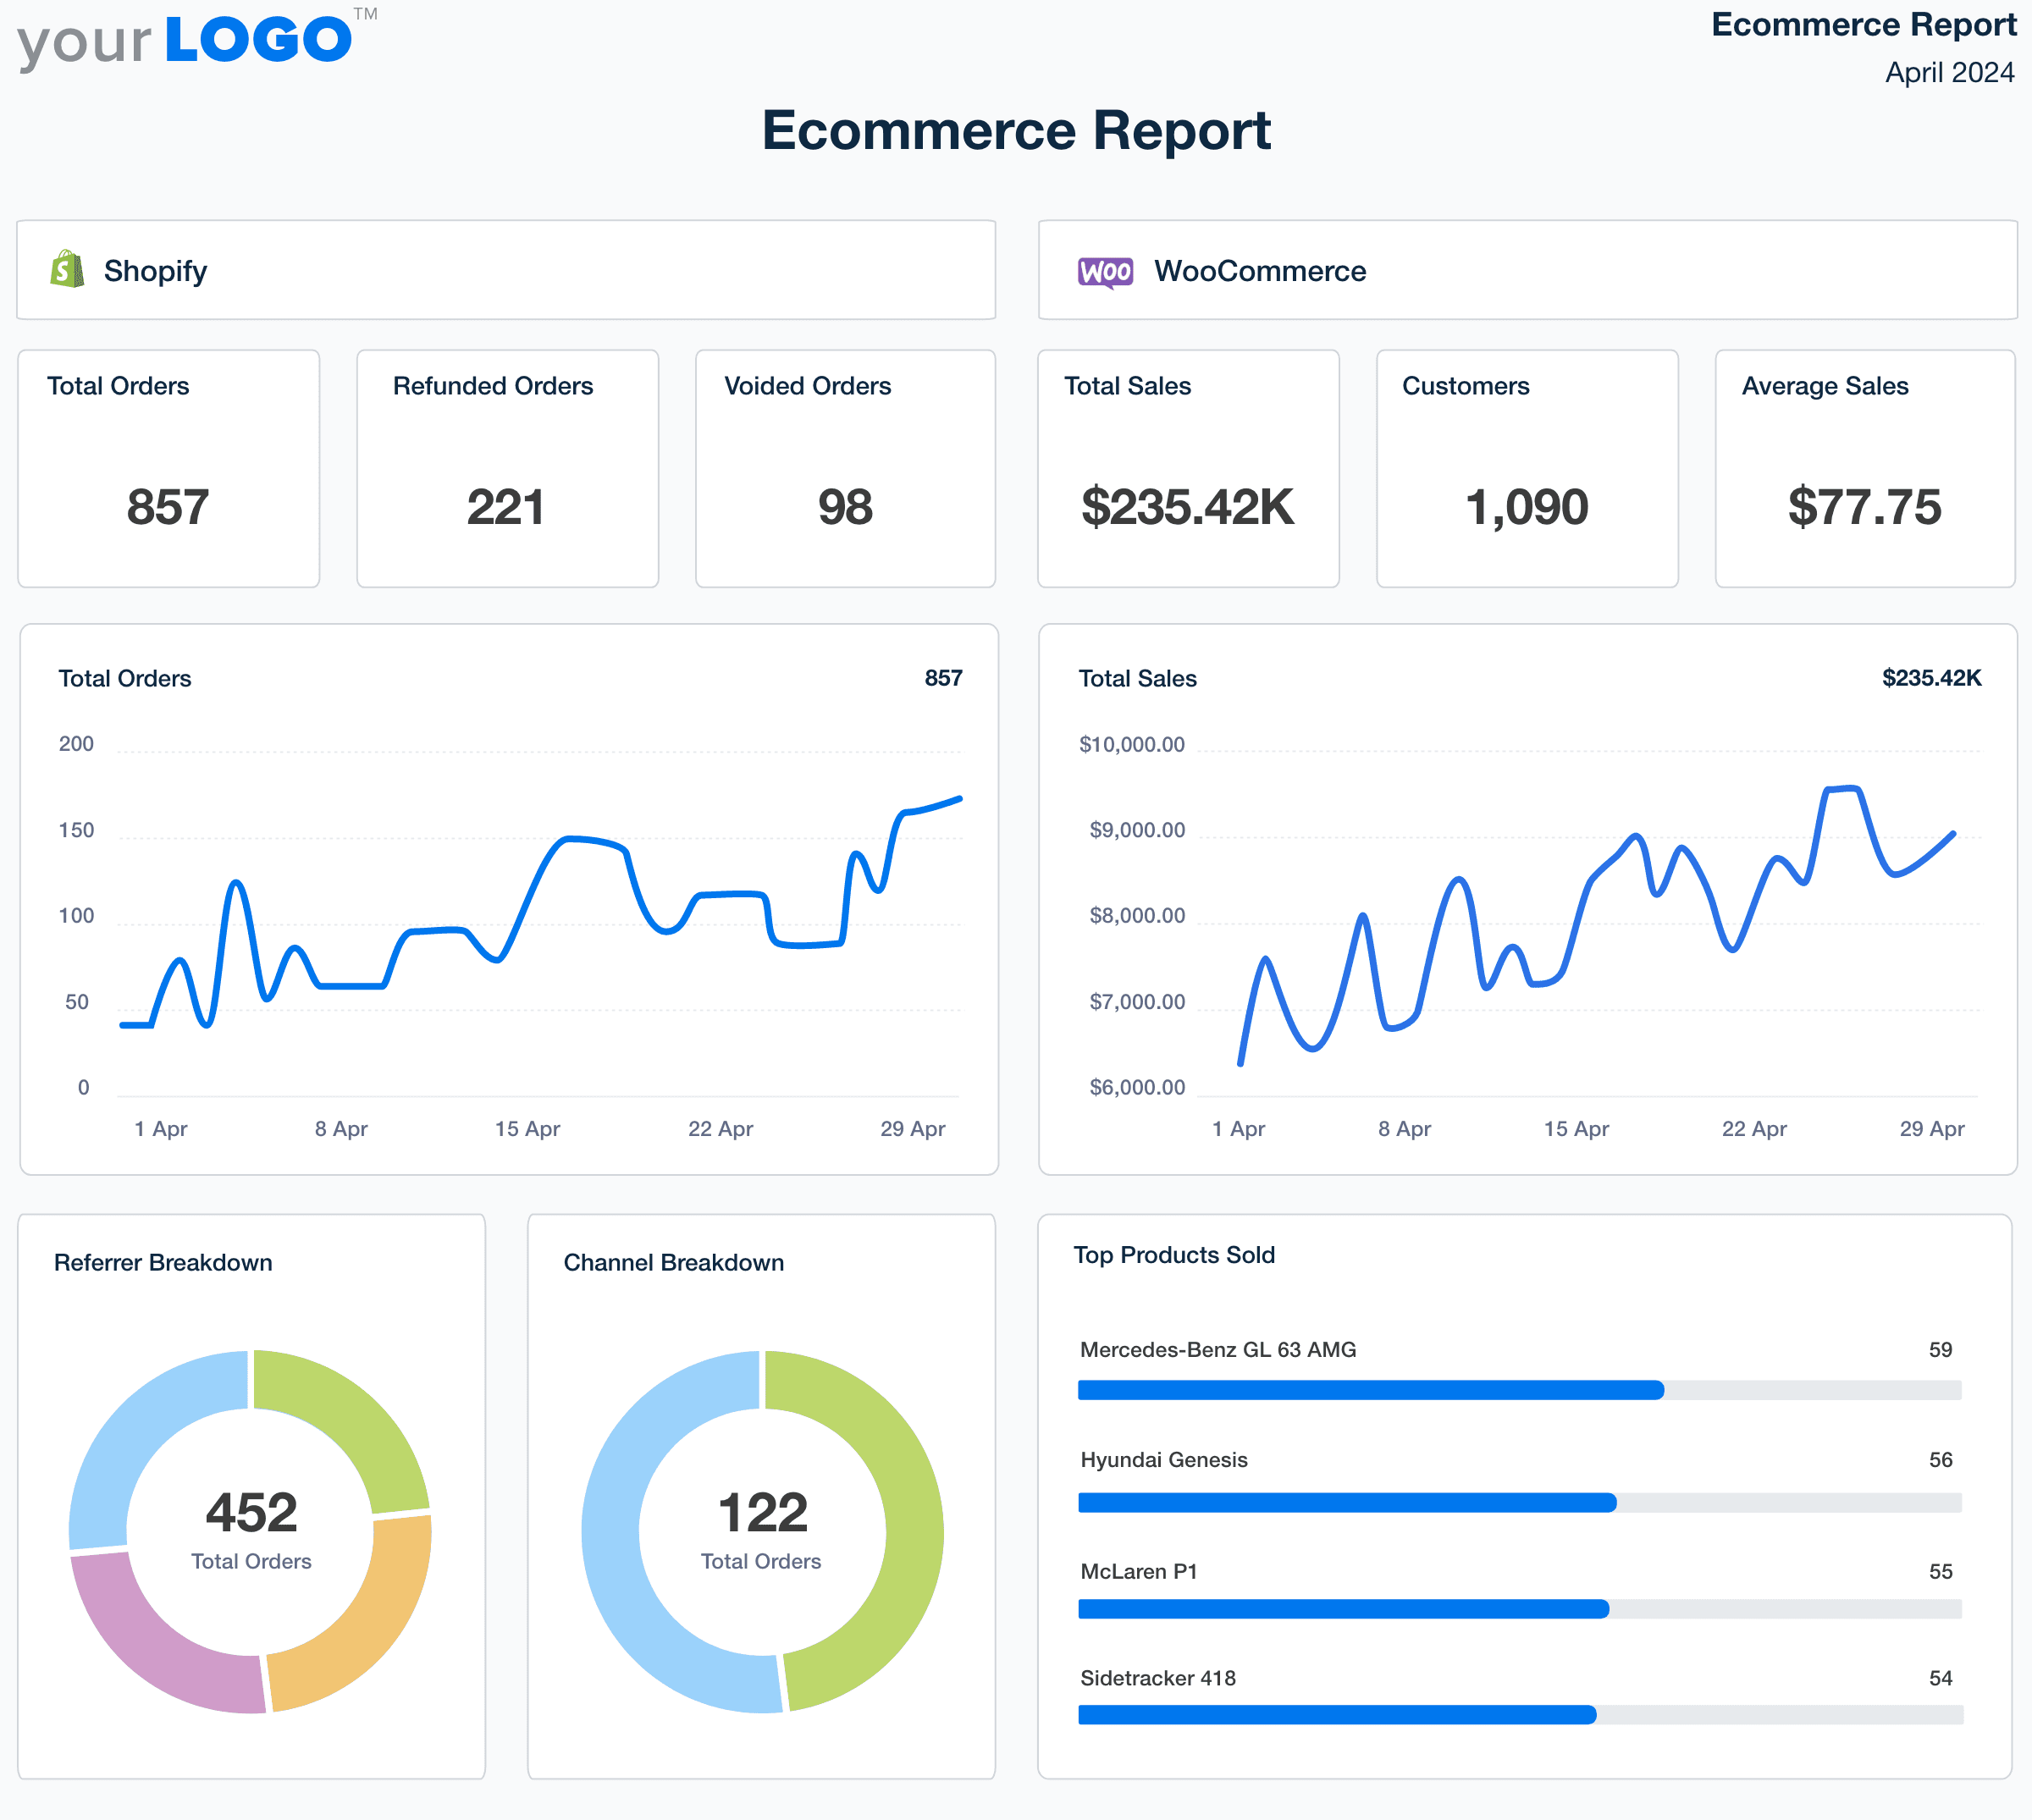
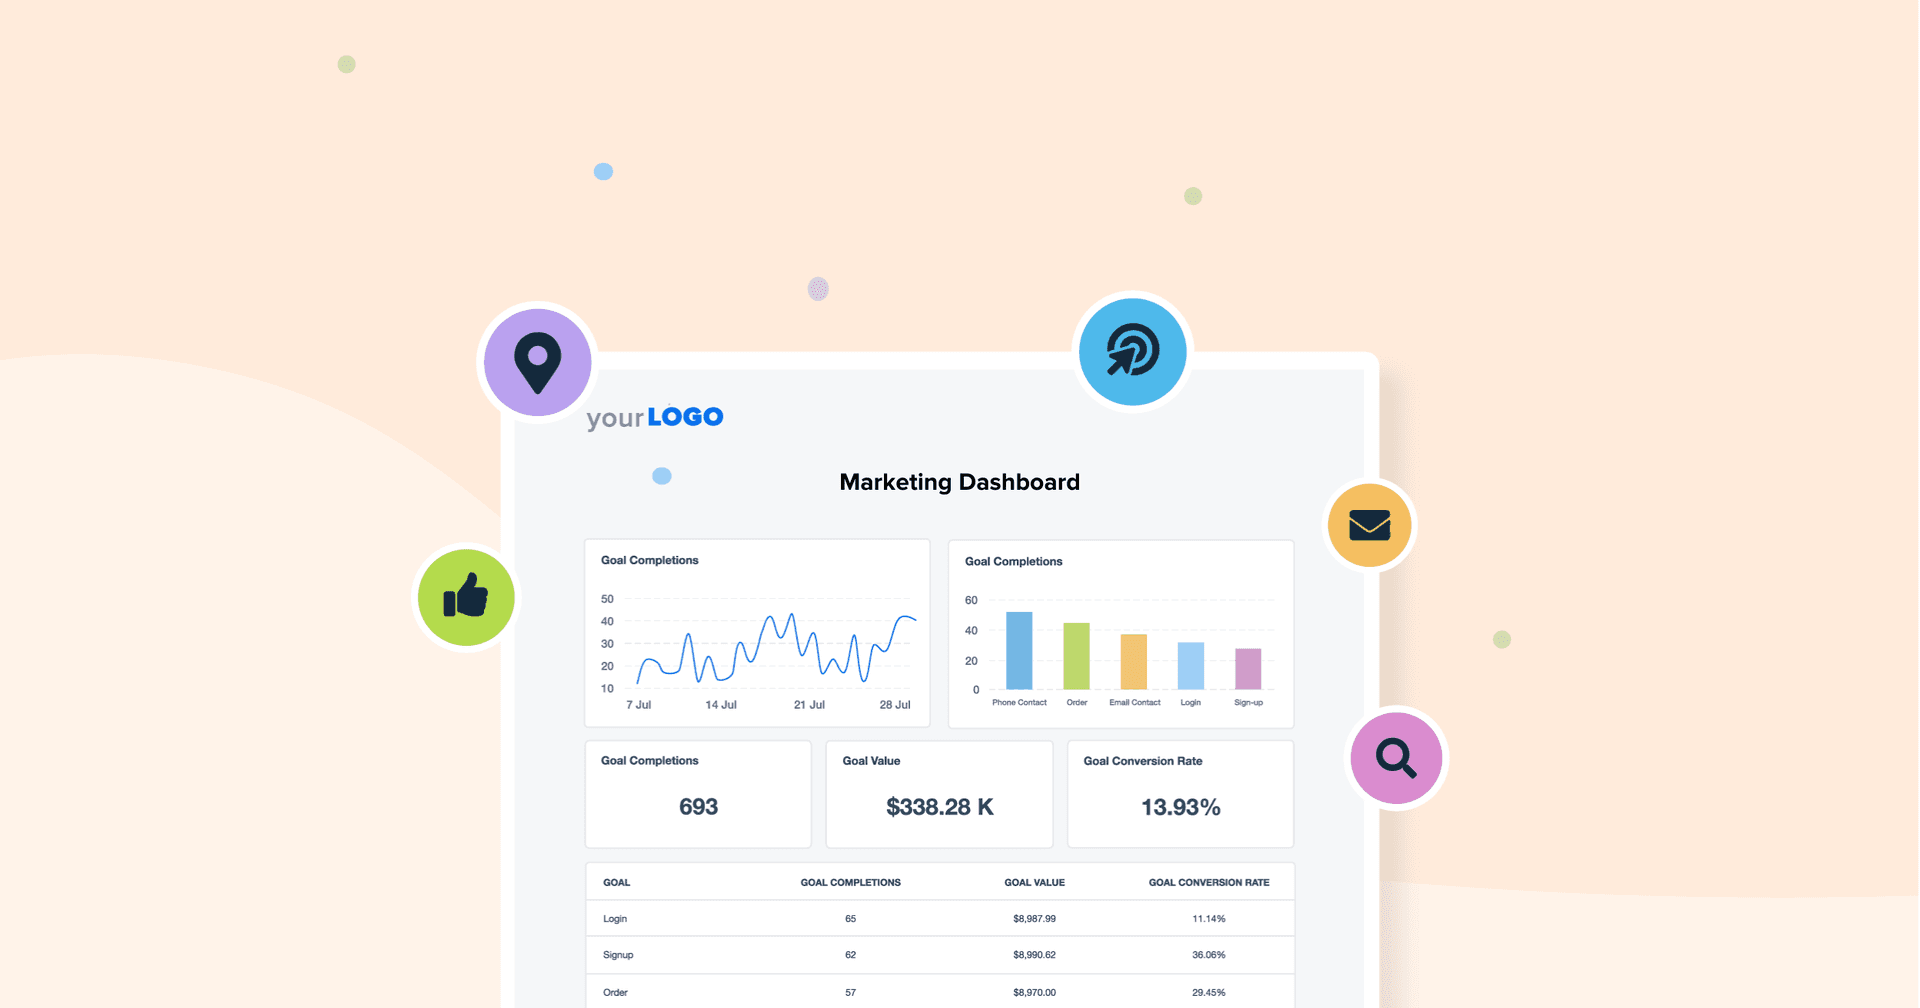
Creating board reports doesn’t have to take all day. Use a customizable template to share key insights, highlight organizational performance, and drive informed decision-making. Explore what AgencyAnalytics has to offer–try it free for 14 days.
Cross-Functional or Executive Reports
These reports help different departments stay aligned and make decisions together. They’re often shared during quarterly business reviews or go-to-market (GTM) planning meetings. Here are examples of clients that use this type of report:
Large B2B companies with sales, product, and marketing working closely.
Subscription-based businesses focused on keeping and growing customers.
Teams with GTM leads reviewing full-funnel performance.
These reports typically show how marketing is driving qualified leads, influencing pipeline, or improving conversion rates at key funnel stages.
They also highlight which channels, messages, or campaigns are resonating most. That way, sales and product teams can adjust GTM strategies, customer segmentation, or feature positioning.
Key Elements of a Board Report
A good board report needs more than clean copy and polished slides. It should be structured to tell a data-driven story about what’s happening, why it matters, and what comes next.
We always craft our data narratives based on what is most important to our clients. At different parts of clients' journeys, revenue growth is more important than cost savings, and vice versa. Ensuring you are on the same page is vital. This helps determine which data points are the most important.
Tom Gibson, Founder, Pilot
Here’s what a solid board report typically includes and tips for maximum impact.
Executive Summary
Start with a short and sharp executive summary. Remember–a busy board director may not read every single detail, so it’s important to share critical information right away. Here’s what to include during the board report writing process.
Section | Explanation |
|---|---|
Major Wins or Results From the Reporting Period | Summarize the most impactful outcomes right off the bat. These may include significant lead growth, a successful product launch, improved CAC, or a campaign that exceeded ROI targets. |
Key Decisions Needed or Challenges to Flag | Share any areas where leadership input is required. For example, this may include reallocating ad spend, pausing underperforming channels, or addressing brand perception issues. |
A Quick Snapshot of Financial and Performance Metrics | Include headline metrics like total spend vs. plan, MQL/SQL volume, ROAS, CAC trends, or pipeline contribution. These should tie back to business goals and be easy to digest at a glance. |
Keep it tight—no more than a few short paragraphs. Even if board members only read this section, they should still walk away with a solid understanding of where marketing stands.
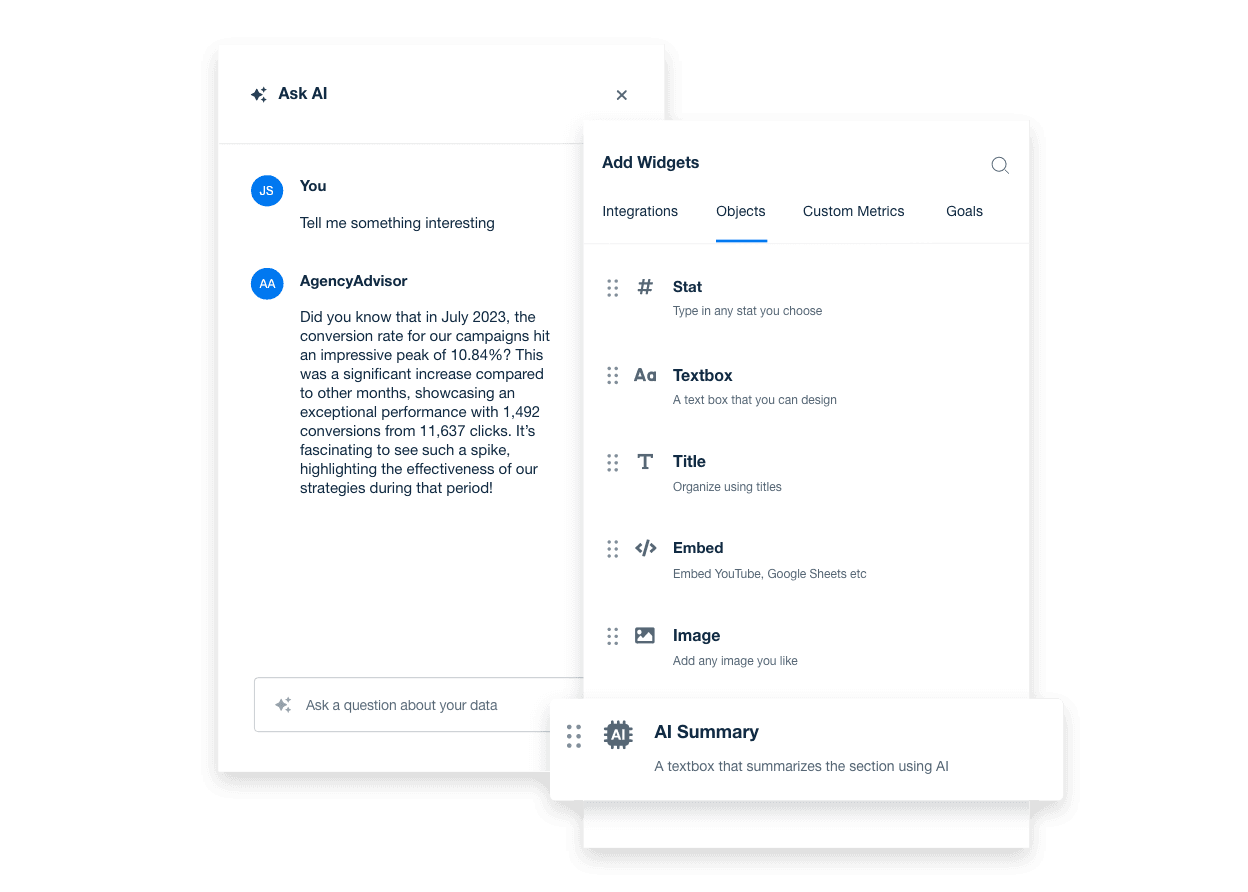
Need exec-level takeaways for CEO board reports? Use the Ask AI feature in AgencyAnalytics to generate useful insights and speed up report creation. Sign up for a free 14-day trial today.
Financial Overview
Effective board reports break down marketing spend and where the dollars went. Be sure to include:
Total Marketing Spend During the Reporting Period: Share a comprehensive overview broken down by channel, campaign type, or initiative.
Budget Variance: Highlight any over or under-spending and briefly explain the cause (e.g., campaign delays, or reallocated funds).
Cost-Efficiency Metrics: This includes metrics like CPL, CAC, ROAS, or CPA. Explicitly state how budget performance ties to pipeline or revenue.
Share a transparent financial review: Where the money went, what it achieved, and what should happen next.
KPIs and Performance
Financial health is one thing. However, it’s also important to answer this common question in any CEO report: Did marketing contribute to the organization’s strategic goals?
When sharing this essential information, highlight metrics that reflect progress toward business priorities—whether that’s lead generation, conversion rates, customer acquisition, or pipeline growth.
One of our company's core values is "We act with uncompromising honesty, even when no one is watching." KPIs are just an extension of living out our core values. They keep us accountable, provide the client with transparency into what work we deliver, and, most importantly, demonstrate that we are on track and achieving mutually agreed-upon goals. This is our agency's true north: Results for clients.
David Krauter, SEO Strategist, Websites That Sell
More specifically, any board report template should include:
Key Marketing KPIs: Include metrics that reflect core business objectives, such as MQLs, SQLs, conversion rates, or pipeline contribution. These show how marketing is driving demand and moving prospects through the funnel.
Notable Trends and Shifts: Call out meaningful patterns, such as rising organic traffic in a key market, a drop in paid social engagement, or improved conversion rates. To make data digestible, use graphs or other visual aids.
Campaign Performance vs. Benchmarks: Highlight how recent campaigns performed compared to previous periods and the organization’s objectives. This will identify which tactics are working and where results are falling short.
Challenges and Risks
Good reporting means sharing the full picture, not just what’s going well. This section highlights the obstacles, missed targets, and potential risks that could impact performance moving forward. Remember–transparency builds trust, especially when it’s paired with a strategic plan of action. Use this section to share:
Underperforming Areas or Missed Targets: Call out campaigns, channels, or metrics that fell short of expectations and why.
External Risks: Note any market shifts, regulatory changes, or platform updates that could impact performance.
Internal Blockers: Flag issues like resource constraints, delays in approvals, or anything else that slowed progress.
Be honest, but stay solutions-focused. For each challenge, include what actions are being taken to mitigate risk or get things back on track.
Best Practices for Writing a Board Report
Wondering if there’s a tried-and-true approach for preparing board reports?
Here’s a recap of how to prepare a board report that provides value and shows your agency’s attention to detail.
Best Practice | Why It Matters |
|---|---|
Start With the Headlines | Open each section with the most important result. For example, if a campaign drove a 30% increase in lead quality, state that clearly before explaining the “how.” |
Don’t Overload With Metrics | Limit reporting to KPIs that align with strategic goals, such as MQLs, CAC, ROAS, or pipeline contribution. Avoid platform-specific noise and vanity metrics. |
Explain the “Why” Behind Results | Give context for key changes. A spike in CAC or drop in conversions is more useful when paired with a reason, such as audience fatigue or messaging updates. |
Keep It Skimmable | Use short sections, bullets, and plain language. Make it easy for time-strapped board members to absorb the key takeaways quickly. |
Use Visuals Wisely | Visuals should simplify, not overwhelm. Include charts or tables only if they make the data easier to understand at a glance. |
Frame Challenges With Solutions | Be transparent about underperformance, but follow up with what’s being done to fix it. Show you’re already acting on the insight. |
A well-crafted report builds confidence at the top. When the board trusts the data, your client has a stronger case for continued investment in your agency’s services.
Board Report Examples
The type of board report a client needs depends heavily on their business model, growth stage, and industry. For more context, here’s what reporting looks like for different stakeholders.
Example 1: Marketing Performance Summary for Directors
Client Type: Mid-stage B2B SaaS company.
Goal: Show how marketing contributed to pipeline growth and brand visibility.
Executive Summary: In Q2, we focused on generating a qualified pipeline from mid-market SaaS buyers, particularly in healthcare IT and logistics. Shifting paid spend toward LinkedIn lead gen helped us exceed our MQL target by 18%. We also saw a 22% lift in qualified sales opportunities. This was driven mainly by companies looking to replace legacy software with more modern solutions.
Progress Against Marketing OKRs:
Objective: Increase MQL volume by 15% QoQ.
Achieved: +18% increase, driven by LinkedIn lead gen and gated content strategy.
Objective: Improve lead-to-opportunity conversion rate to 25%.
In Progress: Reached 22% this quarter; additional nurture sequences and updated scoring criteria planned for Q3.
Channel Performance Overview:
Paid Media: ROAS improved 16% QoQ due to reallocation of spend from Google Display to LinkedIn Sponsored Content.
Organic Search: Traffic grew 12%, with significant gains from thought leadership content and technical SEO improvements.
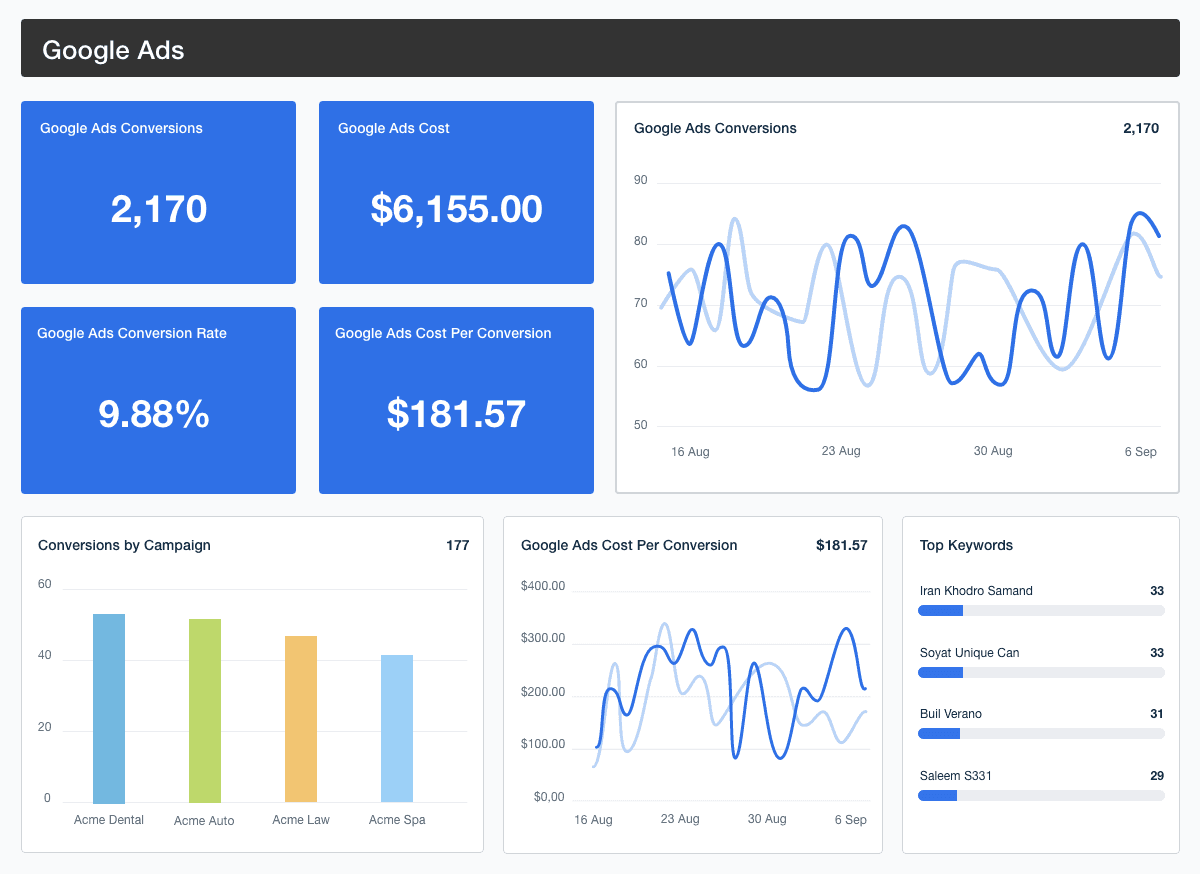
Keep an eye on real-time progress and help clients demonstrate strong operational performance. Use AgencyAnalytics to prepare your next board report–try it free for 14 days.
Key Wins & Learnings:
The “Modernize Your Tech Stack” webinar campaign outperformed expectations, generating 540 signups and 38 qualified sales meetings.
A/B testing of call-to-action copy improved landing page conversion rates by 21%.
Budget Utilization & Efficiency:
Total Spend: $248,000 this quarter (2% under plan).
Top Performing Channel by ROI: LinkedIn Ads (ROAS: 4.1).
Underperforming Spend: Display campaigns underdelivered; reduced investment mid-quarter.
Example 2: Investor Update Summary
Client Type: Ecommerce brand (wellness and personal care).
Goal: Show how marketing contributed to customer acquisition, return rates, and revenue growth.
Executive Summary: In Q2, we focused on scaling customer acquisition while improving return purchase rates. A shift in budget toward Meta and TikTok lead gen campaigns helped us exceed our new customer target by 14%.
We also focused on influencer content, which consistently outperformed branded creative in CTR and ROAS. We also launched branded search for the first time, capturing high-intent traffic and increasing conversion rates across product pages.
Progress Against Marketing Key Performance Indicators:
Objective: Increase new customer acquisition by 10%.
Achieved: +14% driven by paid social, influencer partnerships, and improved landing page speed.
Objective: Improve returning customer rate to 35%.
In Progress: Reached 33.6%; Q3 focus will be on loyalty content and segmented re-engagement emails.
Channel Performance Overview:
Paid Social: TikTok and Meta campaigns accounted for 64% of new customers. ROAS on TikTok improved 22% QoQ due to stronger creator partnerships.
Organic & SEO: Direct and branded search traffic increased by 31%, supported by PR mentions and video testimonials.
Budget Utilization & Efficiency:
Total Spend: $164,000 (1.5% under plan).
Top Performing Channel: TikTok Ads (ROAS: 4.1).
Underperforming Channel: YouTube drove impressions, but fewer than 100 conversions; paused for now.
Common Mistakes To Avoid
Even experienced marketers trip up when writing board reports. The stakes are high, and it’s easy to misfire if you don’t know what this audience needs. Here are a few hiccups that often happen and how to prevent them.
Common Mistake | Why It Matters |
|---|---|
Burying the Lead | Don’t make the board dig for the point. Start with what matters most—big wins, key risks, and urgent decisions. |
Too Much Detail | A detailed campaign recap might be useful internally, but not for many boards. Focus on outcomes, impact, and what needs critical attention. |
No Context for the Numbers | Metrics are meaningless without benchmarks or comparisons. Always show how results compare to previous periods or planned targets. |
Skipping the Risks | It’s tempting to only highlight achievements. However, share any challenges and show how you’re addressing them. |
Overdesigning the Report | Flashy formatting or cluttered charts are distracting. Keep it clean, consistent, and easy to scan. |
By avoiding these missteps, you’ll deliver insights that build trust, drive decisions, and protect marketing’s share of the budget.
Final Thoughts
When marketing performance reaches the boardroom, how it’s framed makes all the difference.
Whether your client is a non-profit organization or an investor-fueled ecommerce company, the goal remains the same: Showing how marketing drives measurable growth. Let’s be real, though–creating reports sometimes feels tedious and time-consuming. That said, it’s still a must-have piece of the puzzle, especially when there are different stakeholders involved.
Instead of doing everything by hand, invest in a tool that does the heavy lifting for you. With AgencyAnalytics, it’s easy to:
Access pre-built report templates that are fully customizable and professionally designed–even add your logo and brand colors!
Consolidate insights from 80+ platforms, including Google Ads, Facebook, Shopify, and more.
Share reliable industry benchmarks that show how marketing results compare on a macro level.
Generate AI-powered insights specific to your client’s data, which speeds up the entire reporting process.
Give your clients what they need to win in the boardroom, all without excessive manual work. Ready to see what it’s all about? Use AgencyAnalytics to report on key initiatives–it’s free for 14 days.

Written by
Faryal Khan is a multidisciplinary creative with 10+ years of experience in marketing and communications. Drawing on her background in statistics and psychology, she fuses storytelling with data to craft narratives that both inform and inspire.
Read more posts by Faryal KhanSee how 7,000+ marketing agencies help clients win
Free 14-day trial. No credit card required.


