Table of Contents
QUICK SUMMARY:
This article highlights 12 innovative ways to embed widgets in AgencyAnalytics reports, enhancing interactivity and engagement. From embedding full web pages to integrating real-time data, learn how to enhance transparency, showcase your agency's value, and strengthen client relationships with dynamic and actionable insights.
The ability to deliver clear, comprehensive, and visually engaging reports is what sets the best agencies apart. AgencyAnalytics is here to elevate your reporting game, turning every client interaction into a showcase of your agency's value and insight.
With AgencyAnalytics, dynamic visuals transform generic data presentations into personalized client reports that demonstrate the success of a social media campaign, a client’s return on ad spend, or their growth in web traffic.
But it’s not just about making your dashboards and reports look good; it’s about making them even more engaging and actionable.
Beyond the 80+ software integrations baked into AgencyAnalytics’ platform, embedding just about any other type of content—from Google Sheets to live social media insights—provides additional transparency and fosters trust with your clients.
With this added value, each report becomes a strategic asset, helping you underline the effectiveness of your agency and the thought behind your decisions, increasing the potential to retain and upsell clients.
Let’s take a look at how these embeddable widgets work, how to import a widget code from just about any website, and how to create an even more captivating user experience for your clients.
How Embedding Widgets Helps Customize Agency Reporting
In a competitive environment like agency marketing, customization is essential for standing out.
AgencyAnalytics’ “embed widget” feature empowers your agency with the flexibility to incorporate almost any online content into your dashboards and reports, allowing you to dig even deeper and offering your agency a canvas for creative expression.
I love that you can make the reports and dashboard as personalized as you want. This allows us to include specific widgets in specific client reports in seconds. The customizability of the tool is excellent!
Joshua George, Founder, ClickSlice
Adding embedded content with iframe coding means that almost any website or tool that permits embedding code can be integrated directly into your reports.
From real-time social media feeds to interactive graphs from Google Data Studio, you’ll wow clients by going even further than just displaying campaign data.
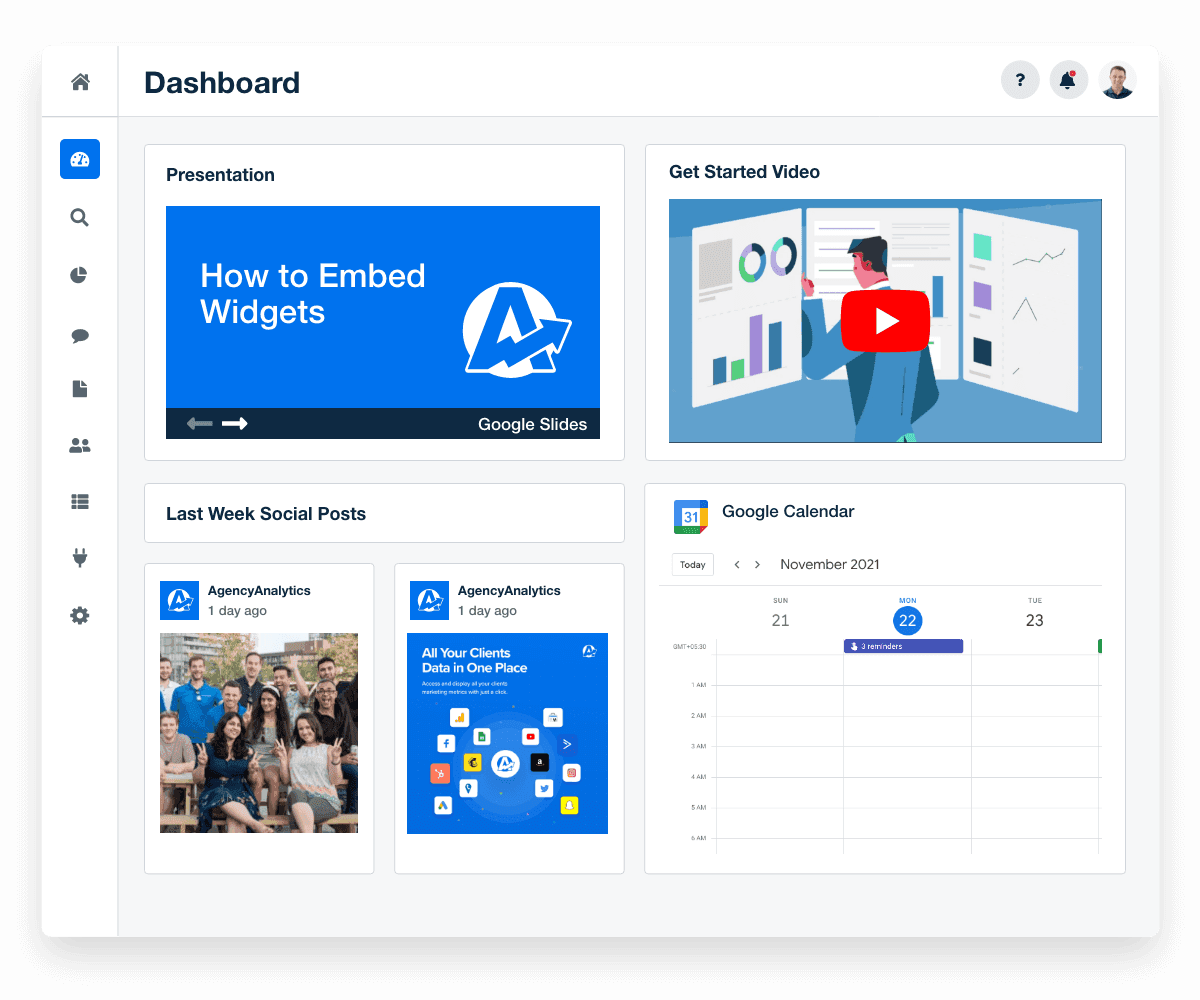
Here’s how embedding widgets elevates your reporting:
Improve User Engagement: Replace static spreadsheets with interactive reports that captivate clients and invite them to explore data at their own pace.
Showcase Value: Demonstrate the impact of your marketing strategies through live data visualizations, making it clear for clients to see the return on their investment.
Enhanced Transparency: Provide direct access to data to foster a transparent relationship with your clients. Showcase your agency's commitment to openness and honesty in every campaign.
Retention and Support: Use reports as tools for both marketing and customer support, keeping clients engaged, informed, and in touch with your team to enhance client retention and satisfaction.
Opportunities for Upselling: Richer, more detailed reports highlight additional areas where your agency adds value, paving the way for upselling services and expanding client accounts.
By leveraging the power of embeddable widgets, AgencyAnalytics helps you craft informative reports integral to your client relationship management and business growth strategies.
Impress clients and save hours with custom, automated reporting.
Join 7,000+ agencies that create reports in minutes instead of hours using AgencyAnalytics. Get started for free. No credit card required.
How To Embed a Custom Widget in AgencyAnalytics
With our embed widgets, you have the capability to incorporate a wide range of online content directly into your AgencyAnalytics dashboards and web reports—without needing to learn HTML code. As long as the external platform supports embedding, you can seamlessly integrate it into your reporting environment through an iframe.
This versatility allows you to enhance your reports with web pages, Google Docs, Google Data Studio reports, slideshows, calendars, Spotify players, Loom videos, YouTube videos, social media posts, and much more, providing a rich, interactive experience for your clients.
Adding an Embed Widget by URL
To add a new widget to your custom dashboard or report, select "Objects" from the menu. Next, simply drag and drop the "Embed" option into the desired area of your dashboard or report.

Next, click the ellipsis "..." located at the top right-hand corner of the embed widget to enter the URL you wish to embed.
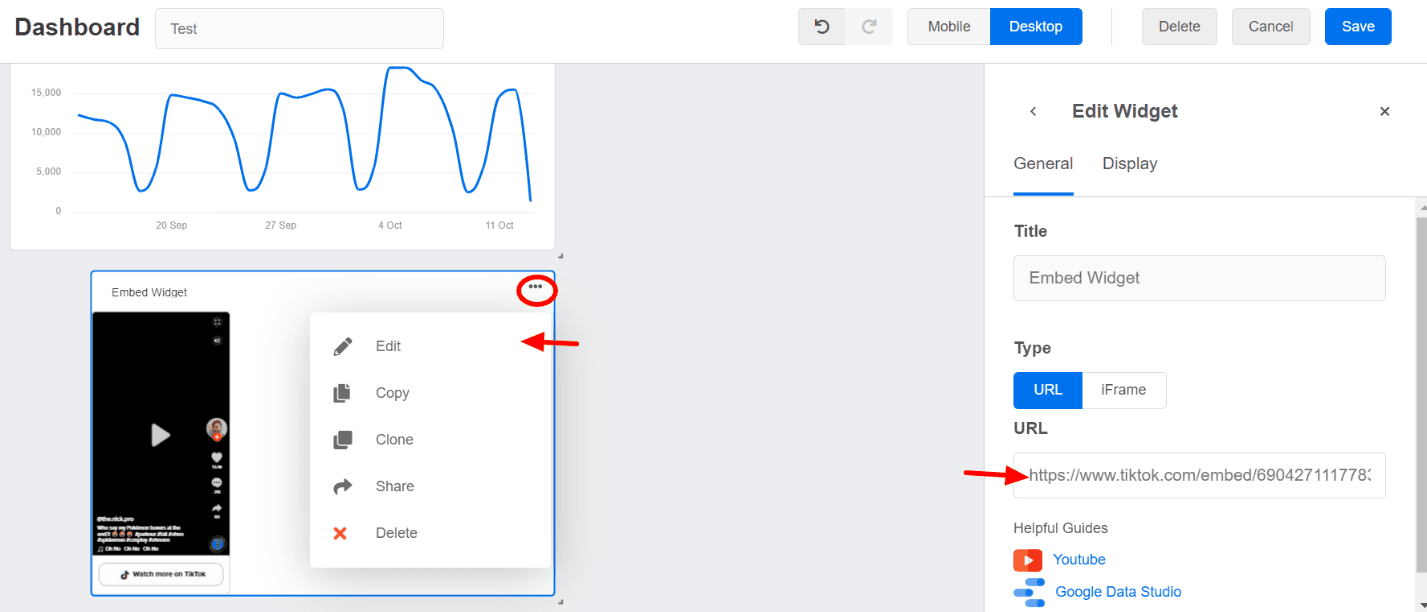
Ensure you only enter a fully qualified URL when you embed content.
Once you have made your changes, click the "Save" button at the top right to update your dashboard or report.
Adding an Embed Widget With iFrame
Different website platforms provide the full iframe code for the content you wish to embed.
First, you'll need to locate the iframe code provided by the platform hosting the content you want to embed. Here’s a general guide on how to find an iframe code:
1. Identify the Content: Determine which content you want to embed in your AgencyAnalytics dashboard or report. This could be a video, a social media post, a graph, or any interactive element that supports embedding.
2. Look for Embed Options: Navigate to the content on its original platform. Often, there is an 'embed' option associated with shareable online content. For instance, on YouTube, you would click the 'Share' button beneath the video and then select 'Embed' to view the iframe code.
3. Copy the iframe Code: The platform will typically display the iframe code in a text box. This code will look something like this: <iframe src="URL" width="WIDTH" height="HEIGHT"></iframe>
You only need the URL contained after the “iframe src=” html tags.
4. Paste the URL in AgencyAnalytics: Once you have the URL, go to your AgencyAnalytics dashboard or report where you want to add the widget. Paste the copied URL into the widget’s settings to start displaying the content.
5. Check for Permissions: Ensure that the platform from which you are taking the iframe code allows its content to be displayed on other sites. Some platforms have restrictions that prevent their content from being embedded on external sites.
6. Adjust Settings if Necessary: Some embedded content has adjustable parameters like width, height, autoplay, loop, etc. Customize these parameters to fit the layout and design of your AgencyAnalytics report or dashboard.
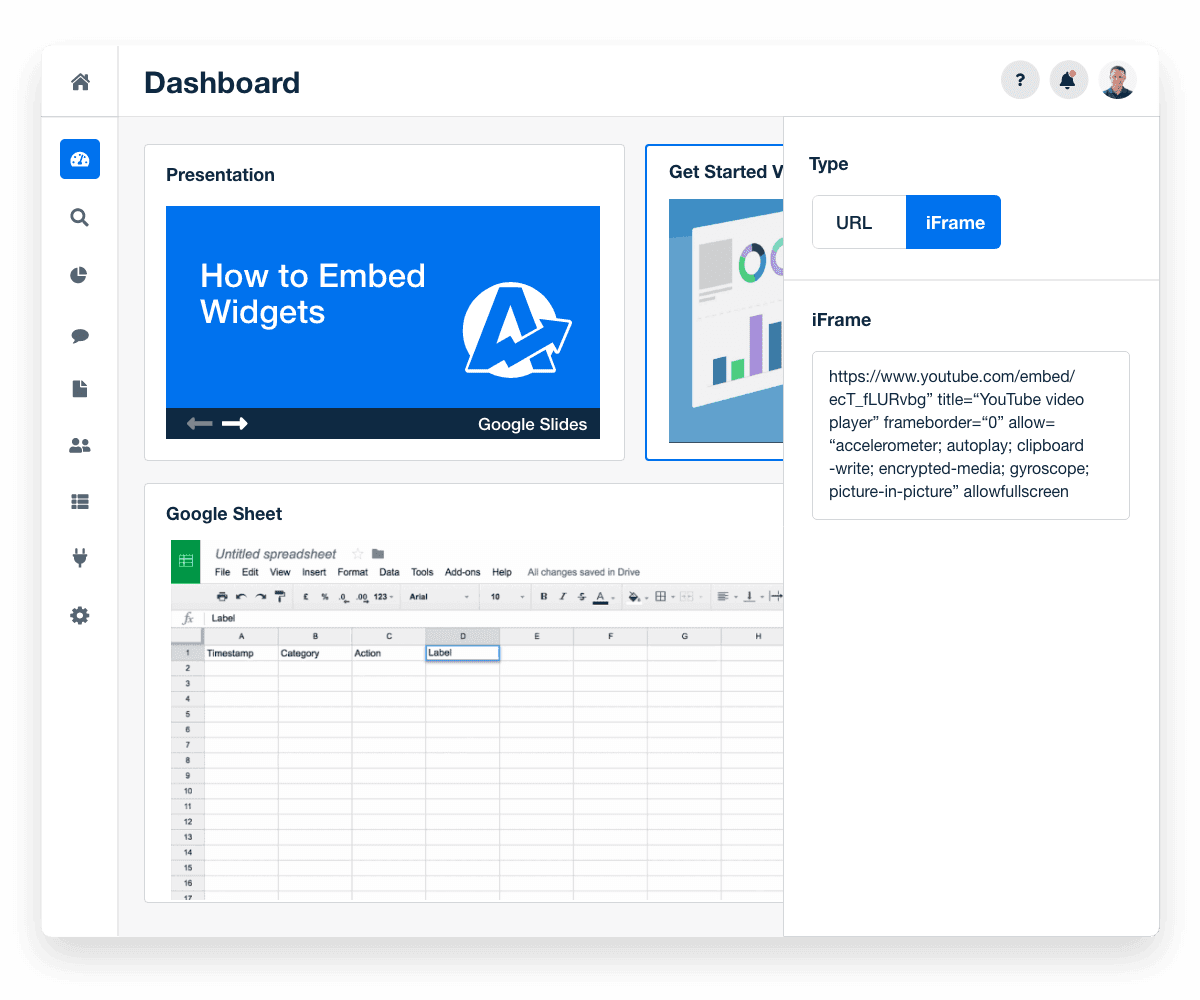
To maintain a cleaner look, you can also remove the title bar by clearing the "Title" field in the widget settings.
💡Please be aware that some platforms or websites restrict their content from being displayed in an iframe. Additionally, it's important to note that embedded content cannot be exported in a PDF format.
12 Ways Agencies Use Embeddable Widgets to Enhance Client Reporting
The embed widget feature from AgencyAnalytics allows agencies to be as creative as they please when creating reports for clients. Need some inspo? Let’s take a look at how real agencies just like yours are leveraging this exciting feature to capture client interest and deliver insights in new and innovative ways.
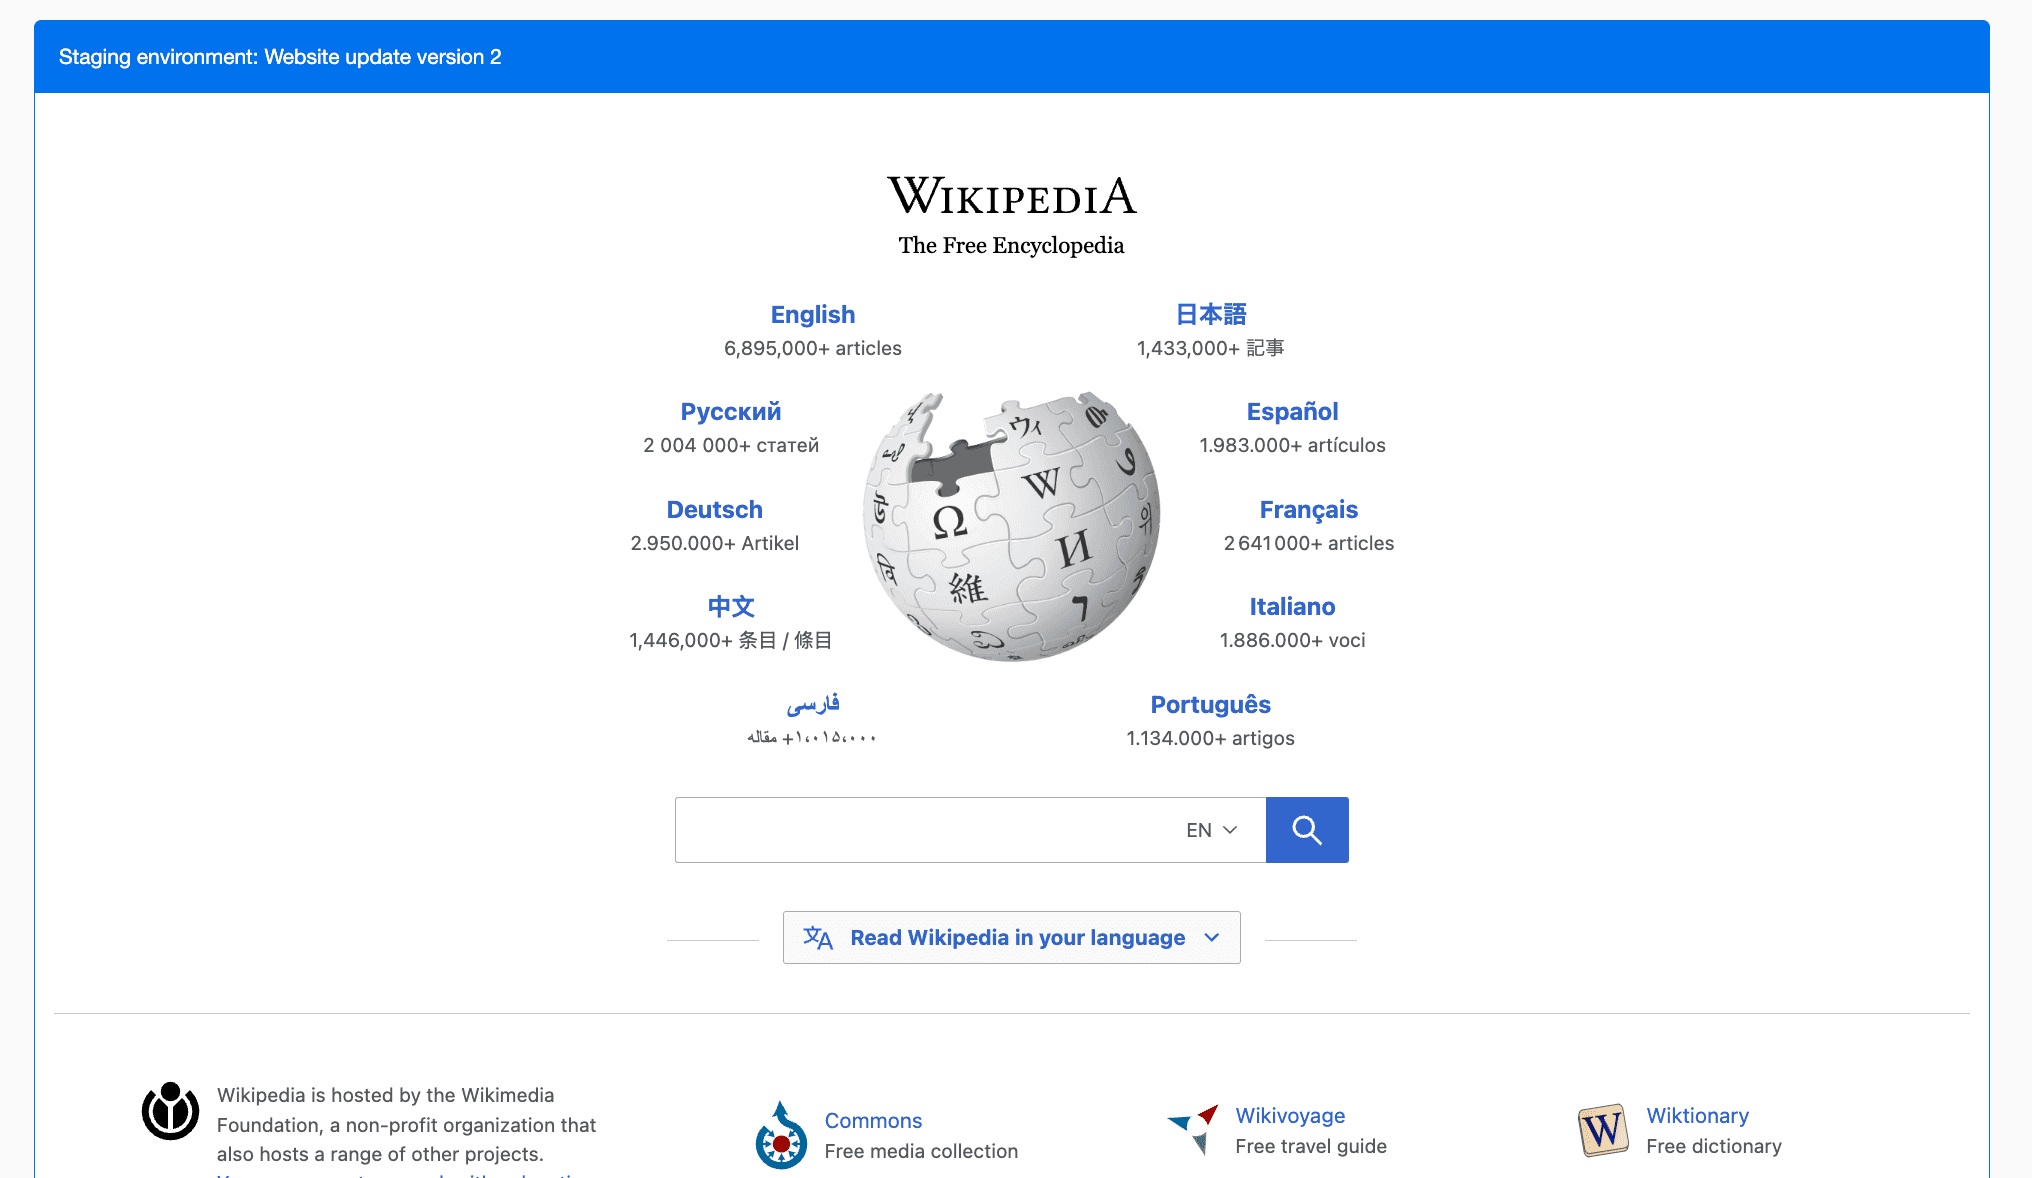
1. Full Websites
Embed an entire functional web page to provide comprehensive views of campaign landing pages or related content. This allows clients to view real-time, live updates from websites directly in their reports, offering a seamless experience without navigating away.
2. Landing Pages
In the same vein as web pages, showcase specific marketing campaign landing pages directly within the report. This enables clients to see the actual pages visitors interact with, facilitating discussions about page performance and potential improvements.
3. Third-Party Dashboards
Integrate dashboards from platforms like Google Analytics, Google Data Studio, SEMrush, or custom dashboards that provide additional analytics. This centralizes data from various platforms for a holistic view, enhancing decision-making processes.
4. Google Sheets
Embed Google Sheets to display real-time updates to data being tracked live. You may either embed entire sheets or graphs created within Google Sheets. This way, clients can see live data feeds at any time.
5. Ad Creative
Show actual ad creative used in campaigns. This offers a visual reference for discussions about creative performance and provides transparency in advertising efforts.
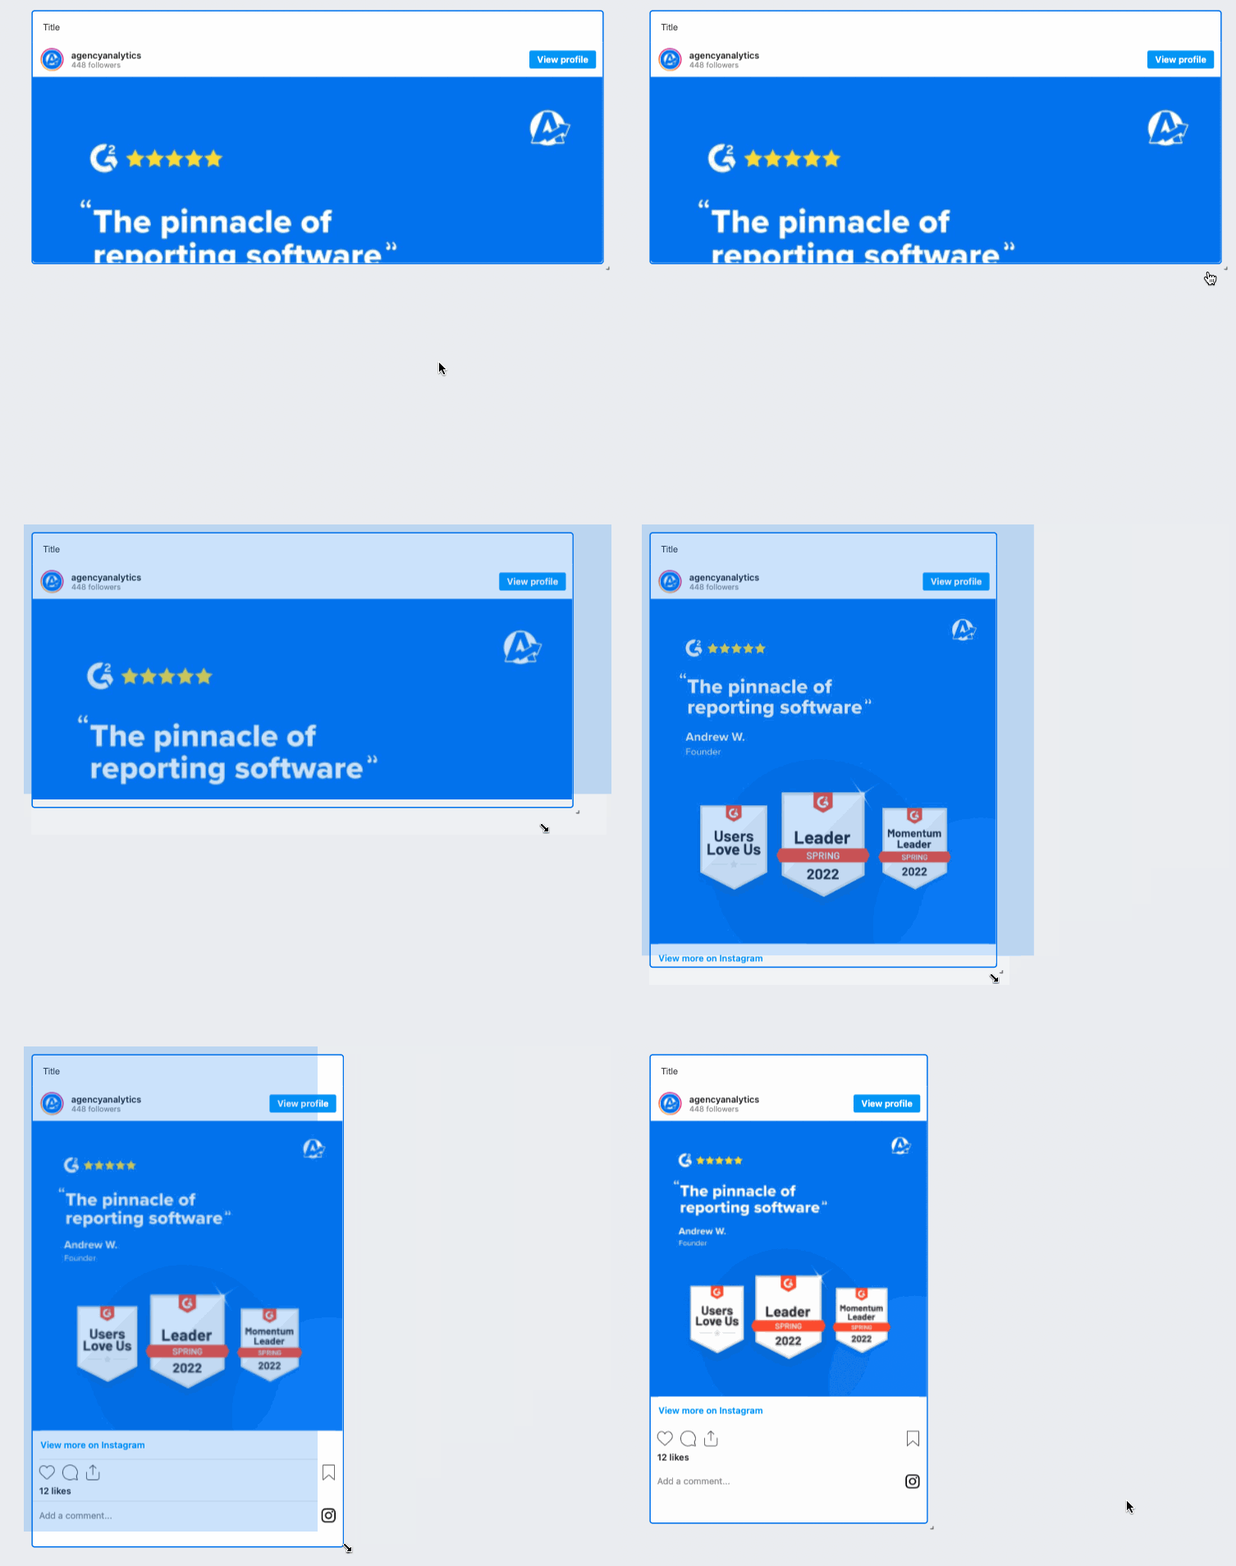
6. Social Media Posts
Embed posts from platforms like Facebook, X (Twitter), or Instagram directly into reports. This allows clients to view real-time social engagement and reactions, highlighting the impact of social media strategies.
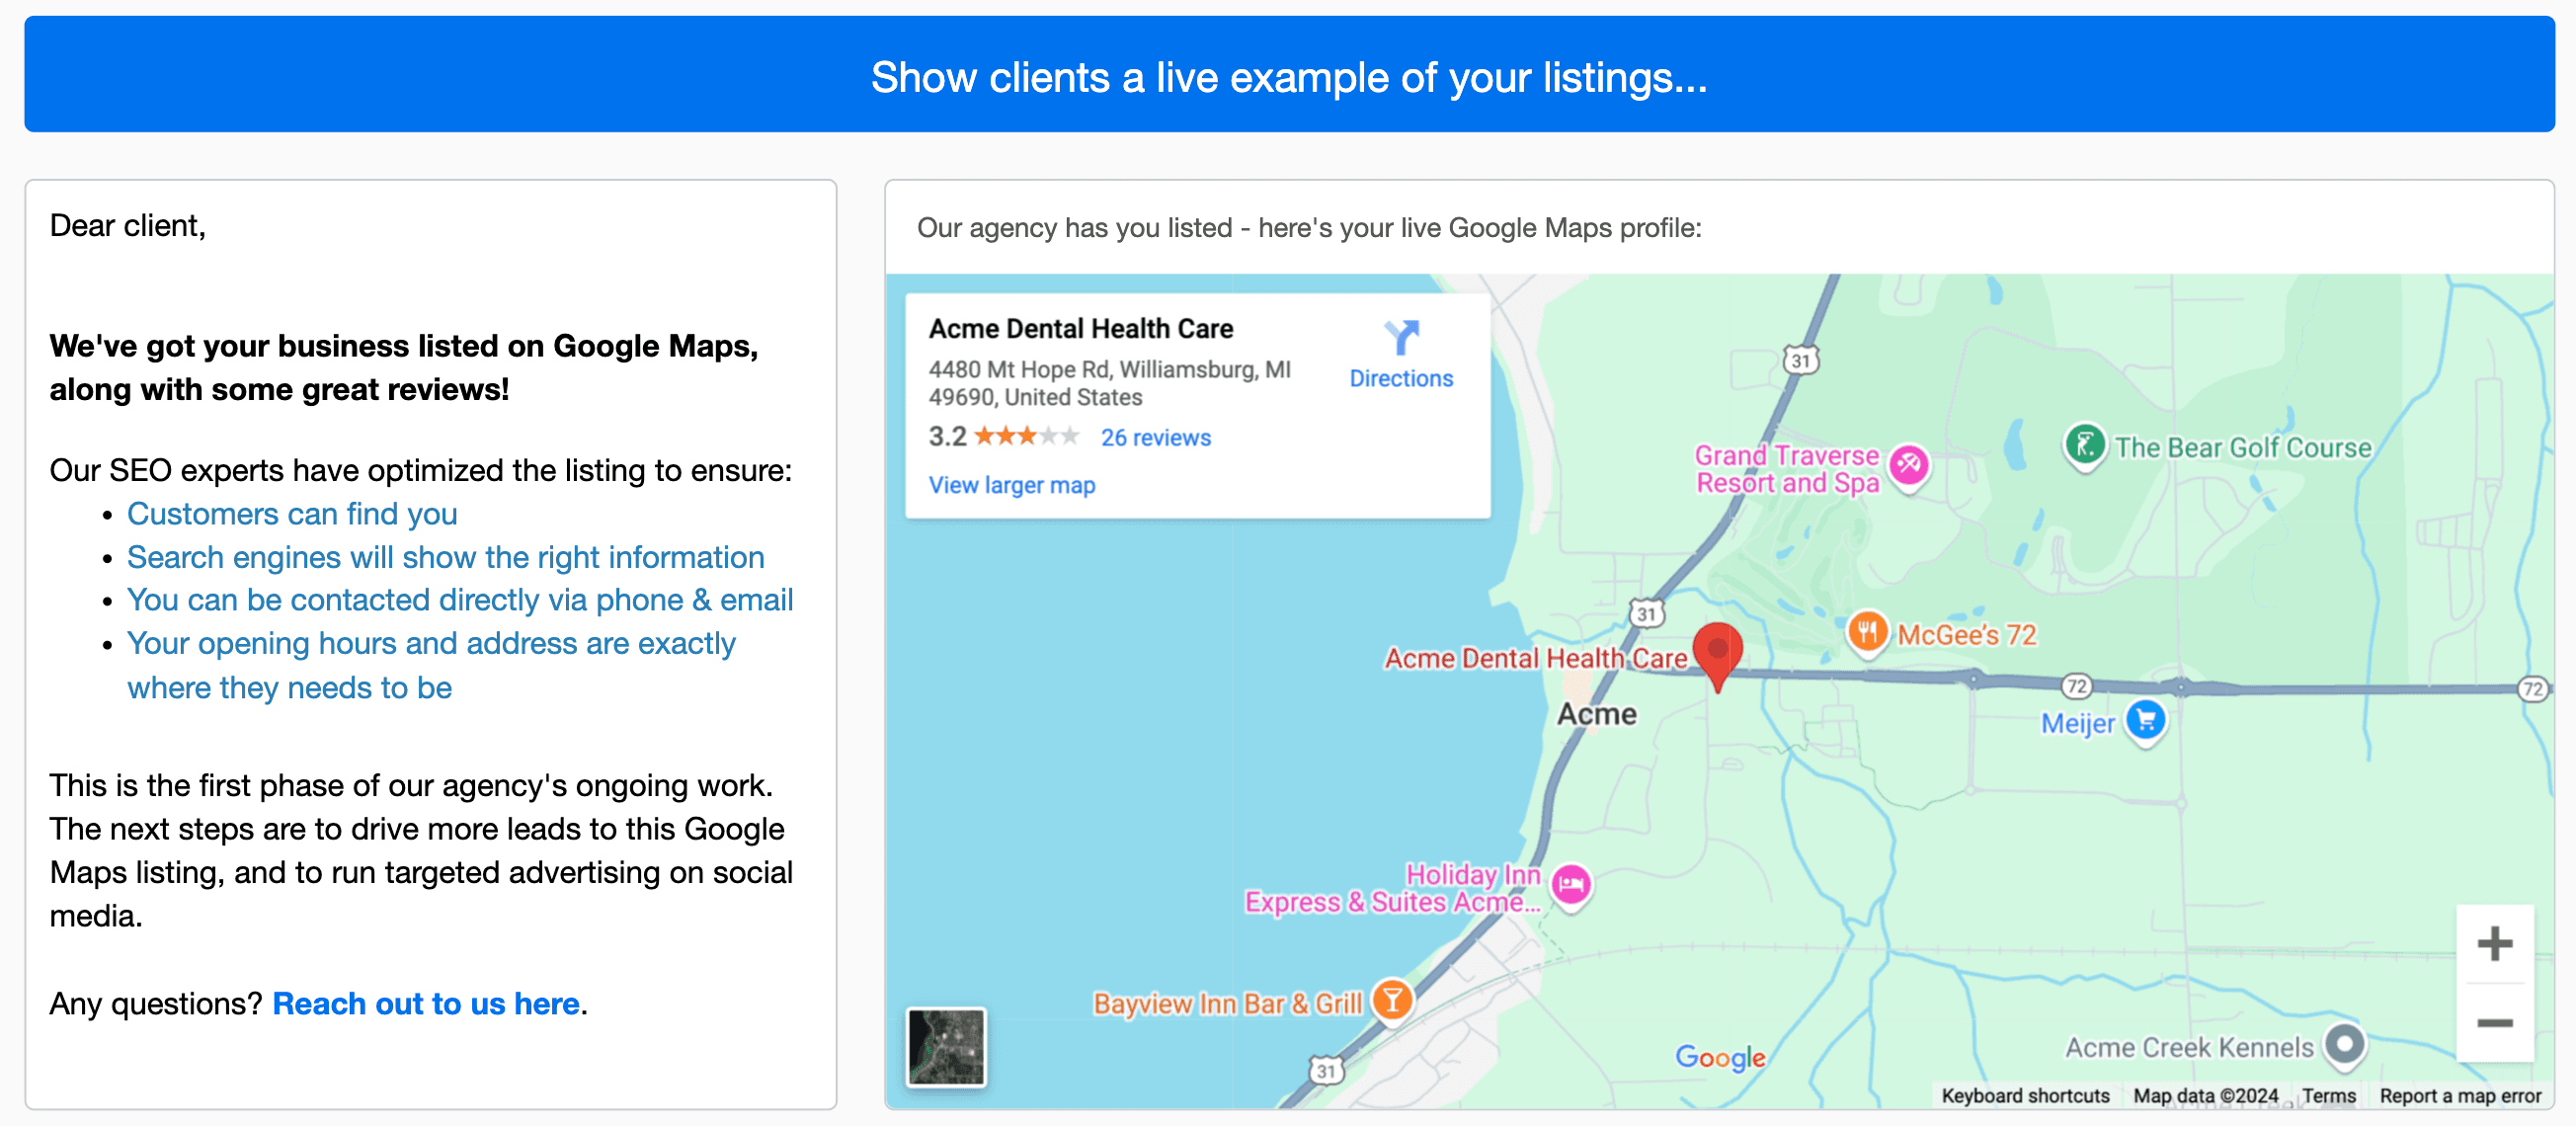
7. Local or Map Listings
Embed maps to show local listings or geographic data related to marketing campaigns. This enhances local SEO discussions and allows clients to visualize the geographical spread of their campaigns.
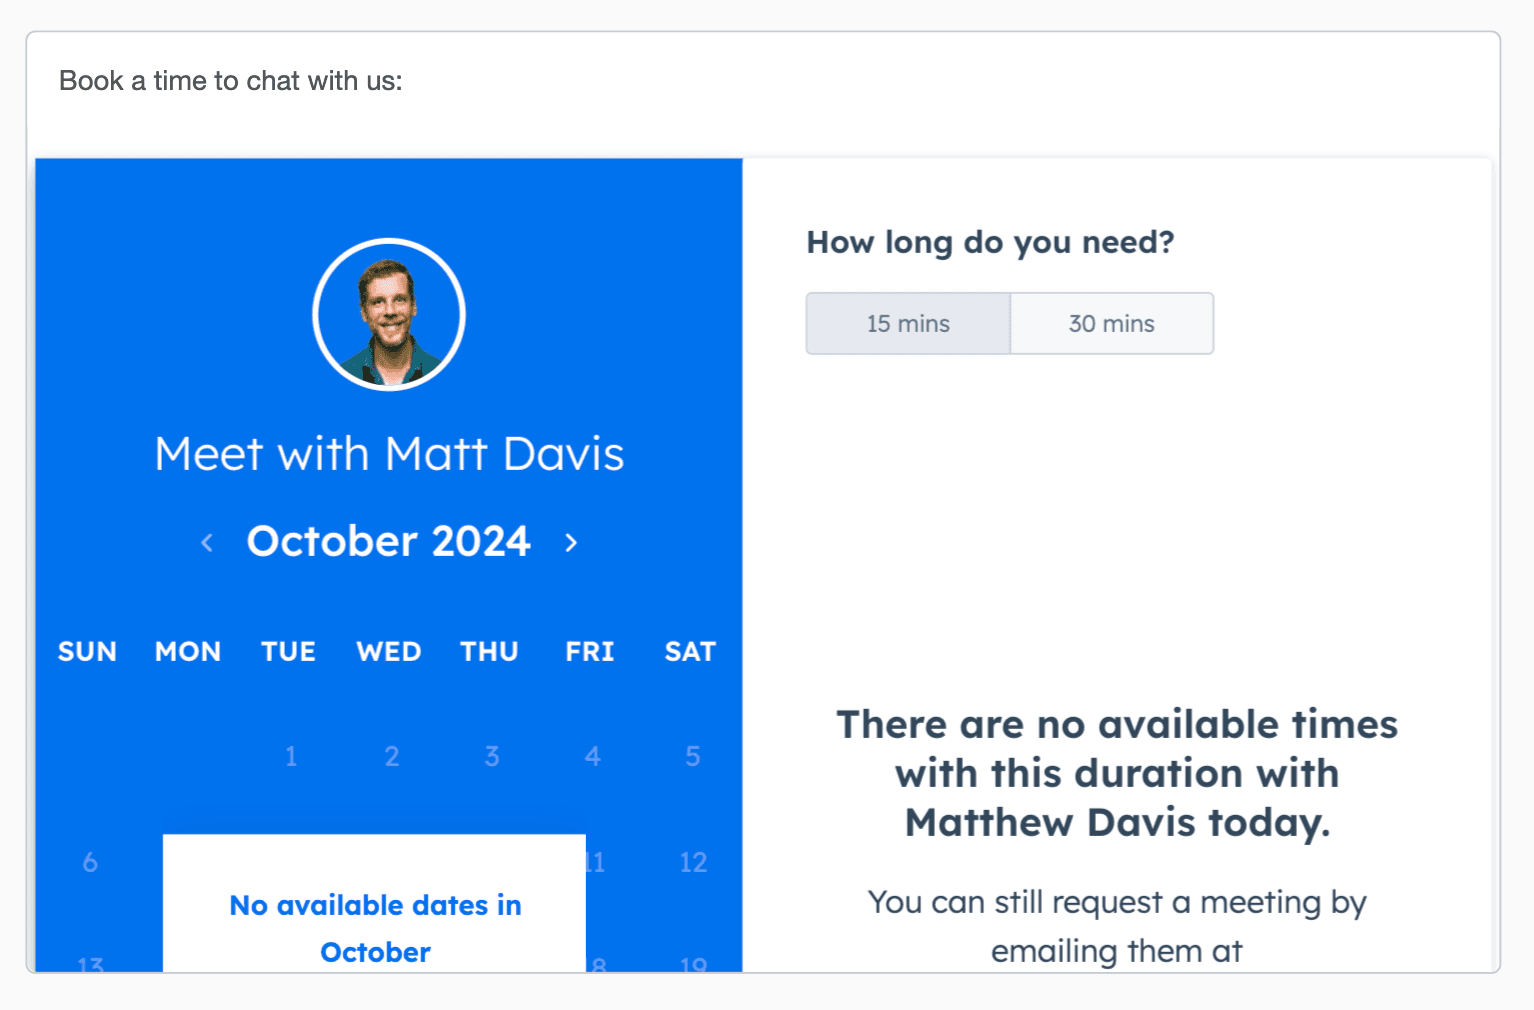
8. Calendar Apps
Integrate calendars to show project timelines, content schedules, or important dates. You can also embed calendar scheduler grids (such as Calendly) to create a direct and easy point of contact. This keeps everyone aligned on timelines, improves project management, and facilitates discussion.
9. Forms
Display forms used in campaigns for lead generation or surveys—or use tools like Typeform and Gravity Forms (via a client’s WordPress site) to gather feedback from clients directly in your reports and dashboards. This way, clients can submit comments and reviews, and provide feedback on their campaign performance.
10. Graphs & Data From Third-Party Platforms
Include analytical graphs from platforms like HubSpot or Salesforce. This presents complex data in an easy-to-understand format, supporting strategic discussions with visual aids.
11. Google Slides
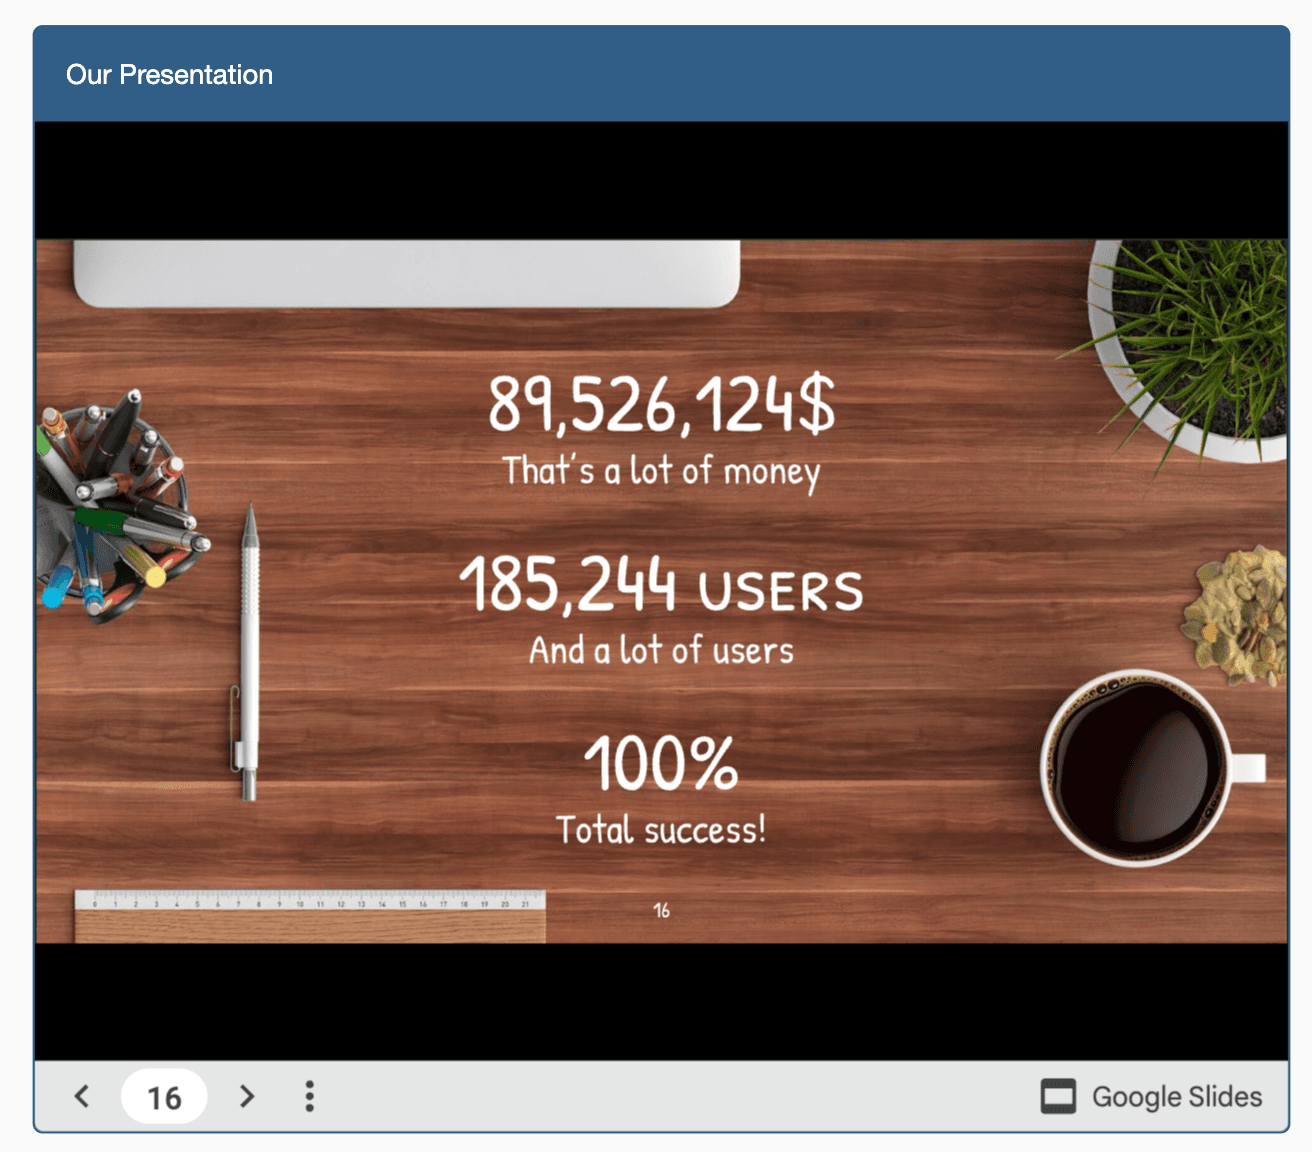
Embed presentations to provide report summaries within the dashboard. Use slides for announcements and to present new agency services. This allows for a cohesive picture-in-picture presentation of strategies and results, all within a single report interface.
12. Videos
Embed instructional videos, campaign videos, teasers, or testimonials via YouTube, Vimeo, TikTok, Loom, and more. This enhances the interactivity of the report and provides a richer, multimedia experience that explains complex topics easily.
Additional Notes:
🔐 Ensure that any embedded app does not require client login to view the content, as this will restrict visibility.
🦄 Go wild! You can embed multiple widgets up to a maximum of 50 per report or dashboard. View the full tutorial here.
🛟 Need help? AgencyAnalytics offer 24/5 chat support. Reach out if you need assistance navigating or understanding any aspects of your reports, or visit our Help Center for more tutorials and resources.
Customize Your Reports To Let Your Agency Shine
Embeddable widgets offer significant opportunities to enhance your reporting capabilities and client engagement.
However, remember to approach widget integration with a strategy that prioritizes clarity and relevance. Avoid the temptation to overload your reports with too many widgets or overly complex data that will obscure key insights.
Less is more. Don't overwhelm a client with tons of widgets and complex reports. Report on the KPIs that you know matter.
David Friedman, Technical SEO Manager, PaperStreet Web Design
Ready to see how AgencyAnalytics transforms client reporting? Experience firsthand how customizable widgets enhance marketing campaigns—because when your reports shine, so does client satisfaction. Start your 14-day free trial today!

Written by
Francois Marchand brings more than 20 years of experience in marketing, journalism, content production, and artificial intelligence (AI). His goal is to equip agency leaders with innovative strategies and actionable advice to succeed in digital marketing, SaaS, and ecommerce.
Read more posts by Francois MarchandSee how 7,000+ marketing agencies help clients win
Free 14-day trial. No credit card required.


